DETERMINANTS OF HEALTH - NEEDS ASSESSMENTS 2020 Gold Coast Primary Health Network
←
→
Page content transcription
If your browser does not render page correctly, please read the page content below
Gold Coast Primary Health Network
NEEDS ASSESSMENTS 2020
DETERMINANTS OF HEALTH

DETERMINANTS OF HEALTH
Local health needs and service issues
• There are a number of social determinants which may impact negatively on the health and wellbeing of Gold
Coast residents

• Numerous SA3 regions on the Gold Coast have a high rate of need for assistance with a profound or severe
disability compared to Queensland rate

• The Gold Coast rate of culturally and linguistically diverse people above the Queensland rate

• Limited of social housing on the Gold Coast

• Unemployment rate is predicted to increase due to COVID-19 with Gold Coast people employed by con-
struction, retail trade, accommodation and food services, rental, hiring and real estate services all above the
Queensland rate

• Several Gold Coast regions above the Queensland rate with families with children with no parent employed
DETERMINANTS OF HEALTH
Determinants of Health
Many factors combine to affect the health of individuals and communities. Whether people are healthy or
not, is determined by their circumstances and environment. Factors such as where one lives, the state of the
environment, genetics, income, education level and relationship with friends and family all have significant im-
pacts on health. The determinants of health are “A factor or characteristic that brings about a change in health,
either for the better or the worse” 1.

Determinants of health include:
       • The social and economic environment
       • The physical environment
       • The persons individual characteristics and behaviours

Determinants can be categorised into:
       • Distal Determinants
		o Social
		o Environmental
		              o Health Services
       • Proximal Determinants
		o Individual

          Keleher,H & Murphy,B, 2004, Understanding health : a determinants approach. Edited by Keleher, Helen and Murphy, Bernadette, Oxford University Press, Oxford, England.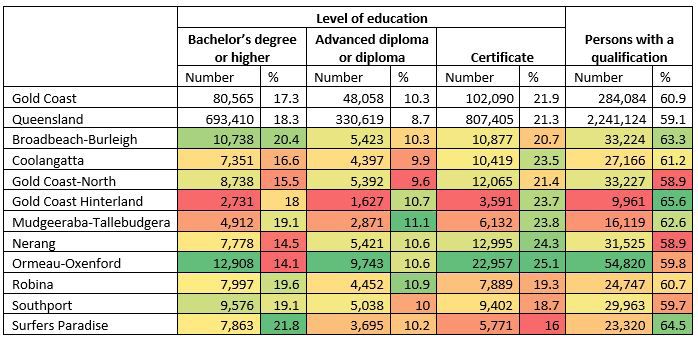
Socioeconomic status and health
 There are numerous determinants of health and wellbeing in Australia with of one these determinants being
 socioeconomic status. The higher a person’s income, education and or occupation level, the healthier they tend
 to be. Data shows that people from lower socioeconomic regions are at greater risk of poor health outcomes.

 Socioeconomic status is the social standing of an individual as measured as a grouping of education, income
 and occupation. It has been stated that every level higher of socioeconomic status is related to better health of
 an individual. The Australian Bureau of Statistics broadly defines relative socio-economic advantage and disad-
 vantage in terms of people’s access to material and social resources and their ability to participate in society. A
 SEIFA score is a relative measure and cannot be used to say that an area is disadvantaged, only that it is advan-
 taged relative to other areas in Australia.

 There is clear evidence that health and illness are not distributed equally within the Australian population.
 Variations in health status generally follow a gradient, with overall health tending to improve with improve-
 ments in socioeconomic status2 .

 A complete measure of all socioeconomic characteristics is the Socio-Economic Indexes for Areas (SEIFA). The
 SEIFA table shown below which is created by the Australian Bureau of Statistics after each Census of
 Population and Housing using area-based population attributes such as low income, low educational
 attainment, high unemployment and jobs in relatively unskilled occupations (Table 1).
 Table 1. Population by Socioeconomic index for Areas for Australia, Queensland, Gold Coast including SA3 regions, 2016

Source: ABS 2033.0.55.001 Census of Population and Housing: Socio-Economic Indexes for Areas (SEIFA), Australia, 2016, (Queensland Treasury de-
rived).

 Table one breaks down each Gold Coast SA3 region into five quintiles from 1 being most disadvantaged and
 quintile 5 being least disadvantaged. Gold Coast-North (22.6%) and Southport (25.9%) were the highest regions
 in the most disadvantaged quintile, while Mudgeeraba-Tallebudgera (35.8%) was the highest SA3 region among
 the least disadvantaged regions.

   Kawachi I, Subramanian SV & Almeida-Filho N 2002. A glossary for health inequalities. Journal of Epidemiology and Community Health 56:647–52

Figure 1. Gold Coast Index of relative socio-economic advantage and disadvantage by SEIFA scores, SA2 regions, 2016

 Source: Australian Bureau of Statistics, Socio-Economic Indexes for Australia (SEIFA), 2016. 2033.0.55.001
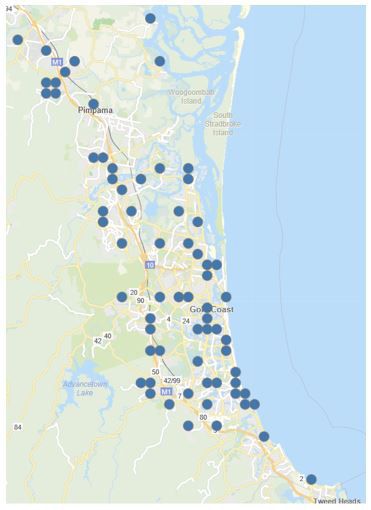
Figure one shows the Gold Coast Index of relative socio-economic advantage and disadvantage by SEIFA scores
 mapped by SA2 regions. The regions with the highest scores for SEIFA were Hope Island (1080) and Bundall
 (1077) while Labrador (925) and Coombabah (930) had the lowest SEIFA scores on the Gold Coast.

 When looking at the larger geographies, (Statistical Area Level 3 and 4) it can lead to a “vanilla” effect. Meaning
 that the larger geographies can mask the concentrated pockets of disadvantage on the Gold Coast as can be
 seen below within the Robina SA3 region.

 On the Gold Coast, there is suburbs within SA3 regions that have lower SEIFA scores compared to the surround-
 ing suburbs. These suburbs appear within a SA3 region as a region with a high SEIFA score. Robina SA3 region
 consists of four suburbs:

            • Clear Island Waters
            • Robina
            • Varsity Lakes
            • Merrimac

 Figure 2 highlights that within a SA3 or SA2 region, it can be made up of numerous SA1 regions with varying
 SEIFA scores.
Figure 2. Heat map of Varsity Lakes and surrounding SA1 regions, 2016.

   Source: Australian Bureau of Statistics, Census of Population and Housing: Socio-Economic Indexes for Areas (SEIFA), Australia, 2016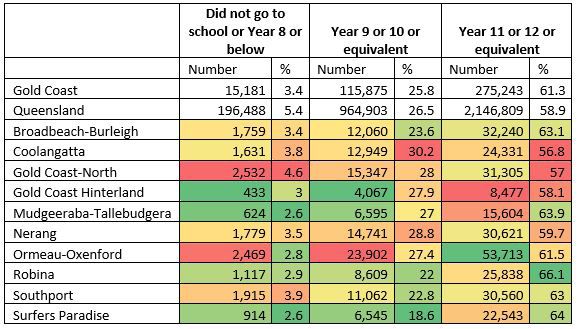
The Queenslanders 2018 report identified
• 18% of Queensland adults lived in the most socioeconomically disadvantaged areas compared with 20% in
the most advantaged areas in 2016 3.

• Potentially preventable hospitalisations in disadvantaged areas were 84% higher than advantaged areas in
2015-16.

• In the most disadvantaged areas, smoking was 2.4 times higher in comparison to the advantaged areas in
2018 4.

                  3. Australian Bureau of Statistics. Population by age and sex, regions of Australia. Cat. no. 3235.0. ABS: Canberra; 2016
                  4. Department of Health. Queensland preventive health surveys. Published and unpublished analysis. Queensland Government: Brisbane; 2018. Available: https://www.health.qld.gov.au/research-reports/ population-health/
                  preventive-health-surveys/ results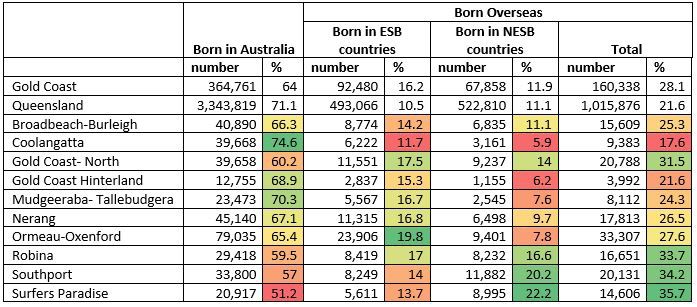
Social Determinants

The World Health Organisation describes social determinants as “The circumstances in which people grow, live,
work and age, and the systems put in place to deal with illness. The conditions in which people live and are, in
turn, shaped by political, social, and economic forces” 5.

Total Person Income

Higher income and social status are linked to better health. The greater the gap between the richest and poor-
est people, generally the greater the differences in health 6. On the Gold Coast in 2016, the median total person
income was $34,580 per year, slightly above the Queensland rate $34,320. Ormeau-Oxenford had the highest
median total personal income $38,012, while Southport had the lowest median total personal income with
$29,900 per year.
Table 2. Total personal income, Queensland, Gold Coast including SA3 regions, 2016 .

    Source. ABS, Census of Population and Housing, 2016, General Community Profile - G02 and G17

Education

Higher educational achievement can play a significant role in shaping employment opportunities, increase the
capability for better decision-making regarding one’s health and provide opportunity for increasing social and
personal resources that are essential for physical and mental health 7.

       5. CSDH (Commission on Social Determinants of Health) 2008. Closing the gap in a generation: health equity through action on the social determinants of health. Final report of the Commission on Social Determinants of
       Health. Geneva: World Health Organization
       6. Braveman, P., & Gottlieb, L. (2014). The Social Determinants of Health: It’s Time to Consider the Causes of the Causes. Public Health Reports, 129(1_suppl2), 19-31. doi:10.1177/00333549141291s206
       7. Shankar, J., Ip, E., Khalema, E., Couture, J., Tan, S., Zulla, R., & Lam, G. (2013). Education as a Social Determinant of Health: Issues Facing Indigenous and Visible Minority Students in Postsecondary Education in Western
       Canada. International Journal of Environmental Research and Public Health, 10(9), 3908-3929. doi:10.3390/ijerph10093908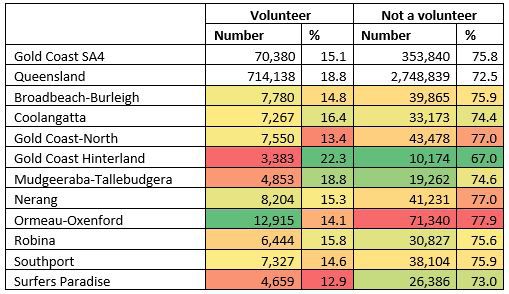
Australian Early Development Census

The foundations of adult health are laid in early childhood . The different domains of early childhood
development include:

• Physical health and wellbeing
• Social competence
• Emotional maturity
• Language and cognitive
• Communication skills and general knowledge

These domains are assessed in the Australian Early Development Census (AEDC) which reports whether
children are on track, at risk or developmentally vulnerable across each of the five domains. Children that are
developmentally vulnerable demonstrate much lower than average competencies in that domain.

On the Gold Coast in 2018, 22% of children were developmentally vulnerable in one or more domains which
was below the Queensland rate of 25.9%. The social competence domain had the largest percentage of
developmentally vulnerable children (10.3%). Ormeau-Oxenford had the largest percentage of developmentally
vulnerable children in two or more domains (13.4%) as well as having the highest number of children assessed
on the Gold Coast (2,234) 9 .
Figure 3. Rate of developmentally vulnerable children across one more domains, Queensland, Gold Coast including SA3 regions, 2018

    Source: Australian Early Development Census, 2018

8. Camargo, K. R. (2011). Closing the gap in a generation: Health equity through action on the social determinants of health. Global Public Health, 6(1), 102-105. doi:10.1080/17441692.2010.514617
9. Australian Early Development Census, 2018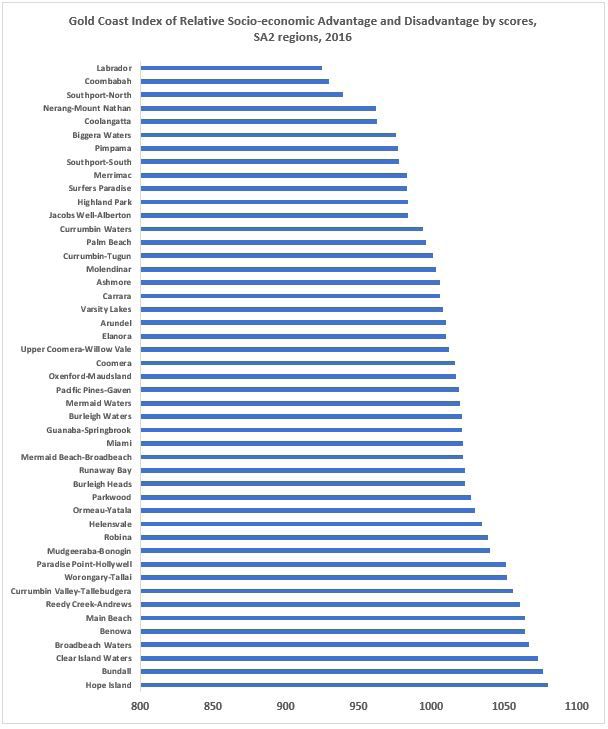
Highest level of Schooling

In 2016, 275,242 people on the Gold Coast (61.3%) the highest level of schooling was year 11 or 12. Within the
region, Robina had the largest percentage of whose highest level of schooling was year 11 or 12 (66.1%). Gold
Coast-North had the largest percentage whose highest level of schooling was year 8 or below (or did not go to
school) with 4.6%.
Table 3. Highest level of schooling, Queensland, Gold Coast including SA3 regions 2016

 Source: ABS, Census of Population and Housing, 2016, General Community Profile - G16

Secondary Education

It has been reported, young adults who don’t engage in secondary education are likely to experience a
lower socio-economic status than those who acquire further education 10 . on the Gold Coast in 2016, 284,084
persons (60.9%) had a non-school qualification, slightly above the Queensland rate of 59.1%. Within the region,
Gold Coast Hinterland had the largest percentage of persons with a non-school qualification (65.6%) while Gold
Coast-North and Nerang had the smallest percentage on the Gold Coast (58.9%) of persons with a non-school
qualification.

      10. Canadian Council on Learning. State of Learning in Canada: Toward a Learning Future. .
Table 4. Non-school qualification by level of education by SA3, Queensland, Gold Coast including SA3 regions, 2016.
(a) Includes bachelor’s degree, graduate diploma, graduate certificate and postgraduate degree
(b) Includes Certificate, I, II, III and IV and Certificates not further defined responses
(c) Includes inadequately described and not stated level of education responses.
Source: ABS, Census of Population and Housing, 2016, General Community Profile - G40 and G46
Disability
Disability is defined as resulting “From the interaction between persons with impairments and attitudinal and
environmental barriers that hinders their full and effective participation in society on an equal basis with
others 11. Reports have indicated that 35% of people with disabilities report poor or fair health, compared with
5% of people without disabilities 12 13 .
Persons with a profound or severe disability are defined as needing help or assistance in one or more of the
three core activity areas of self-care, mobility and communication because of a long-term health condition, a
disability or old age.
The Gold Coast rate (4.9%) was below the Queensland rate (5.2%) in 2016 for people with a disability who
require assistance. Three Gold Coast SA3 regions were above the Queensland rate while Surfers Paradise had
the lowest rate (3.6%).
Table 5. Need for assistance with a profound or severe disability by SA3, Gold Coast and Queensland, 2016
Source: ABS, Census of Population and Housing, 2016, General Community Profile - G18COVID -19 has greatly impacted the assistance and care for a range of Australia’s disabled population. The
hearing-impaired community have been particularly affected with the large-scale introduction of face masks.
Within the current ideology that face masks and PPE are becoming the new normal, the deaf community are
finding an increasing number of barriers to communication. Within the hearing-impaired community sign and
body language are critical tools utilised in communication, both of which are drastically affected through the
introduction of face masks within primary and acute care settings. In 2016 the AHIW reported 1 in 10
Australians identified as complete or partially deaf and 1 in 7 reported wearing a hearing aid. These statistics
identify that this is a considerable concern for many Australians 14.
Culturally and linguistically diverse populations
The Gold Coast population includes many people who were born overseas, have a parent born overseas or
speak a variety of languages. Research in several countries with high immigrant populations, including Aus-
tralia, has found that migrant populations are often healthier than Australian born populations 15. The healthy
migrant effect can disappear after immigrants have lived in Australia for a long time. A study found that when
immigrant groups from non-English speaking countries have been in Australia for more than 10 years, their
mental health and self-assessed health were worse compared to Australian born individuals 16. This was more
common in immigrants from non-English speaking countries. English proficiency may affect this as a language
barrier could obstruct an individual’s access to health services and have an impact on employment which has
broader socioeconomics implications.
Table 6. Country of birth by SA3, Queensland, Gold Coast including SA3 regions, 2016
Source: ABS, Census of Population and Housing, 2016, General Community Profile - G01 and G09
ESB: Based on the main English-speaking countries of UK, Ireland, Canada, USA, South Africa and New Zealand
NESB: Includes countries not identified individually, ‘Inadequately described’ and ‘At sea’ responses.
Does not include stated responses
15. Kennedy S, Kidd MP, McDonald JT & Biddle N 2014. The healthy immigrant effect: patterns and evidence from four countries. Journal of International Migration and Integration 16(2):317–32.
16. Jatrana S, Richardson K & Samba SRA 2017. Investigating the dynamics of migration and health in Australia: a longitudinal study. European Journal of Population. doi:org/10.1007/s10680-017-9439-zIn 2016, 160,338 or 28.1% of the Gold Coast population was born overseas which was above the Queensland
rate of 21.6%. Within the region, Ormeau-Oxenford SA3 had the largest number of persons born overseas with
33,307 while Surfers Paradise had the largest percentage of persons born overseas with 35.7%.
The top five English speaking backgrounds and non-English speaking backgrounds for Gold Coast SA4 were:
Environmental
The physical environment in which people live and work can shape their health outcomes throughout their life.
Environmental health focuses on the physical, chemical, biological, and social factors which affect people within
their surroundings.
Physical environment
Poor physical home environments may be a potential source of stress for children through daily experiences
and produce poor health outcomes 17 18 . Access to appropriate, affordable, and secure housing can limit the risk
of being social excluded by factors such as homelessness, overcrowding and poor physical and mental health.
The number of applications for social housing that have been approved, approved- deferred or approved-
waiting further information for where the individual associated with the applicant first locational preference on
the Gold Coast was 2,742 in 2019 and increase from 2,165 in 2018, a relative increase of 27%19 .
Of the 2,742, 28% of applicants indicated that they are:
• Living on the streets,
• Existing housing is makeshift or illegal,
• Is fleeing domestic violence,
• Is at risk of violence/abuse from another person,
• Loss of accommodation due to a residential service or caravan park closure,
• Their existing housing is temporary and supported accommodation such as refuge, shelter or
crisis accommodation.
17 Shaw, M. (2004). Housing and Public Health. Annual Review of Public Health, 25(1), 397-418. doi:10.1146/annurev.publhealth.25.101802.123036
18 Schmeer, K. K., & Yoon, A. J. (2016). Home sweet home? Home physical environment and inflammation in children. Social Science Research, 60, 236-248. doi:10.1016/j.ssre-
search.2016.04.001
19 Queensland Government Open Data Portal, Social Housing RegisterFigure 4. Family type of applications for social housing as Gold Coast for their first locational preference, 2019
Source: Queensland Government Open Data Portal, Social Housing Register
House affordability and housing stress
One of the more common measures of housing is the “30/40 rule”. Housing affordability is compromised when
households in the bottom 40% of income distribution spend more than 30% of their household income on
housing, adjusted for household sizes 20. One Australian study, found that experiences common to stressed
renters and stressed recent purchasers included the constant stress associated with lack of money (which
contributed to health problems and stress on family relationships) and financial hardship outcomes (such as
children missing out on school activities and adequate health care).
On the Gold Coast in 2016, 36.4% of low-income households were under financial stress from mortgage or rent
which was above the Queensland rate of 30.1%. Southport had the largest percentage of people under finan-
cial stress from mortgage or rent with 40% while Gold Coast Hinterland had the least (26.7%).
20. Yates, J., & Milligan, V. (2007). Housing affordability: A 21st century problem. National research venture 3: Housing affordability for lower income Australians (AHURI Final Report No. 105).
Retrieved 28 March 2008, from http://www.ahuri.edu.au/publications/download/nrv3_final_reportFigure 5. Percentage of low-income households under financial stress from mortgage or rent, Queensland, Gold Coast including SA3 regions, 2016
Source: Public Health Information Development Unit (PHIDU)
Unemployment
A study analysed participants behavioural risk factors and identified unemployed individuals had poorer per-
ceived mental health profiles, were more likely to delay health care services due to cost and were less likely to
have access to health care than employed participants 21.
As of September 2019, a total of 21,130 people on the Gold Coast were unemployed (5.8%), slightly below
the Queensland rate (6.2%). Within the region, Gold Coast-North had the highest unemployment rate of 8.3%
while Mudgeeraba-Tallebudgera had the lowest unemployment rate (4.2%).
Table 7. Unemployment by SA3, Queensland, Gold Coast including SA3 regions, September quarter 2019
Source: Australian Government Department of Education, Skills and Employment, Small Area Labour Markets Australia, various editionsFamilies with children with no parent employed
Children living in families lacking secure parental employment are vulnerable. Without at least one parent
employed full time, children are more likely to fall into poverty and effect the wellbeing of the child22 . It has
been identified children from families with no parent employed were at greater risk of socioemotional
problem behaviour compared with those where a parent was continuously employed. The study further
explained family and mother’s employment were associated with a lower risk of problem behaviour for
children in middle childhood, in part explained by sociodemographic characteristics of families and the
apparent psychological and socioeconomic benefits of employment 23
Analysing local data identified that the Gold Coast PHN region rate of total families with no parent employed
was slightly below the Queensland rate in 2016. As can be seen below, three Gold Coast SA3 regions were
above the Queensland rate of total families with no parent employed.
Table 8. Families with children with no parent employed, Queensland, Gold Coast including SA3 regions, 2016
Source: ABS, Census of Population and Housing, 2016, unpublished data (families)
Southport and Gold Coast-North which had the two highest rate of families with no parent employed were also
the two SA3 regions on the Gold Coast with the lowest socio-economic indexes for areas on the Gold Coast. In
2011 the same report identified that Southport and Gold Coast-North were also regions on the Gold Coast with
the lowest socio-economic indexes for areas on the Gold Coast suggesting that cross generational impacts are
cumulative.
Southport, Gold Coast-North and Surfers Paradise SA3 regions were all above the Queensland rate in 2016 for
families with children with no parent employed. Analysing these three SA3 regions at a granular level, there is a
large variance between the SA2 regions that have families with no parent employed.
22 Frasquilho, D., de Matos, M.G., Marques, A. et al. Unemployment, Parental Distress and Youth Emotional Well-Being: The Moderation Roles of Parent–Youth Relationship and Financial
Deprivation. Child Psychiatry Hum Dev 47, 751–758 (2016). https://doi.org/10.1007/s10578-015-0610-7
23 Hope, S., Pearce, A., Whitehead, M., & Law, C. (2014, October). Family employment and child socioemotional behaviour: longitudinal findings from the UK Millennium Cohort Study.Table 9. Families with children with no parent employed Queensland, Gold Coast, Southport SA3 including Southport SA2 regions Table 10. Families with children with no parent employed Queensland, Gold Coast, Gold Coast-North SA3 including Gold Coast-North SA2 regions Table 11. Families with children with no parent employed Queensland, Gold Coast, Surfers Paradise SA3 including Surfers Paradise SA2 regions Source: ABS, Census of Population and Housing, 2016, unpublished data (families)
Crime
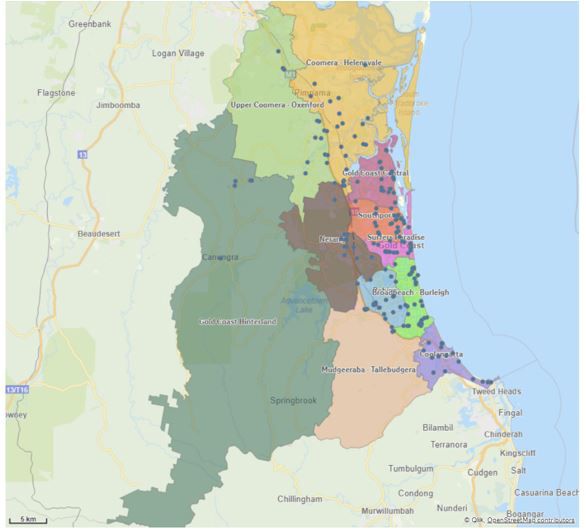
Fear of crime is associated with poorer mental health and greater limitations in physical functioning 24. On
the Gold Coast in 2018-19, there was 62,970 offences or 9,870 per 100,000 people which was below the
Queensland rate of 10,306 per 100,000 people.
Figure 6. Total number of reported offences per 100,000 people, Queensland, Gold Coast including SA3 regions, 2018-19
Source: Queensland Police Service
Data is based on the location in which the offence occurred
Domestic Violence
Domestic violence is a national health and welfare issue that can have lifelong impacts for victims and
perpetrators. The number of domestic violence applications (Magistrates Courts with the most lodgements)
initiating applications was highest at Southport magistrate’s court in Queensland in 2017/18. Although
Southport magistrate’s court had the highest number of applications for domestic violence orders, a relative
decrease of 16% from 2015/16 to 2017/18 occurred (Please see GCPHN family and domestic violence needs
assessment for detailed breakdown)
Figure 7. Domestic violence order applications initiating applications only, Queensland, 2017-18
Source: https://www.courts.qld.gov.au/court-users/researchers-and-public/stats
Mai Stafford, Tarani Chandola, Michael Marmot, “Association between Fear of Crime and Mental Health and Physical Functioning”, American Journal of Public Health 97, no. 11 (November 1, 2007): pp. 2076-2081.Volunteering
It has been observed that people who engage in voluntary work report better health and greater happiness
than people who don’t, a relationship that isn’t driven by socio-economic differences between volunteers and
non-volunteers 25 .
In 2016 on the Gold Coast, 70,380 or 15.1% of people undertook voluntary work, which was lower compared
to the Queensland rate of 18.8%. Within the region, Gold Coast Hinterland had the largest percentage of
persons who undertook voluntary work (22.3%) while Surfers Paradise (12.9%) had the smallest percentage of
volunteers.
Table 12. Voluntary work by SA3, Gold Coast SA4 and Queensland, 2016
Includes voluntary work not stated
Source: ABS, Census of Population and Housing, 2016, General Community Profile - G19
Health Services
Access to health services (Primary, secondary, tertiary care) is an important determinant to health. Inequalities
in access to health care including barriers faced by certain populations, such as the lack of cultural competence
or the number of General Practitioners that are available after-hours 26.
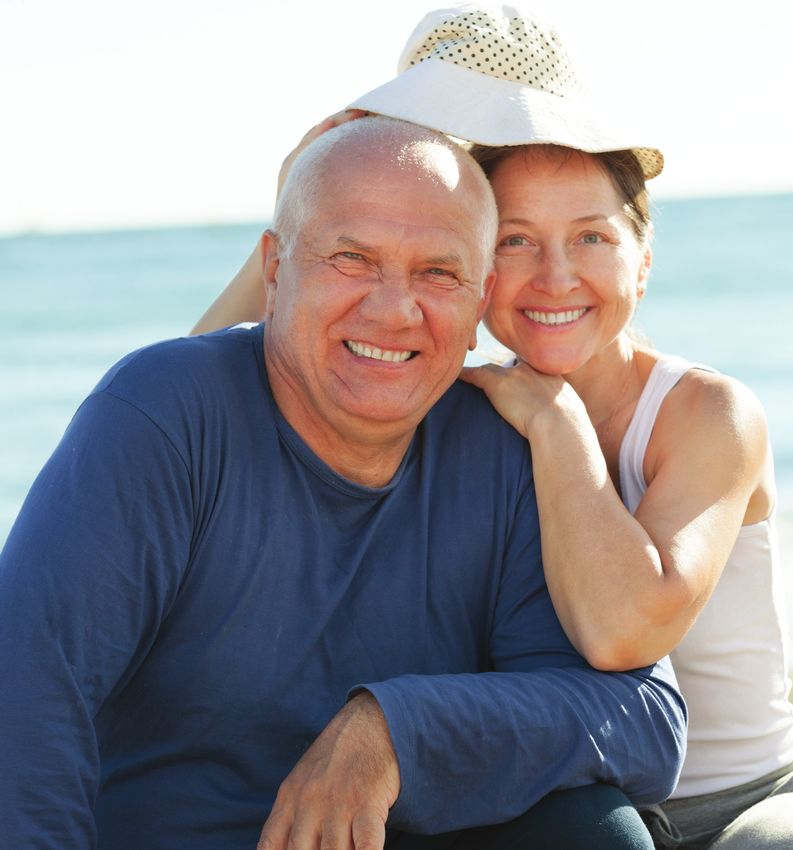
The Gold Coast is generally well serviced with 818 General Practitioners across 205 General Practices as of 3rd
March 2020 throughout the Gold Coast.
25. Borgonovi, F. (2008). Doing well by doing good. The relationship between formal volunteering and self-reported health and happiness. Social Science & Medicine, 66(11), 2321-2334. doi:
10.1016/j.socscimed.2008.01.011Table 13. Number of General Practices and General Practitioners on the Gold Coast including SA3 regions, February 2020 Source: GCPHN CRM Tool Figure 8. Average number of GP attendances per person, age-standardised, National, Gold Coast including SA3 regions, 2016-17
Figure 9. General Practices on the Gold Coast, February 2020

Emergency Departments

Gold Coast is well serviced with two public hospitals and three private hospitals. The two Gold Coast public
Hospitals are located at Southport and Robina. Gold Coast University Hospital Emergency Department (ED) is
the busiest ED in Queensland. Triage category 4 and 5 presentations, which comprised 30% of all ED
presentations in 2017-18 on the Gold Coast, are often used an indicator of presentations that can be managed
by general practice or primary health (i.e. non-urgent care). Gold Coast public hospitals have one of the lowest
rates of triage category four and five ED presentations among the 31 Primary Health Network regions in
Australia (69 lower urgency ED presentations per 1,000 population in 2017-18 compared to national rate of
117.0) 27.

          27. Australian Institute of Health and Welfare analysis of the National Non-admitted Patient Emergency Department Care Database, 2015–16, 2016–17 and 2017–18
Proximal Determinants
Proximal determinants refer to any determinant of health that is readily and directly associated with the
change in health status.
Physical Activity
Physical activity includes both structured activities such as sport or organised recreation and unstructured ac-
tivities such as incidental daily activities at work or home. Physical inactivity accounted for 6.6% of the burden
of disease in Australia in 200328 . Being physical active:
• Reduces the risk of all-cause mortality29
• Improves self-esteem, self-image, and quality of life30
• Is an important factor in preventing and managing a range of chronic diseases, including type 2 diabetes,
stroke, hypertension, and heart disease 31
In 2018, 63.3% of Gold Coast residents aged 18 and over undertook sufficient physical activity while 8.1% were
inactive. Sufficient physical activity for adults for the purpose of this report is based on physical activity guide-
lines 2014 requiring >150 minutes of physical activity or >75 minutes of vigorous activity) per week over five or
more sessions.
Figure 10. Activity status among Gold Coast and Queensland residents, 2018
Source: Queensland Health. The health of Queenslanders 2018. Report of the Chief Health Officer Queensland. Queensland Government. Brisbane 2018
28 Begg S, Vos T, Barker B, Stevenson C, Stanley L, Lopez AD. The burden of disease and injury in Australia 2003. Canberra: Australian Institute of Health and Welfare, 2007.
29 Woodcock J, Franco OH, Orsini N, Roberts I. Non-vigorous physical activity and all-cause mortality: systematic review and meta-analysis of cohort studies. Int J Epidemiol 2011;40(1):121–38
30 Warburton DE, Nicol CW, Bredin SS. Health benefits of physical activity: the evidence. Can Med Assoc J 2006;174(6):801–9
31 Janssen I, Leblanc AG. Systematic review of the health benefits of physical activity and fitness in school-aged children and youth. Int J Behav Nutr Phys Act 2010; 7:40Dietary pattern The health benefits of a dietary pattern consisting of a variety of nutritious foods in appropriate amounts leads to a reduced risk of chronic disease and improved health outcomes 32 33 . In 2018, 53.8% of Gold Coast residents met the guidelines for recommended daily serves of fruit (2 or more serves) while 9.6% of Gold Coast residents met the guidelines for serves of vegetables (5-6 or more serves for people aged 18 and over). Figure 11. Daily intake of fruit and vegetables among Gold Coast and Queensland residents, 2018 Source: Queensland Health. The health of Queenslanders 2018. Report of the Chief Health Officer Queensland. Queensland Government. Brisbane 2018 Alcohol and Tobacco Alcohol is the sixth highest risk factor contributing to the burden of disease in Australia. Alcohol use contributed to several diseases and injuries including: • 100% of the burden due to alcohol use disorders • 40% of the burden due to liver cancer • 28% of the burden due to road traffic injuries • 14% of the burden due to suicide and self-inflicted injuries34 . Lifetime risk of drinking alcohol is consumption of an average of >2 standard drinks per day. In 2017-18 on the Gold Coast, 17.9% of people’s alcohol consumption was defined as lifetime risk, this was above the national rate of 16% for people aged 18 years and over 35. Tobacco is the leading preventable cause of morbidity and mortality in Australia. In 2015, tobacco smoking was responsible for 9.3% of the total burden of disease and injury. Estimates for the burden of disease attributable to tobacco use showed that cancers accounted for 43% of this burden 36. Data collected through the national health survey suggested that 16.7% of the Gold Coast population 34 AIHW 2019c. Australian burden of disease study: Impact and causes of illness and death in Australia 2015. Series no.19. BOD 22. Canberra: AIHW 35 ABS 2019. Microdata: National Health Survey, 2017–18. ABS cat no. 4324.0.55.001. Canberra: ABS. Customised data report. 36 AIHW 2019c. Australian burden of disease study: Impact and causes of illness and death in Australia 2015. Series no.19. BOD 22. Canberra: AIHW 37 ABS 2019. Microdata: National Health Survey, 2017–18. ABS cat no. 4324.0.55.001. Canberra: ABS. Customised data report.
Figure 12. Rate of daily smokers and alcohol consumption (lifetime risk) for people aged 18 years and over, Gold Coast and National, 2017-18

Source. ABS 2019. Microdata: National Health Survey, 2017–18. ABS cat no. 4324.0.55.001. Canberra: ABS. Customised data report.

Healthy Communities

Living an active, healthy lifestyle is part of the culture of the Gold Coast and as individuals we make choices
each day that can have a positive impact on our health. City of Gold Coast provides several services and
facilities to improve the health and safety of residents and visitors through:
• Environmental health services- City of Gold Coast continually works to identify, prevent, and remedy health
and environment related hazards and health.

• Immunisation- Gold Coast Public Health Unit provides immunisation services for the city through immunisa-
tion clinics for children and annual school immunisation program’

• Active and healthy lifestyle- City of Gold Coast aim to positively influence physical activity and healthy eating
by offering many free and low-cost activities and activating a range of City facilities including parks, libraries,
community centres and aquatic centres.

              38 KRUGER, J., CARLSON, S., & KOHLIII, H. (2007). Fitness Facilities for Adults Differences in Perceived Access and Usage. American Journal of Preventive Medicine, 32(6), 500-505.
              doi:10.1016/j.amepre.2007.02.003
              39 Popular Parks for Fitness, Gold Coast City Council, 2019
Fitness Equipment Access to places and equipment for physical activity plays an important role in influencing physical activity behaviour 38. City of Gold Coast provides over 300 free fitness equipment facilities in Gold Coast parks which aim to improve fitness levels and general coordination amongst the population. Equipment varies in different parks and can include cross trainer, stepper, ab-hip swinger, ezy rider, shoulder press, rowing machine, cycle seat, butterfly press, push up and sit up boards 39. Fitness equipment is distributed throughout on the Gold Coast with much of the equipment distributed across the coastline, whilst Ormeau-Oxenford region had a limited number of fitness equipment with a fast-growing population. Figure 13. Fitness equipment on the Gold Coast, 2020 Source: City of Gold Coast Open Data, Fitness Stations, February 2020 Water Fountain Access to water fountains can promote the uptake of physical activity. The Gold Coast City has supplied over 500 water fountains on the Gold Coast as of February 2020. Water fountains are distributed throughout the Gold Coast with a large number of fountains distributed across the coastline which promotes physical activity and supports tourist demands. Ormeau—Oxenford region has a smaller number of water fountains compared to other regions on the Gold Coast. City of Gold Coast Open Data, Water Fountains, February 2020
Consultation

GCPHN Community Advisory Council
(July 2020) provided the following feedback
Are there any access issues to services or regions on the Gold Coast that lack services?
• The lack of availability of public and social/community housing

• Homelessness has increased in recent years and will no doubt continue to with the impacts of COVID-19 still
worsening for many

• Ormeau-Oxenford region has the largest population on the Gold Coast yet have low number of water
fountains and community fitness equipment for the community to utilise.

• Aged and disability continue to have access issues to health providers, a lot do not drive and if they do,
cannot afford parking or unable to walk the distance required, Telehealth can do so much in this space

GCPHN Clinical Council
(August 2020) provided the following feedback
• Language barrier can be a concern for patients who don’t speak English, having a translator has to be ar-
ranged prior to consultation

• Difficult to know of local GPs in the area who speak other languages other than English who a General
Practitioner could refer a patient to

• Telehealth has improved access to care during COVID-19 which is often a determinant to health

• Less cancellations of patients using telehealth has been noted during COVID-19

• There is still a need for face to face consultations as some things can be missed on a telehealth consultation
(skin checks etc) and digital divide (low social economic and literacy)
Gold Coast Primary Health Network
Primary Care Gold Coast (ABN 47152953092), trading as the Gold Coast Primary Health
Network.

Level 1, 14 Edgewater Court, Robina 4226 | PO Box 3576 Robina Town Centre QLD 4230
P: 07 5635 2455 | F: 07 5635 2466 | E: info@gcphn.com.au | www.gcphn.org.au

“Building one world class health system for the Gold Coast.”
Gold Coast Primary Health Network gratefully acknowledges the financial and other support
from the Australian Government Department of Health
You can also read