MITIGATING CLIMATE CHANGE THROUGH RENEWABLE ENERGY DEVELOPMENT - IRENA
←
→
Page content transcription
If your browser does not render page correctly, please read the page content below
MITIGATING CLIMATE CHANGE
THROUGH RENEWABLE ENERGY
DEVELOPMENT
CAPE TOWN, SOUTH AFRICA

  Cape Town has set out to boost its use of renewables for both electricity and heating

South Africa has established plans to reduce
its dependence on coal, which provides for
some 70% of the country’s primary energy
                                                     Cape Town’s
consumption and 95% of its electricity
generation (Department of Energy, South
                                                     target for
Africa, 2017). To substitute for coal-fired power
plants, South Africa has committed to increasing
                                                     renewables
its renewable generation capacity. This will help
fulfil its international climate change mitigation
                                                     is 20% of total
commitments to reduce greenhouse gas
(GHG) emissions made through a Nationally
                                                     energy use
Determined Contribution (NDC) to the Paris           by 2020
Agreement (Department of Energy, South
Africa, 2014; 2015).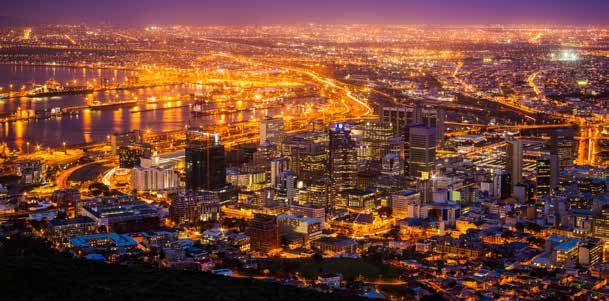
The National Development Plan (NDP) for South Africa indicates that an additional 29 000 megawatts
(MW) of electricity will be needed by 2030 and seeks to ensure that at least 20 000 MW of this expanded
capacity is sourced from renewable energy sources and liquefied natural gas (LNG); (Republic of South
Africa Government, 2017). Out of the total installed capacity, 27% will be sourced from renewables including
wind, solar photovoltaic (PV), hydro and concentrating solar power (CSP) by 2030 (Department of Energy,
South Africa, 2016). Private investment through the Renewable Energy Independent Power Producer
Procurement Programme (REIPPPP) has been a major catalyst for developing the renewable energy sector
(Energy Intelligence, 2016), contracting more than 6 300 MW of renewable capacity from more than 100
projects in four years at increasingly competitive prices.

The City of Cape Town has targeted major improvements to renewable energy generation and
efficiency in both the electricity and transport sectors. These commitments have been made in the
context of a business-as-usual scenario for 2040 that projects a two-fold increase in energy consumption
and greenhouse gas (GHG) emissions, and a ten-fold increase in energy costs for the municipality
(City of Cape Town, 2015a).

Accordingly, the city has undertaken initiatives and infrastructure projects aimed at reducing city-
wide electricity consumption and increasing renewable energy capacity. In the absence of national
legislation, the city has also regulated small-scale distributed energy (also called small-scale embedded
generation, or SSEG) and supported legal connections to the electricity grid in order to meet the needs
of its residential, commercial and industrial electricity consumers.

    Energy in South Africa
    South Africa has one of the largest economies in Africa in terms of GDP, amounting to approximately
    USD 316.4 billion in 2015.1
    The country is Africa’s largest energy consumer, accounting for some 30% of total primary energy
    consumption on the continent.
    South Africa is the continent’s largest CO2-emitter and, as of 2016 was the 13th largest emitter in the world,
    accounting for 468 million metric tons of carbon dioxide emissions from fuel combustion.
    Cape Town is both the largest city in terms of population and the economic hub of the Western
    Cape Province.
    Source: Department of Energy, South Africa, 2014; 2015; IEA, 2015; Global Carbon Atlas, 2018.

    1 Conversion rate is based on the average exchange rate for 2015 (1 ZAR = 0.07882 USD), generated at:
     www.oanda.com/currency/average

The challenges of coal reduction and meeting urban power demand
Cape Town is located on a peninsula in the South West of South Africa. As of 2016, it had four million
inhabitants, at a density of 1 619 people per square kilometre (City of Cape Town, 2017a; Statistics
South Africa, 2015). Like many other municipalities in South Africa, the sale of electricity provides part
of the city’s income. It purchases electricity from the state-owned electricity provider Eskom and then
serves as the retailer to all local electricity consumers.

The city has encountered challenges in providing electricity access and service, particularly to low-
income households, because Eskom is struggling to meet electricity demand in the face of a growing
population and rising living standards. A very narrow margin between peak demand and available
electricity supply, owing to poor maintenance and insufficient generation capacity, causes occasional
load-shedding to balance the system.

2       SCA LI N G U P RE N E WA B L E S I N C I T I E S : CA P E TOW N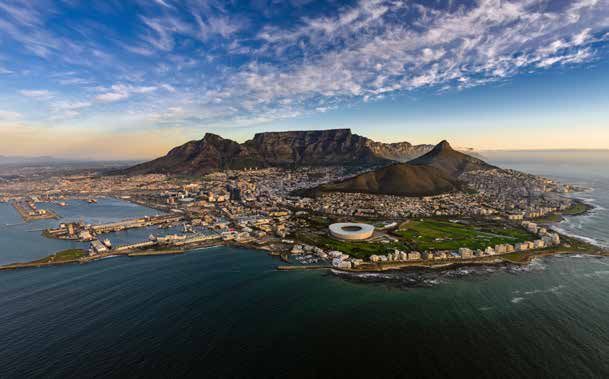
The lack of adequate preparations by Eskom for future capacity expansion and the replacement of old
equipment has resulted in a five-fold increase in electricity tariffs since 2009 (NERSA, 2009; City of
Cape Town, 2018). However, since 2017, economic contraction, consumer efficiency measures and the
commissioning of new coal-fired power stations have resulted in overcapacities in the short-to-medium
term. Energy security concerns, rising electricity prices and increasing awareness of the promise of
renewable energy technologies have prompted municipalities in South Africa to explore ways to play
a greater role in generation.
Currently, Eskom is responsible for 96% of electricity generation in South Africa and municipalities
require special permission from the national government to procure electricity from independent power
producers (IPPs); (Eberhard, Kolker and Leigland, 2014). Cape Town is now seeking such permission.
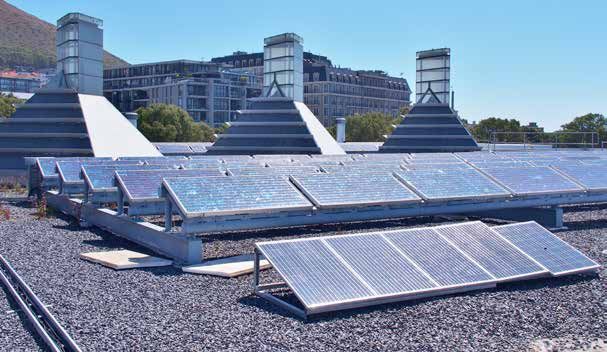
Municipal initiatives have prioritised sustainable procurement of renewable energy and deployed
rooftop solar PV on public buildings. In addition, they have focused on energy efficiency in buildings,
transport and street lighting, as well as on metering and monitoring.
The tariff for excess generation is not a significant incentive to invest in solar PV, but it allows consumers
to offset their electricity purchases, letting them connect to the electricity grid and thus avoid the cost
of purchasing batteries for energy storage. A limited utility bill credit is provided for surplus electricity
fed back into the grid. This tariff structure particularly suits commercial and industrial customers,
as their consumption primarily takes place during daytime when the sun is shining. However, when
industrial units shut down over weekends, the resulting large reverse flows of power into the grid are
challenging to manage.
Actions taken
The municipality has sought to increase renewable energy power generation (deploying 247 kW of
capacity and incentivising SSEG), as well as to reduce electricity consumption across Cape Town.
Activities include an electricity savings campaign encouraging both behavioural and technological
change; a solar water heater marketing and accreditation programme; and the establishment of the
technical and legislative conditions for rooftop solar PV to be legally connected to the electricity grid.
Municipal solar PV projects
Project name Capacity (kW)
Manenberg Housing 20 The tariff for excess
Electricity Services
Gallows Hill
100
10
generation allows
Wallacedene Taxi 20 consumers to offset
Khayelitsha 17
Royal Ascot 20 their electricity
Omniforum 60
purchases
Total 247
Source: SEA, 2017
3 SCA LI N G U P RE N E WA B L E S I N C I T I E S : CA P E TOW N
Cape Town has installed rooftop solar PV at numerous municipal buildings and facilities (Table 1)
with additional installations currently planned. This includes the Wallacedene taxi rank, the first
public transportation facility in South Africa to be rated by the Green Building Council of South
Africa. The Wallacedene complex has a maximum daily output potential of 130 kilowatt-hours (kWh)
and is supported by a storage system of 24 batteries with a capacity of 72 kWh in order to provide
uninterrupted electricity supply (Transport for Cape Town, 2014; GIZ, 2017).

The city also maintains four micro-hydro generation turbines at its water treatment plants. The
electricity generated at these four sites is sufficient for meeting 5% of the total electricity demand for
municipal operations (City of Cape Town, 2015b).

In the absence of relevant national legislation, Cape Town and 17 other municipalities in South Africa have
begun to facilitate SSEG in the residential, commercial and industrial sectors (GIZ, 2017). Cape Town has
implemented SSEG tariffs without requiring generators to obtain a generation license from the National
Energy Regulator of South Africa (NERSA), provided the user is a net consumer over the year (i.e. does
not generate more than is consumed). Motivated by environmental awareness, continually increasing
electricity prices and the steadily decreasing costs of solar technology, growing numbers of residents
are installing rooftop solar PV panels and requesting municipalities to allow them to connect to the grid.

Cape Town has developed policies and practices that it sees as consistent with existing national policies.
In particular, the city will not purchase electricity at a greater cost than Eskom-generated power and
will not allow customers to sell electricity in excess of purchases from the city over any consecutive
12-month period. Customers who wish to pursue SSEG are required to move to a special tariff (see box)
that incorporates a daily service charge in order to recoup the costs of operating the utility network
(City of Cape Town, 2017b). The municipal role is thus focused on tariff-setting, quality and standards.

    Electricity tariff structures in the City of Cape Town
    The price paid by the city for electricity fed into the municipal grid by both residential and non-residential
    small-scale embedded generators in 2017 is 78.53 cents (South African Rand [ZAR]), or 5.9 US cents
    (USD 0.059), per kilowatt hour (kWh).2 This is identical to the Eskom Megaflex (summer) Standard Time of
    Use tariff.
    Additionally, there is a daily service charge, held constant at ZAR 13.30 cent/kWh (USD 0.0091/kWh)3
    during 2016 and 2017, which covers the infrastructure costs of grid connectivity.
    Residential customers who do not generate their own electricity pay a tariff of ZAR 192.80 cents/kWh
    (USD 0.1448/kWh)4 for the first 600 kWh consumed per month. This is ZAR 66.07 cents/kWh
    (USD 0.0496/kWh) more than the tariff paid by small-scale embedded generators for the first 600 kWh
    consumed. For any electricity use over the initial 600 kWh drawn, the consumption tariff for small-scale
    embedded generators and regular customers is the same.
    Tariff structures offer a substantial subsidy to the most vulnerable – nearly half of total residential
    consumers.

    Source: City of Cape Town, 2017c; 2017d.

    2 Conversion rate is based on the average exchange rate for 2017 (1 ZAR = 0.07511 USD), generated at:
      www.oanda.com/currency/average
    3 Conversion rate is based on the average exchange rate for 2016 (1 ZAR = 0.06812 USD), generated at:
      www.oanda.com/currency/average
    4 Conversion rate is based on the average exchange rate for 2018 (1 ZAR = 0.07511 USD), generated at:
      www.oanda.com/currency/average

4        SCA LI N G U P RE N E WA B L E S I N C I T I E S : CA P E TOW N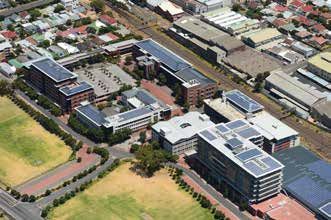
SSEG electricity assists the city in attaining its renewable energy targets. Furthermore, if grid
connection is maintained, Cape Town will continue to receive revenues from connection fees and
electricity sales. However, the challenge for municipalities is to achieve a high percentage of registered
installations in the absence of significant financial incentives. Of the estimated 6 MW of private
residential PV capacity in the city, approximately 5 MW is connected without paying a daily service
charge (City of Cape Town, 2017g).

                                                                                   Cape Town

                                                                Bruce Sutherland
                                                                                   and other
                                                                                   municipalities
                                                                                   have turned
                                                                                   to distributed
                                                                                   systems
Electricity Savings Campaign
Cape Town’s Electricity Savings Campaign (ESC) was initiated in 2009. The purpose of the campaign
is to reduce residential and commercial electricity consumption and related GHG emissions. The ESC
looks to accomplish this by initiating behavioural and technological changes.

Residential use accounts for 37% of total electricity consumption in Cape Town, while the commercial
sector accounts for 44% (City of Cape Town, 2015b). The residential portion of the ESC consisted of a
print and social media campaign, detailed information made available on the savingelectricity.org.za
website, and exhibitions and events targeting high-usage electricity consumers. The City also provided
information on the potential financial savings of increased energy efficiency.

The commercial portion of the ESC included the establishment of the Energy Efficiency Forum,
developed in partnership with Eskom and the South African Property Owners’ Association. Meetings
that take place three times per year provide opportunities for the owners and operators of commercial
buildings to network and share their practical experiences of energy efficiency measures. The Forum
also provides frequent updates on opportunities for financing, technological improvement, and training
and support within the energy efficiency field. It also runs a successful awards programme.

Solar Water Heater (SWH) programme
Water heating accounts for the largest share of residential electricity consumption in middle to high
income households. The Solar Water Heater Accreditation and Marketing Campaign was launched
in 2014 to promote the installation of high-pressure residential solar water heaters and improve the
reliability, quality and standards of products and installations.

The SWH campaign thus looks to support the development of a local solar water sector by increasing
consumer confidence in the technology. The campaign involves accrediting service providers and
monitoring their performance, encouraging the uptake of SWHs by households through targeted
communication and education campaigns, providing training to service providers and undertaking
quality control. The Accredited Service Provider programme identifies and verifies companies that
meet the required technical, customer service, knowledge, ethical and business practice standards.

5     SCA LI N G U P RE N E WA B L E S I N C I T I E S : CA P E TOW N
Results to date
The City of Cape Town is moving forward to achieve its 2020 renewable energy targets. More than
274 small-scale embedded generation projects had been approved as of early 2018. The municipality
is also aiming to procure more renewables from independent power producers. Meanwhile, building
retrofits and the installation of solar water heaters have enabled energy savings.
Renewable power capacity and small-scale embedded generation
The solar PV projects installed to date on municipal infrastructure have a peak generation capacity of
247 kW, with more than 2 MW of additional capacity in the planning pipeline. In addition to the offset
costs for electricity consumption, the solar PV installations provide the city with an opportunity to
demonstrate its leadership in developing embedded, distributed energy services.
When Cape Town first developed its SSEG standards, there were no South African standards for the
installation of panels and inverters and no wiring regulations, nor any nationally accredited training
course, which meant that there were few qualified electricians experienced in the use of direct-current
wiring.
In response, Cape Town promulgated requirements for becoming an embedded generator, published
a brochure on the safe and legal installation of rooftop solar PV, and is now reviewing low-voltage
network inspection practices to ensure the safety of municipal staff during operations. The brochure
assists potential end-users in selecting a qualified service provider and details key requirements that
must be met prior to, during and after installation.
By facilitating the uptake and standardisation of embedded generation, Cape Town has been
able to strengthen control over its municipal grid. As of February 2018, 186 grid-tied residential
installations and 88 commercial and industrial installations had been approved, with a total capacity of
13 Mega Volt Amperes (MVA). The government of Western Cape (the province of which Cape Town is
the capital) estimates solar PV capacity in Cape Town at 15 MW. Energy modelling for 2022 – adjusted
from 2020 to be in line with the new municipal Integrated Development Plan – anticipates generation
capacities of 45 MW from residential embedded generation, 8 MW from small commercial generation
and 54 MW from large commercial and industrial embedded generation (City of Cape Town, 2015c).
Cape Town is now reviewing low-voltage network inspection practices
6 SCA LI N G U P RE N E WA B L E S I N C I T I E S : CA P E TOW NProcurement from Independent Power Producers (IPPs)
Cape Town’s renewable energy target is 20% of total energy use by 2020. Achieving this target will
require significant large-scale procurement from IPPs. The city has sought the right to procure electricity
directly from IPPs, but will need to secure a prior determination under Section 34 of the Electricity
Regulation Act from the Minister of Energy and NERSA. This is essential for the IPPs to install new
renewable capacity, generate the renewable-sourced electricity and sell the power to Cape Town. The city
is therefore launching a High Court application seeking three substantive orders to allow the procurement
of renewable-sourced electricity directly from IPPs (City of Cape Town, 2017d).
Municipal building retrofits
The city’s Building Energy Efficiency Retrofit Programme
has to date led to the retrofitting of approximately The city has
26% of Cape Town’s large building stock. Full energy
efficiency retrofits were performed on four buildings, installed smart
while 14 others underwent lighting retrofits.
electricity
The city has also installed smart electricity meters
(AMRs) in about 60 large administrative buildings meters in
and is conducting a behaviour change programme to
provide both building managers and end-users with the about 60 large
knowledge required to effectively manage electricity
consumption. The programme has resulted in cumulative
administrative
energy savings of about 1 068 MWh by 2015, 2.6% of the
energy use for the buildings and facilities of Cape Town
buildings
in 2009 (Western Cape Government, 2013, 2015).
Solar Water Heaters Campaign
The Cape Town Energy 2040 Vision and Action Plan aims to install 525 000 solar water heaters
and heat pumps by 2040, with an interim target of 116 000 by 2020. As of early 2015, more than
46 000 units had been installed (City of Cape Town, 2017g). These represent savings of ZAR 274 million
(USD 20.58 million)5 for end-users, an investment of ZAR 968 million (USD 72.7 million) in the local
economy, 1,319 jobs, 128 gigawatt hours (GWhs) per year in energy savings and 132 000 tonnes of
carbon emissions avoided per year (City of Cape Town, 2017g).
5 Conversion rate is based on the average exchange rate for 2017 (1 ZAR = 0.07511 USD), generated at: www.oanda.com/currency/average
7 SCA LI N G U P RE N E WA B L E S I N C I T I E S : CA P E TOW NCosts and financing
Increasing renewable power capacity and small-scale embedded generation
The installation of the rooftop solar PV panel system and other “green” retrofit activities at the
Wallacedene taxi rank required a capital investment of ZAR 25 million (USD 2.3 million).6 Estimates
indicate that this capital cost will be recovered within six to ten years through energy cost savings
(Transport for Cape Town, 2014).
Small scale-embedded generation in Cape Town is at present driven by private investment decisions.
Moving forward, however, the South African Council for Scientific and Industrial Research (CSIR) has
proposed the creation of a state-owned or fully regulated central purchasing authority which can
purchase the power produced by small-scale embedded generation. This would serve as an incentive
mechanism to support the development of small-scale renewables while compensating municipalities
for losses of revenue from reduced electricity sales. The proposal, referred to as NETFIT, is seen as a
way to create a favourable regulatory environment for small-scale embedded generators.
For residents that invest in solar rooftop PV – and who do not finance their investment over an extended
period – the projected period for amortisation is seven years. This projected period increases up to
between nine and ten years for larger power users (City of Cape Town, 2015c).
Solar water heater campaign
Depending on the size of SWH units (from 150 to 300 litres) and the frequency of use, the initial cost
of a SWH will range from ZAR 15 000 (USD 1 200)7 to ZAR 34 375 (USD 2 700) and the minimum
payback period will range from 3.9 years to 10.6 years, with monthly savings between ZAR 102 (USD 8)
and ZAR 559 (USD 44); (City of Cape Town, 2015d).
Green bonds support Cape Town‘s climate projects
6 Conversion rate is based on the average exchange rate for 2014 (1 ZAR = 0.09222 USD), generated at: www.oanda.com/currency/average
7 Conversion rate is based on the average exchange rate for 2015 (1 ZAR = 0.07882 USD), generated at: www.oanda.com/currency/average
8 SCA LI N G U P RE N E WA B L E S I N C I T I E S : CA P E TOW NSolar panels have appeared across Cape Town in recent years Green bonds The City of Cape Town introduced its first ever green bond of ZAR 1 billion (USD 75.11 million)8 on 12 July 2017 in a closed auction. Over a two-hour period, investors placed bids amounting to ZAR 4.3 billion (USD 323 million). The bond was certified by the Climate Bonds Initiative and its green credentials and controls received an ‘excellent’ rating from Moody’s, an international ratings agency (City of Cape Town, 2017e). The green bonds will be used to support projects that are aligned with the Climate Change Strategy of the City of Cape Town. Some of the projects contribute to achieving Cape Town’s renewable energy targets, energy efficiency measures in buildings, procurement of electric busses and sustainable infrastructure projects (City of Cape Town, 2017f). Lessons for other cities Cape Town’s rooftop solar procurement measures, SWH programme, use of municipal infrastructure and efforts to engage with IPPs highlight how proactive policies at the municipal level can increase electricity service quality and security, as well as advance renewable energy development and deployment. The potential impact on grid stability is a major challenge to small-scale embedded generation, as are improper installation of equipment, illegal grid access and the loss of revenue from electricity sales. At the same time, the limits to Cape Town’s solar rooftop programme appear to be primarily linked to market dynamics in South Africa’s power market. This is a fundamentally different outcome to typical concerns about the viability of such a system beyond the demonstration phase, which usually include the technical challenges of integrating intermittent energy technologies and concerns about the cost competitiveness of such systems with conventional electricity. Moving forward, the city believes that rooftop PV will continue to proliferate and cheap battery storage will be the next big game-changer that enables further penetration of renewables. 8 Conversion rate is based on the average exchange rate for 2017 (1 ZAR = 0.07511 USD), generated at: www.oanda.com/currency/average 9 SCA LI N G U P RE N E WA B L E S I N C I T I E S : CA P E TOW N
References
City of Cape Town (2018), The cost of residential electricity, www.capetown.gov.za/Family%20
and%20home/residential-utility-services/residential-electricity-services/the-cost-of-residential-
electricity, accessed April 2018.
City of Cape Town (2017a), Economic resources and publications,
www.capetown.gov.za/work%20and%20business/doing-business-in-the-city/business-
support-and-guidance/economic-resources-and-publications, accessed September 2017.
City of Cape Town (2017b), Requirements for small-scale embedded generation,
http://resource.capetown.gov.za/documentcentre/Documents/Procedures%2C%20guidelines%20
and%20regulations/Requiremenst%20for%20Samll-Scale%20Embedded%20Generation.pdf.
City of Cape Town (2017c), Annexure 6. Tariffs, fees, and charges book, http://resource.capetown.gov.
za/documentcentre/Documents/Financial%20documents/Budget%202017-2018%20Annexure%20
6%20combined.pdf.
City of Cape Town (2017d), The facts about the City’s electricity tariffs, www.capetown.gov.za/Media-
and-news/The%20facts%20about%20the%20City’s%20electricity%20tariffs, accessed September 2017.
City of Cape Town (2017e), Speech by the City’s Executive Mayor, Patricia de Lille, at the full council
meeting on 27 July 2017, www.capetown.gov.za/Media-and-news/Speech%20by%20the%20
City’s%20Executive%20Mayor,%20Patricia%20de%20Lille,%20at%20the%20full%20council%20
meeting%20on%2027%20July%202017.
City of Cape Town (2017f), Green pays: City’s R1 billion bond a resounding success in the market,
www.capetown.gov.za/media-and-news/Green%20pays%20City, accessed December 2017.
City of Cape Town (2017g), direct communication with research team for this case study,
December 2017.
City of Cape Town (2015a), Cape Town Energy 2040 Vision and Associated Energy and Carbon
Targets, www.esi-africa.com/wp-content/uploads/2016/05/Sarah-Ward.pdf.
City of Cape Town (2015b), Cape Town State of Energy Report 2015, http://samsetproject.net/wp-
content/uploads/2016/02/SEA-Cape-Town-State-of-Energy-Report-2015.pdf.
City of Cape Town (2015c), Challenges and Opportunities for Embedded Generation:
A municipal perspective, presentation, 4 August 2015.
City of Cape Town (2015d), Solar Water Heater FAQs,
http://savingelectricity.org.za/pages/faqs.php, accessed July 2017.
Department of Energy, South Africa (2017), Annual Report 2016/17, www.energy.gov.za/files/
Annual%20Reports/DoE-Annual-Report-2016-17.pdf.
Department of Energy, South Africa (2016), IRP Update Assumptions & Base Case, 22 November
2016, www.energy.gov.za/IRP/irp-presentaions/IRP-Update-Presentation-22-Nov-2016.pdf.
Department of Energy, South Africa (2015), State of Renewable Energy in South Africa, www.gov.za/
sites/www.gov.za/files/State%20of%20Renewable%20Energy%20in%20South%20Africa_s.pdf.
Department of Energy, South Africa (2014), Energy Statistics, www.energy.gov.za/files/energyStats_
frame.html.

10    SCA LI N G U P RE N E WA B L E S I N C I T I E S : CA P E TOW N
Eberhard, A., J. Kolker and J. Leigland (2014), South Africa's Renewable Energy IPP Procurement
Program: Success Factors and Lessons, www.gsb.uct.ac.za/files/ppiafreport.pdf.
Energy Intelligence (2016), REIPPP: All you need to know! www.energyintelligence.co.za/reippp-all-
you-need-to-know/.
GIZ (2017), New Roles for South African Municipalities in Renewable Energy: A Review of Business
Models, Deutsche Gesellschaft für Internationale Zusammenarbeit, www.cityenergy.org.za/uploads/
resource_429.pdf, accessed July 2017.
Global Carbon Atlas (2018), http://globalcarbonatlas.org/en/CO2-emissions, accessed September 2018.
NERSA (2009), Revenue Application Multi-Year Price Determination 2010/11 to 2012/13, National
Energy Regulator of South Africa, www.nersa.org.za/Admin/Document/Editor/file/Electricity/
Applications/Revised%20Eskom%20Revenue%20application%20Multi-Year%20Price%20
Determination%202010-11%20to%202012-13%20(MYPD%202)%20%E2%80%93%2030%20
November%202009.pdf.
Republic of South Africa Government (2017), Energy, www.gov.za/about-sa/energy,
accessed July 2017.
SEA (2017), Sustainable energy solutions for South African local government: a practical guide,
Sustainable Energy Africa, www.cityenergy.org.za/uploads/resource_434.pdf, accessed October 2018.
Statistics South Africa (2015), Mid-year population estimates, http://beta2.statssa.gov.za/
publications/P0302/P03022015.pdf.
Transport for Cape Town (2014), City Unveils South Africa's First 'Green' Taxi Rank. First 'Green' Taxi
Rank, www.tct.gov.za/en/news/general/south-africa-s-first-green-taxi-rank/1/, accessed July 2017.
Western Cape Government (2015), City of Cape Town’s energy efficiency drive,
www.westerncape.gov.za/110green/news/city-cape-towns-energy-efficiency-drive.
Western Cape Government (2013), Cape Town Metro Energy Consumption and CO2e Emissions
Summary Report, www.westerncape.gov.za/eadp/sites/default/files/basic-page/uploads/Energy%20
Consumption%20and%20CO2e%20Emissions%20SUMMARY%20Report%20CAPE%20TOWN%20
METRO.pdf, accessed April 2018.

11    SCA LI N G U P RE N E WA B L E S I N C I T I E S : CA P E TOW N
Copyright © IRENA 2018
Unless otherwise stated, material in this publication may be freely used, shared, copied, reproduced, printed and/or
downloaded, provided that appropriate acknowledgement of IRENA as the source and copyright holder is given. Material
attributed to third parties may be subject to third-party copyright and separate terms of use and restrictions.

Acknowledgements
This case study was prepared in co-ordination with ICLEI, under the guidance of Rabia Ferroukhi (IRENA). Content was
authored by Michael Woodbridge (ICLEI), Brian Jones (City of Cape Town), Laura El-Katiri, Jinlei Feng, Ghislaine Kieffer,
Verena Ommer and Michael Renner (IRENA). The study benefited from expert reviews by Sarah Stands (Skrander)
and Zanie Cilliers (Sustainable Energy Africa NPC) and Wikus Kruger (University of Cape Town). Nicholas Goedeking
(University of California – Berkeley), ICLEI colleagues Miriam Badino, Ana Marques and Pourya Salehi, and City of Cape
Town representatives Hilary Price, Sarah Ward and Leila Mahomed Weideman also provided valuable input.

Disclaimer
This publication and the material herein are provided “as is”. Neither IRENA nor any of its officials, agents, data or other
third-party content providers provides warranty of any kind, either expressed or implied, and they accept no responsibility
or liability with regard to the use of this publication and the material featured therein.
The information contained herein does not necessarily represent the views of the Members of IRENA. The mention of
specific companies or certain projects or products does not imply that they are endorsed or recommended by IRENA
in preference to others of a similar nature that are not mentioned. The designations employed and the presentation of
material herein do not imply the expression of any opinion on the part of IRENA concerning the legal status of any region,
country, territory, city or area or of its authorities, or concerning the delimitation of frontiers or boundaries.
You can also read