Statkraft AS Interim Report - Q3/2019

Page created by Nelson Luna
 
CONTINUE READING
Statkraft AS Interim Report - Q3/2019
Statkraft AS
Interim Report
     Q3/2019

Q3
Statkraft AS Interim Report - Q3/2019
Key figures

                                                                                            Third quarter                                       Year to date                              Year
NOK million                                                                         2019           2018       Change                    2019           2018       Change                  2018

Income statement
Gross operating income underlying                                                 10 082         14 858         -4 776                33 697         38 615         -4 918              55 573
Net operating income underlying                                                     5 942          5 656          286                 20 677         18 817         1 859               26 925
EBITDA underlying                                                                   3 825          3 559          266                 14 736         12 735         2 001               18 520
Operating profit/loss (EBIT) underlying                                             2 899          2 679          219                 11 948         10 069         1 879               14 953
Operating profit/loss (EBIT) IFRS                                                   2 678          2 040          638                 11 740          9 562         2 178               15 446
Share of profit/loss in equity accounted investments                                  -73           352           -425                    698           893           -195                790
Net financial items                                                                  -902           402         -1 303                    -20         6 297         -6 317               4 412
Profit/loss before tax                                                              1 703          2 793        -1 091                12 418         16 752         -4 334              20 649
Net profit/loss                                                                       656          1 265          -609                  7 531        11 818         -4 287              13 390

Key financial metrics
EBIT margin underlying (%)                                                           28.8           18.0          10.7                   35.5          26.1            9.4                26.9
ROACE (%)                                                                                                                                15.8          13.2            2.6                14.7
ROAE (%)                                                                                                                                  4.5          10.1           -5.6                 5.9

Balance sheet and investments
Assets                                                                                                                               172 047        172 938           -891             182 388
Equity                                                                                                                                96 919         93 046         3 873               98 004
Net interest-bearing debt                                                                                                             13 824         15 457         -1 634              12 921
Capital employed                                                                                                                     106 347         99 180         7 167              106 380
Equity accounted investments                                                                                                          12 834         13 182           -348              13 105
Total investments                                                                   2 741          1 573         1 168                  5 126         3 808         1 318                6 981

Cash Flow
From operating activities                                                           8 429          6 182         2 247                12 931         11 608         1 323               15 286
Cash and cash equivalents (incl. restricted cash)                                                                                     18 492         19 046           -554              23 175

Currency rates
NOK/EUR average rate                                                                 9.85           9.58          0.27                   9.77          9.59           0.18               9.60
NOK/EUR closing rate                                                                                                                     9.90          9.47           0.43               9.95

Definitions
See section Alternative Performance Measures at the end of this report for definitions.

The quarterly report shows the development in the quarter compared with the same quarter last year, unless otherwise stated.

Table of Contents
Corporate responsibility and HSE ...................................................................................................................................2
Market and production.....................................................................................................................................................2
Financial performance .....................................................................................................................................................4
Segments ......................................................................................................................................................................10
Outlook ..........................................................................................................................................................................15
Statkraft AS Group Interim Financial Statements..........................................................................................................16
Alternative Performance Measures ...............................................................................................................................35
Statkraft AS Interim Report - Q3/2019
STATKRAFT AS GROUP – THIRD QUARTER AND INTERIM REPORT 2019                                                                    1

                                                SOLID QUARTER DESPITE LOWER
                                                NORDIC POWER PRICES

                                               Solid operations resulted in a strong cash flow.

                                               Several acquisitions strengthened Statkraft’s position as
                                               a leading developer of renewable energy.

 The average Nordic system price in the quarter was             Cash flow from operating activities reached NOK 8429
 34.7 EUR/MWh, a decrease of 31 per cent compared               million in the quarter.
 with the same quarter in 2018. Total generation was
 14.9 TWh in the quarter, an increase of 1.8 TWh. The           Underlying EBIT year-to-date increased with NOK 1879
 increase in generation was primarily related to gas-           million to NOK 11 948 million. Net profit year-to-date is
 fired power, which was at the highest level in a quarter       NOK 7531 million. This is NOK 4287 million lower than
 in almost ten years.                                           the same period last year which included NOK 7125
                                                                million in gains from divestments.
 Statkraft recorded an underlying EBIT amounting to
 NOK 2899 million in the third quarter of 2019. This            Statkraft has entered into a new long-term power
 was an increase of NOK 219 million from the                    contract with Wacker Chemicals Norway for the period
 corresponding quarter last year. The increase was              2021-2027 with a total volume of 600 GWh.
 mainly driven by improved results from Market
 operations.                                                    Statkraft acquired a portfolio of solar projects (326 MW)
                                                                in Ireland and the electric vehicle charging company E-
 Changes in the energy market outlook led to both               WALD in Germany. Acquisitions of wind projects in
 impairments and reversal of previous impairments.              Chile (102 MW) and Brazil (664 MW) have
 The net effect was positive with NOK 133 million.              strengthened Statkraft’s position in these markets. The
                                                                transactions contribute to deliver on Statkraft’s strategic
 A weakening of NOK against EUR led to negative                 growth ambition within renewable energy.
 currency effects amounting to NOK 912 million. These
 effects are mainly unrealised and are more than offset
 by positive effects in comprehensive income
 strengthening the equity. The quarterly net profit
 ended at NOK 656 million. This was a decrease of
 NOK 609 million.

     Operating profit/loss (EBIT) underlying                       Cash flow from operating activities
     NOK million                                                   NOK million
Statkraft AS Interim Report - Q3/2019
STATKRAFT AS GROUP – THIRD QUARTER AND INTERIM REPORT 2019                                                                                                2

 Corporate responsibility and HSE
                                                                                               Third quarter         Year to date                        Year
                                                                                       2019            2018          2019                2018            2018

 Corporate responsibility and HSE
 Fatal accidents1)                                                                        0               0                0                1                  1
 Serious environmental incidents                                                          0               0                0                0                  0
 Absence due to illness, Group (%)                                                       2.4             3.1              2.7             3.4                 3.3
 TRI rate 1) 2)                                                                                                           4.6             5.5                 5.3
 Full-time equivalents, Group                                                                                        3 496           3 141               3 229

1)   Includes employees and suppliers in plants where Statkraft owns 20% or more.
2)   TRI rate (rolling 12 months): Number of injuries per million hours worked.

There were no serious injuries reported in the quarter.

Market and production
Power prices and optimisation of power production constitute the fundamental basis for Statkraft’s revenues. The majority of
Statkraft’s output is generated in the Nordic region. Power prices are influenced by hydrological factors, commodity prices for
thermal power generation, technology cost, grid restrictions and nuclear availability.

POWER PRICES

       Electricity, average monthly system price
       EUR/MWh

Sources: Nord Pool and the European Energy Exchange (EEX).

                                                                                     Third quarter                        Year to date                   Year
                                                                             2019           2018        Change     2019          2018           Change   2018

 Market prices (average)
 System price, Nord Pool (EUR/MWh)                                            34.7             50.5        -15.7   39.1          42.7             -3.7    44.0
 Spot price (base), EEX (EUR/MWh)                                             37.4             53.5        -16.1   38.0          41.7             -3.7    44.4
 Spot price (peak), EEX (EUR/MWh)                                             42.4             59.1        -16.7   43.7          47.4             -3.7    51.4
 Spot price (base), N2EX UK (GBP/MWh)                                         38.5             61.3        -22.8   43.9          55.6            -11.6    57.4

 Sources: Nord Pool and European Energy Exchange (EEX).

The average system price in the Nordic region was 34.7 EUR/MWh in the quarter, a decrease of 31%. The decrease was
mainly due to a stronger hydrological balance in the Nordics and lower Continental prices.

The average base price in the German market (EEX) was 37.4 EUR/MWh in the quarter, a decrease of 30%. The decrease was
mainly due to lower gas and coal prices.

The average base price in the UK was 38.5 GBP/MWh in the quarter, a decrease of 37%. The decrease was mainly driven by
lower gas prices.
Statkraft AS Interim Report - Q3/2019
STATKRAFT AS GROUP – THIRD QUARTER AND INTERIM REPORT 2019                                                                                                            3

CONSUMPTION AND RESOURCE ACCESS IN THE NORDIC REGION

                                                                                                                        Third quarter          Year to date           Year
     Nordic reservoir water levels
     %                                                                           TWh                                     2019        2018       2019       2018       2018

                                                                                 Consumption and output

                                                                                 Nordic
                                                                                 Nordic consumption                       79.2       77.2      280.6       285.7     394.6
                                                                                 Nordic output                            80.8       78.9      282.2       288.1     396.8
                                                                                 Net Nordic import(+)/export(-)           -1.6       -1.7        -1.5       -2.4      -2.1

                                                                                 Norway
                                                                                 Norwegian consumption                    26.1       25.9       95.5        98.1     136.2
                                                                                 Norwegian output                         30.0       30.0       96.7       105.2     146.4
                                                                                 Net Norwegian import(+)/export(-)        -3.9       -4.1        -1.2       -7.1     -10.2
Source: Nord Pool.

The total reservoir level for all producers in the Nordic region was 94% of median level at the end of the quarter, corresponding
to 79.9% of total capacity.

STATKRAFT’S POWER GENERATION
Statkraft’s generation optimisation is determined by price expectations, water reservoir capacity and reservoir water levels,
access to resources (inflow and wind), the margin between power prices and gas in addition to CO2 prices (spark spread) and
grid restrictions.

                                     Third quarter     Year to date     Year                                         Third quarter          Year to date           Year
TWh                                   2019     2018    2019     2018    2018   TWh                                    2019       2018       2019        2018       2018

Generation, technology                                                         Generation, geography
Hydropower                            12.3     12.0     37.9     42.8   57.2   Norway                                 10.5       10.4        31.6       36.2       48.6
Wind power                             0.6       0.6     2.2      1.8    2.7   Sweden                                  1.2        1.0         4.5        4.4        6.0
Gas power                              2.0       0.5     3.1      0.9    1.5   Europe ex. Nordic                       2.2        0.7         4.0        1.9        2.8
Other power 1)                         0.1       0.1     0.2      0.2    0.3   Rest of the world                       1.0        1.0         3.3        3.2        4.3
Total generation                      14.9     13.1     43.3     45.6   61.7   Total generation                       14.9       13.1        43.3       45.6       61.7

1)   Biomass and solar power.

The Group generated a total of 14.9 TWh in the quarter, an increase of 14%. Gas-fired power generation increased significantly,
driven by improved spark spreads. The Group’s district heating deliveries amounted to 0.1 TWh.
Statkraft AS Interim Report - Q3/2019
STATKRAFT AS GROUP – THIRD QUARTER AND INTERIM REPORT 2019                                                                          4

Financial performance
                                                                      Third quarter                      Year to date              Year
NOK million                                                   2019           2018     Change     2019           2018    Change     2018

Net operating income underlying                               5 942          5 656        286   20 677        18 817      1 859   26 925
Operating profit/loss (EBIT) underlying                       2 899          2 679        219   11 948        10 069      1 879   14 953
Operating profit/loss (EBIT) IFRS                             2 678          2 040        638   11 740         9 562      2 178   15 446
Net financial items                                            -902            402     -1 303      -20         6 297     -6 317    4 412
Profit/loss before tax                                        1 703          2 793     -1 091   12 418        16 752     -4 334   20 649
Tax expense                                                  -1 046         -1 528        482   -4 887        -4 934         46   -7 258
Net profit/loss                                                 656          1 265       -609    7 531        11 818     -4 287   13 390

FINANCIAL PERFORMANCE THIRD QUARTER
The underlying EBIT was NOK 2899 million, an increase of 8%. The improvement was primarily related to the segment Market
operations, which had a negative EBIT in the same quarter in 2018. The improvement was related to dynamic asset
management portfolios, origination, market access and trading.

Lower Nordic power prices were partly offset by higher gas-fired power generation in Germany.

Net financial items was negative, primarily due to currency effects.

FINANCIAL PERFORMANCE YEAR TO DATE
The underlying EBIT was 19% higher than in 2018. The increase in net operating income was mainly driven by significantly
higher contribution from the segment Market operations, partly offset by lower revenues from the segment European flexible
generation. Operating expenses were somewhat lower, with the deconsolidation of Fjordkraft from March 2018, changes in the
Norwegian pension scheme and lower property tax in Sweden as the main drivers. This was offset by operating expenses from
acquired assets in Brazil, new wind power assets in Norway and business development.

The decrease in net financial items was mainly due to a gain from divestment of offshore wind assets in the comparable period.

Net profit ended at NOK 7531 million compared with NOK 11 818 million for the same period in 2018.
Statkraft AS Interim Report - Q3/2019
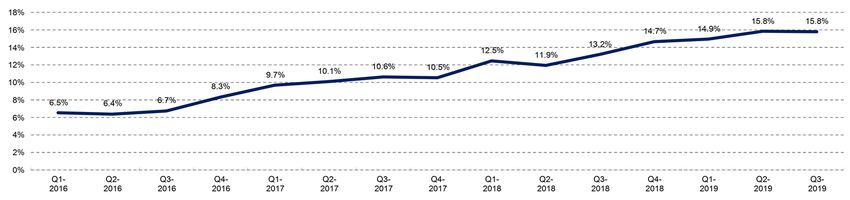
STATKRAFT AS GROUP – THIRD QUARTER AND INTERIM REPORT 2019                                                                                              5

NET OPERATING INCOME UNDERLYING

                                                                                      Third quarter                        Year to date               Year
NOK million                                                                   2019           2018     Change       2019           2018    Change      2018

Net operating income
Generation                                                                    5 994          6 222        -228   18 858         19 371       -513   26 973
Customers                                                                     2 752          8 135      -5 383    9 448         17 397     -7 950   25 220
Grid and other                                                                  712            563         149    2 254          1 635        620    2 482
Sales revenues                                                                9 458        14 920       -5 462   30 560         38 403     -7 843   54 674
Gains/losses from market activities                                             203          -339          542    2 257           -559      2 815     -232
Other operating income                                                          421           277          144      880            770        110    1 131
Gross operating income                                                      10 082         14 858       -4 776   33 697         38 615     -4 918   55 573
Generation                                                                    -831           -307         -524   -1 646           -772       -875   -1 334
Customers                                                                    -2 662         -8 174      5 513     -9 335       -17 098     7 763    -24 556
Other                                                                          -232           -279         47       -656          -625       -31       -917
Energy purchase                                                              -3 724         -8 761      5 036    -11 638       -18 495     6 857    -26 808
Transmission costs                                                             -416           -441         25     -1 383        -1 302       -80     -1 840
Net operating income                                                          5 942          5 656        286    20 677         18 817     1 859    26 925

    Net operating income underlying
    NOK million

In the graph above Generation, Customers and Grid and other are shown as sales revenues less energy purchase.

   Net operating income from Generation decreased, mainly driven by lower Nordic power prices. This was partly offset by
    improved contribution from gas-fired power plants driven by positive gas to power margin leading to higher generation.
   Net operating income from Grid and other increased, mainly due to positive effects from downstream market services in the
    UK.
   Gains/losses from market activities increased, mainly driven by improved contribution from dynamic asset management
    portfolios and origination activities.
   Other operating income increased, mainly due to an insurance settlement related to the Kargi hydropower plant in Turkey.

OPERATING EXPENSES UNDERLYING

                                                                                      Third quarter                        Year to date               Year
NOK million                                                                   2019           2018     Change       2019           2018    Change      2018

Operating expenses
Salaries and payroll costs                                                     -912           -905          -7    -2 652         -2 564       -88    -3 615
Depreciations and amortisations                                                -927           -880         -47    -2 789         -2 666      -123    -3 567
Property tax and licence fees                                                  -309           -308          -1      -884           -957        73    -1 352
Other operating expenses                                                       -896           -884         -11    -2 404         -2 561       157    -3 439
Operating expenses                                                           -3 043         -2 977         -66    -8 729         -8 748       19    -11 972

      The increase in salaries and payroll costs was mainly due to increased number of FTEs related to business development
       and acquisition of new entities. This was offset by pension scheme changes in Norway.
      The increase in depreciations and amortisations was mainly due to the implementation of IFRS 16 from 2019 and new
       assets. See note 5 for further information regarding IFRS 16.
      Property tax and licence fees were on par.
      Other operating expenses were slightly higher mainly due to increased costs from new companies acquired, offset by
       positive effects from IFRS 16.
Statkraft AS Interim Report - Q3/2019
STATKRAFT AS GROUP – THIRD QUARTER AND INTERIM REPORT 2019                                                                       6

ITEMS EXCLUDED FROM THE UNDERLYING OPERATING PROFIT/LOSS
The segment reporting is based on underlying figures, which is in accordance with how the corporate management makes,
follows up and evaluates its decisions. Unrealised value changes from embedded derivatives, gains/losses from divestments of
business activities and impairments are excluded from the underlying profit/loss from 2019. See page 21.

                                                                     Third quarter                     Year to date              Year
NOK million                                                  2019            2018    Change    2019           2018    Change     2018

Items excluded from the underlying operating profit/loss
Unrealised value changes from energy derivatives              -354           -518        164    -327         -1 797     1 470    -789
   Embedded derivatives                                       -354            -77       -277    -327           -848       522    -333
   Derivatives entered into for risk reduction purposes          -           -440        440       -           -948       948    -456
Gains/losses from divestments of business activities             -             17        -17       -          1 449    -1 449   1 449
Impairments                                                    133           -139        272     119           -160       278    -167
Items excluded from the underlying operating profit/loss      -221           -640        419    -208           -507       299     493

    Embedded derivatives linked to long-term industry contracts had a negative effect. This was driven by changes in certain
     commodity prices, partly offset by a weakening of NOK against EUR.
    Impairments had a positive net effect, see note 11 for more details.

FINANCIAL ITEMS

                                                                     Third quarter                     Year to date             Year
NOK million                                                  2019           2018     Change    2019           2018    Change    2018

Financial items
Interest income                                               105             105          1    348            291         57     404
Interest expenses                                            -145            -199         54   -523           -665        142    -905
Net currency effects                                         -912             214     -1 126    -23          1 289     -1 313    -464
Other financial items                                          51             282       -231    179          5 382     -5 203   5 377
Net financial items                                          -902            402      -1 303    -20          6 297     -6 317   4 412

      Interest expenses decreased, mainly due to lower average interest rates and a reduction of interest-bearing debt. This was
       partly offset by effects from IFRS 16.
      Net currency losses in the quarter were primarily related to a weakening of NOK against EUR and USD.
      Other financial items decreased, mainly due to gains from divestments of shares in equity accounted investments in
       comparable period.
Statkraft AS Interim Report - Q3/2019
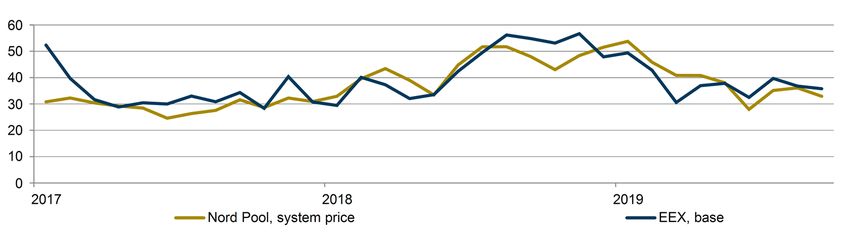
STATKRAFT AS GROUP – THIRD QUARTER AND INTERIM REPORT 2019                                                                          7

TAX EXPENSE

                                                                      Third quarter                      Year to date              Year
NOK million                                                   2019           2018     Change     2019           2018    Change     2018

Tax expense
Profit/loss before tax                                        1 703          2 793     -1 091   12 418        16 752     -4 334   20 649
Nominal tax rate in Norway                                     22%            23%         -1%     22%           23%         -1%     23%

Tax calculated at nominal Norwegian tax rate                   375            642       -268     2 732         3 853     -1 121    4 749
Tax on share of profit/loss in equity accounted investments     16            -81         97      -154          -205         52     -182
Resource rent tax payable                                      718            835       -116     2 406         2 649       -243    3 678
Resource rent tax deferred                                     -61            -23        -38       169            -4        173      444
Other differences from the nominal Norwegian tax rate            -2           155       -156      -266        -1 358     1 092    -1 431
Tax expense                                                   1 046          1 528      -482     4 887         4 934       -46     7 258
Effective tax rate                                             61%            55%        7%       39%           29%       10%       35%

Tax expense third quarter
    Resource rent tax payable decreased, mainly due to lower Nordic power prices. This was partly offset by a higher tax rate
      from 1 January 2019.
    Resource rent tax deferred decreased, mainly due to unrealised value changes from embedded derivatives.

Tax expense year to date
    Resource rent tax payable decreased, mainly due to lower generation. This was partly offset by a higher tax rate from 1
      January 2019.
    Resource rent tax deferred increased, mainly due to unrealised value changes from embedded derivatives.
    Negative other differences from the nominal Norwegian tax rate of NOK 266 million were mainly due to changes in
      unrecognised deferred tax assets in Germany.
    Negative other differences from the nominal Norwegian tax rate in the comparable period of NOK 1358 million were mainly
      due to:
            o A tax exempt gain related to the divestment of the shareholding in the Dudgeon offshore wind farm.
            o A tax exempt gain related to the listing and subsequent deconsolidation of Fjordkraft.
Statkraft AS Interim Report - Q3/2019
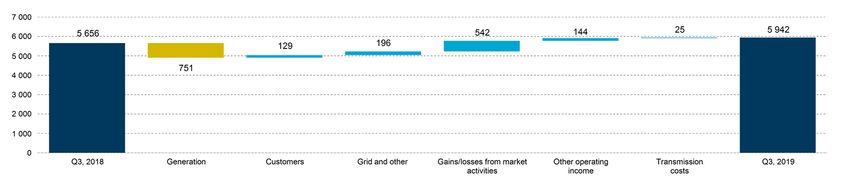
STATKRAFT AS GROUP – THIRD QUARTER AND INTERIM REPORT 2019                                                                                                  8

RETURN ON AVERAGE CAPITAL EMPLOYED (ROACE)

    ROACE (rolling 12 months)

The improvement in ROACE compared with year-end 2018 was mainly due to higher underlying operating profit (rolling 12
months), primarily driven by higher contribution from the segment Market operations. Average capital employed was 5% higher
compared with year-end 2018, mainly driven by acquired assets in Brazil and wind power investments in Norway.

CASH FLOW

                                                                              Third quarter                              Year to date                      Year
NOK million                                                           2019           2018     Change             2019           2018    Change             2018

Cash flow
Operating activities                                                  8 429          6 182      2 247           12 931        11 608        1 323         15 286
Investing activities                                                 -2 170           -869     -1 301           -3 826         4 635       -8 462          5 301
Financing activities                                                   -854         -6 045      5 191          -13 740       -11 162       -2 578        -11 689
Net change in cash and cash equivalents                              5 404            -732      6 137           -4 636         5 081       -9 716         8 899

Cash and cash equivalents (incl. restricted cash) at period end     18 492         19 046        -554          18 492         19 046        -554         23 175

Cash flow third quarter
 The operating activities were mainly impacted by a positive operating profit and working capital changes, mainly due to sale of
   environmental certificates.
 The investing activities were mainly related to investments in property, plant and equipment.
 The financing activities were mainly related to repayment of interest-bearing debt.

Cash flow year-to-date
 The operating activities were mainly impacted by a positive operating profit and working capital changes, partly offset by taxes
   paid.
 The investing activities were mainly related to investments in property, plant and equipment, partly offset by cash inflow from
   the divestment of Fjordkraft.
 The financing activities were mainly related to dividend paid to Statkraft SF and repayment of interest-bearing debt.

INTEREST-BEARING DEBT REPAYMENT PLAN
  Long-term debt redemption profile
  NOK million

 9 000
 8 000
 7 000
 6 000
 5 000
 4 000
 3 000
 2 000
 1 000
     -
                2019         2020          2021          2022     2023           2024         2025      2026        2027            2028        >2029
                                                                                                                                                  Year
                           Loans in subsidiaries                   Loans in Statkraft AS                   Loan from Statkraft SF

At the end of the quarter, Statkraft had the following financial structure:
 Net interest-bearing debt totalled NOK 13 824 million.
 Net interest-bearing debt-equity ratio was 12.5%.
STATKRAFT AS GROUP – THIRD QUARTER AND INTERIM REPORT 2019                                                                                          9

INVESTMENTS AND PROJECTS
Total investments in the quarter amounted to NOK 2741 million. Maintenance investments and other investments were primarily
related to Nordic hydropower. Investments in new capacity were mainly related to construction of hydropower plants in Albania
and India and the Fosen project in Norway.

                                                                                       Third quarter                Year to date               The year
NOK million                                                                                    2019                        2019                    2018

Maintenance investments and other investments
European flexible generation                                                                    458                       1 077                    1 185
Market operations                                                                                13                          62                       10
International power                                                                             114                         261                      155
European wind and solar                                                                          71                          93                        4
District heating                                                                                  5                           8                        9
Industrial ownership                                                                            145                         417                      663
Other activities                                                                                 11                          36                       40
Total                                                                                           818                       1 953                    2 067

Investments in new capacity
European flexible generation                                                                     53                         132                       67
Market operations                                                                                 1                           3                       24
International power                                                                             177                         445                      894
European wind and solar                                                                       1 322                       1 842                    1 623
District heating                                                                                 36                         112                      134
Industrial ownership                                                                             84                         240                      309
Total                                                                                         1 673                       2 775                    3 053

Investments in shareholdings
Market operations                                                                                 1                           4                       39
International power                                                                              22                          22                    1 345
European wind and solar                                                                          85                          85                      381
Industrial ownership                                                                             53                          53                        -
Other activities                                                                                 89                         234                       97
Total                                                                                           250                         398                    1 862

Total investments                                                                             2 741                       5 126                    6 981

Projects in consolidated operations

                                                                                                                              Statkraft's      Planned
Third quarter                                    Project                     Country         New capacity (MW) 1)       ownership share      completion

Main construction projects
Hydropower                                       Devoll - Moglice            Albania                         184                   100%     2020    Q1
                                                 Songa and Trolldalen Dams   Norway                            -                   100%     2020    Q4
                                                 Tidong                      India                           150                   100%     2021    Q2
                                                 Los Lagos                   Chile                            52                   100%     2022    Q2
Wind power                                       Fosen - Hitra II            Norway                           94                    52%     2019    Q4
                                                 Fosen - Storheia            Norway                          288                    52%     2019    Q4
                                                 Fosen - Geitfjellet         Norway                          155                    52%     2020    Q3
                                                 Fosen - Harbaksfjellet      Norway                          108                    52%     2020    Q3
                                                 Fosen - Kvenndalsfjellet    Norway                          101                    52%     2020    Q3
1) Total   for project, incl. partners' share.
STATKRAFT AS GROUP – THIRD QUARTER AND INTERIM REPORT 2019                                                                                                             10

Segments
The Group’s operating segments are in accordance with how the corporate management makes, follows up and evaluates its
decisions. The operating segments have been identified on the basis of internal management information that is periodically
reviewed by the corporate management and used as a basis for resource allocation and key performance review.

In 2019 the segment Wind power has changed name to European wind and solar.

The reportable segments are defined as:

European flexible generation includes ownership and operations of the majority of the Group’s hydropower business in
Norway, Sweden, Germany and the United Kingdom, as well as the gas-fired power plants in Germany, the subsea cable Baltic
Cable and the biomass power plants in Germany.

Market operations includes all trading, origination, market access for smaller producers of renewable energy, as well as
revenue optimisation and risk mitigation activities related to Continental and Nordic power generation.

International power includes development, ownership and operations of renewable assets in emerging markets. The segment
operates in Brazil, Peru, Chile, India, Nepal, Turkey and Albania.

European wind and solar includes development, ownership and operations of onshore wind power and solar power. The
segment operates in Norway, Sweden, Ireland and the United Kingdom.

District heating includes development, ownership and operations of district heating plants in Norway and Sweden.

Industrial ownership includes management and development of Norwegian shareholdings within the Group’s core business
and includes the shareholdings in Skagerak Energi, BKK and Agder Energi. See also note 14.

In addition:

Other activities include other small-scale business, group functions and unallocated assets.

Group items include eliminations.
                                                                                                      International
                                                             Statkraft AS

                                                                            generation

                                                                                         operations

                                                                                                                                             ownership
                                                                            European

                                                                                                                      European

                                                                                                                                             Industrial
                                                                                                                      and solar

                                                                                                                                                          activities
                                                                                                                                  heating
                                                                            flexible

                                                                                                                                  District
                                                                                         Market
                                                             Group

                                                                                                                                                                            Group
                                                                                                      power

                                                                                                                                                          Other

                                                                                                                                                                            items
                                                                                                                      wind

Third quarter

Income statement
Gross operating income underlying                       10 082                5 051      3 452           929              278       106        559          336             -629
Net operating income underlying                          5 942                3 894        390           798              264         74       520          336             -334
EBITDA underlying                                        3 825                2 924           59         533                68          9      321           -61             -28
Operating profit/loss (EBIT) underlying                  2 899                2 509           53         315               -17      -33        200           -99             -29
Operating profit/loss (EBIT) IFRS                        2 678                3 189           53       -201              -402       -34        200           -99             -28

Key financial metrics
EBIT-margin (%) underlying                                   28.8              49.7        1.5        33.9               -6.0     -31.4      35.7            n/a             n/a
ROACE (%)                                                    15.8              21.6      38.4            3.4              5.3       5.8      10.7            n/a             n/a
ROAE (%)1)                                                       4.5             n/a        n/a          -2.6              2.5       n/a        6.8          n/a             n/a

Investments
Total investments                                        2 741                   511          16         314            1 478         41       282          100                 -

Generation
Generation, volume sold (TWh)                                 14.9              12.4             -         1.1             0.5          -       1.0               -             -
- hydropower (TWh)                                            12.3              10.3             -         0.9                -         -       1.0               -             -
- wind power (TWh)                                               0.6                 -           -         0.1             0.5          -            -            -             -
- gas power (TWh)                                                2.0             2.0             -               -            -         -            -            -             -
- other power (TWh)2)                                            0.1             0.1             -         0.0                -         -            -            -             -
Production, district heating (TWh)                               0.1                 -           -               -            -      0.1        0.0               -             -
1)   Return on average equity accounted investments.
2)   Biomass and solar power.
STATKRAFT AS GROUP – THIRD QUARTER AND INTERIM REPORT 2019                                                                                                               11

EUROPEAN FLEXIBLE GENERATION                                                             MARKET OPERATIONS

                                           Third quarter       Year to date      Year                                               Third quarter         Year to date        Year
NOK million                               2019     2018        2019      2018    2018    NOK million                               2019     2018        2019     2018         2018

Gross operating income                   5 051        5 192   15 328   15 628   21 602   Gross operating income                   3 452        8 221   12 891   16 946   25 957
Net operating income                     3 894        4 428   12 749   13 819   18 765   Net operating income                       390         -354    2 244     -136      834
EBITDA, underlying                       2 924        3 363    9 953   10 815   14 635   EBITDA, underlying                          59         -666    1 425     -929     -303
Operating profit/loss (EBIT)                                                             Operating profit/loss (EBIT)
underlying                               2 509        2 939    8 699    9 540   12 943   underlying                                  53         -671    1 405     -943        -321
Unrealised value changes from                                                            Unrealised value changes from
energy derivatives                        -354          -77     -327     -848     -333   energy derivatives                            -        -440        -     -948        -456
Gains/losses from divestments                                                            Gains/losses from divestments
of business activities                       -            -        -        -        -   of business activities                       -        17           -       17          15
Impairments                              1 035            -    1 035        -        -   Impairments                                  -         -           -        -           -
Operating profit/loss (EBIT) IFRS        3 189        2 861    9 407    8 691   12 610   Operating profit/loss (EBIT) IFRS           53    -1 094       1 406   -1 875        -761
Share of profit/loss in equity                                                           Share of profit/loss in equity
accounted investments                        1            -       1         -        -   accounted investments                        4           1        5        1            2
Gains/losses from divestments of                                                         Gains/losses from divestments of
equity accounted investments*)                -           -        -        -        -   equity accounted investments*)                -           -        -        -           -

ROACE (rolling 12 months)                                       21.6     21.4     23.3   ROACE (rolling 12 months)                                       38.4    -13.9        -6.9
ROAE (rolling 12 months)**)                                      n/a      n/a      n/a   ROAE (rolling 12 months)**)                                      n/a      n/a         n/a

Maintenance investments and                                                              Maintenance investments and
other investments                          458         344     1 077     827     1 185   other investments                           13           3       62        8           10
Investments in new capacity                 53          32       132      46        67   Investments in new capacity                  1           4        3       13           24
Investments in shareholdings                 -           -         -       -         -   Investments in shareholdings                 1           6        4       15           39

Generation (TWh)                          12.4         10.6     34.4     36.3     48.9   Generation (TWh)                              -           -        -        -           -
*) Included in Other financial items.                                                    *) Included in Other financial items.

**) Return on average equity accounted investments.                                      **) Return on average equity accounted investments.

Key events                                                                               Key events
  Statkraft has entered into a new long-term power                                        Statkraft has entered into a 5-year power purchase
    contract with Wacker Chemicals Norway for the period                                     agreement (PPA) with aventron for purchase of a total
    2021-2027 with a total volume of 0.6 TWh.                                                of 330 GWh from a solar park in Spain.
  Reversal of previous impairments of NOK 1035 million                                    Statkraft entered into a 12-year PPA with BayWa.
    for German gas-fired power plants, see note 11.                                          Statkraft will purchase approximately 100 GWh p.a.
                                                                                             from a solar park in Spain.
Quarterly financial performance
  The decrase in underlying EBIT was mainly driven by                                   Quarterly financial performance
    lower Nordic power prices. This was partly offset by                                   The increase in underlying EBIT was mainly driven by
    improved contribution from gas-fired power plants driven                                 an improved contribution from dynamic asset
    by positive gas to power margin and higher generation.                                   management portfolios and origination activities.
  Operating expenses were lower due to changes in the
    Norwegian pension scheme and lower property tax in                                   Year-to-date financial performance
    Sweden driven by a lower tax rate.                                                     The increase in underlying EBIT was mainly driven by
                                                                                              an improved contribution from trading activities and a
Year-to-date financial performance                                                            positive result from Nordic origination.
  Underlying EBIT decreased mainly driven by lower
     Nordic hydropower generation and lower Nordic power                                 Financial metrics
     prices.                                                                                ROACE was 38.4% mainly due to a high underlying
  Operating expenses were lower due to the same factors                                      EBIT in 2019.
     as for the third quarter.

Financial metrics
   ROACE was 21.6%, down from last quarter due to a
     lower underlying EBIT.

Quarterly investments
  The investments were mainly related to maintenance
    within Nordic hydropower.
STATKRAFT AS GROUP – THIRD QUARTER AND INTERIM REPORT 2019                                                                                                         12

INTERNATIONAL POWER                                                                   EUROPEAN WIND AND SOLAR

                                           Third quarter     Year to date     Year                                               Third quarter    Year to date          Year
NOK million                               2019     2018      2019      2018   2018    NOK million                               2019     2018     2019      2018        2018

Gross operating income                     929        674    2 462    2 011   2 641   Gross operating income                     278        322   1 030     852     1 367
Net operating income                       798        549    2 085    1 688   2 244   Net operating income                       264        310     989     819     1 320
EBITDA, underlying                         533        373    1 363    1 092   1 382   EBITDA, underlying                          68        166     484     455       738
Operating profit/loss (EBIT)                                                          Operating profit/loss (EBIT)
underlying                                 315        190     721      535     631    underlying                                 -17         99    233      229          429
Unrealised value changes from                                                         Unrealised value changes from
energy derivatives                            -          -       -        -       -   energy derivatives                            -         -       -        -           -
Gains/losses from divestments                                                         Gains/losses from divestments
of business activities                       -           -       -        -       -   of business activities                       -          -       -       -            1
Impairments                               -516        -138    -529     -154    -160   Impairments                               -385          -    -385       -            -
Operating profit/loss (EBIT) IFRS         -201          52     192      381     471   Operating profit/loss (EBIT) IFRS         -402         99    -152     229          431
Share of profit/loss in equity                                                        Share of profit/loss in equity
accounted investments                      -90         70      -70     137     143    accounted investments                      -10         -4      -7       2           30
Gains/losses from divestments of                                                      Gains/losses from divestments of
equity accounted investments*)                -          -       -        -       -   equity accounted investments*)                -         -       -    5 106    5 106

ROACE (rolling 12 months)                                      3.4      2.9     2.9   ROACE (rolling 12 months)                                     5.3      3.9         6.3
ROAE (rolling 12 months)**)                                   -2.6     18.9     7.8   ROAE (rolling 12 months)**)                                   2.5     13.5         3.2

Maintenance investments and                                                           Maintenance investments and
other investments                          114         62     261      119      155   other investments                           71          1      93        1        4
Investments in new capacity                177        252     445      612      894   Investments in new capacity              1 322        596   1 842    1 300    1 623
Investments in shareholdings                22          1      22        1    1 345   Investments in shareholdings                85          9      85        9      381

Generation (TWh)                           1.1         1.1     3.7      3.7     4.9   Generation (TWh)                           0.5        0.5     1.8      1.4         2.2
*) Included in Other financial items.                                                 *) Included in Other financial items.

**) Return on average equity accounted investments.                                   **) Return on average equity accounted investments.

Key Events                                                                            Key events
  Statkraft has acquired a portfolio of wind projects in Chile                         Statkraft has acquired the shares of Airvolution Clean
    (102 MW), see note 14.                                                                Energy Limited, see note 14.
  In October, Statkraft acquired a portfolio of wind projects                          Swedish wind assets were impaired by NOK 385
    in Brazil (664 MW) and has successfully participated in                               million, see note 11.
    an auction, see note 16.                                                            On 4 October, Statkraft acquired a portfolio of solar
  Assets in Chile and Nepal were impaired, see note 11.                                  projects, see note 16.

                                                                                      Quarterly financial performance
Quarterly financial performance                                                         The decrease in underlying EBIT was mainly driven by
  The underlying EBIT increased mainly due to an                                         lower power and el-cert prices and increased business
    insurance settlement related to a tunnel collapse in Kargi                            development costs. This was partly offset by other
    and new capacity in Brazil.                                                           operating income related to the sale of a wind project in
  The decrease in share of profit/loss in equity accounted                               Sweden.
    investments was mainly due to an impairment in India.
                                                                                      Year-to-date financial performance
Year-to-date financial performance                                                      Underlying EBIT was stable. New capacity in Norway
  The increase in underlying EBIT was mainly due to the                                   and the sale of a wind project in Sweden were offset by
     same factors as for the third quarter.                                                lower power and el-cert prices and higher business
                                                                                           development costs.
  The decrease in share of profit/loss in equity accounted
     investments was mainly due negative effects in India and
                                                                                      Financial metrics
     Chile.
                                                                                         The ROACE was 5.3%, a decrease compared with
Financial metrics                                                                          previous quarter mainly due to a lower underlying EBIT.
   The ROACE was 3.4%, on par with the last quarter. The                                The ROAE was 2.5%, a decrease from previous quarter
     capital employed is high, mainly due to newly built and                               due to lower power prices. The ROAE was also lower
     acquired assets leading to high carrying values.                                      than in the comparable period, as last year’s figure
                                                                                           included divested offshore wind assets.
   The ROAE decreased compared with the last quarter,
     mainly due to negative effects in India and Chile and
                                                                                      Quarterly investments
     reclassification of shareholder loans to equity accounted
     investments. See note 7.                                                           The investments in new capacity were mainly related to
                                                                                          the Fosen project in Norway.
Quarterly investments                                                                   Investments in shareholdings were related to the
  The investments were mainly related to the construction                                acquisition of Airvolution, see note 14.
    of the Moglice hydropower plant in Albania and the
    Tidong hydropower plant in India.
STATKRAFT AS GROUP – THIRD QUARTER AND INTERIM REPORT 2019                                                                                                         13

DISTRICT HEATING                                                                    INDUSTRIAL OWNERSHIP

                                           Third quarter    Year to date     Year                                                Third quarter    Year to date          Year
NOK million                               2019     2018     2019      2018   2018   NOK million                                 2019     2018     2019      2018        2018

Gross operating income                     106        114    606      612     908   Gross operating income                        559       740   2 383    3 576    4 631
Net operating income                        74         82    423      440     650   Net operating income                          520       683   2 224    2 333    3 284
EBITDA, underlying                           9         12    238      239     371   EBITDA, underlying                            321       447   1 509    1 407    2 041
Operating profit/loss (EBIT)                                                        Operating profit/loss (EBIT)
underlying                                 -33        -29    110      115     206   underlying                                    200       301   1 129     980     1 467
Unrealised value changes from                                                       Unrealised value changes from
energy derivatives                            -         -       -        -      -   energy derivatives                              -         -       -        -           -
Gains/losses from divestments                                                       Gains/losses from divestments
of business activities                       -          -      -        -       -   of business activities                          -         -       -    1 432    1 432
Impairments                                 -1         -1     -3       -6      -7   Impairments                                     -         -       -        -        -
Operating profit/loss (EBIT) IFRS          -34        -30    107      109     199   Operating profit/loss (EBIT) IFRS             200       301   1 129    2 412    2 899
Share of profit/loss in equity                                                      Share of profit/loss in equity
accounted investments                         -         -       -        -      -   accounted investments                          31       280    796      763          635
Gains/losses from divestments of                                                    Gains/losses from divestments of
equity accounted investments*)                -         -       -        -      -   equity accounted investments*)                  -       271    186      343          343

ROACE (rolling 12 months)                                     5.8      5.5    5.9   ROACE (rolling 12 months)                                      10.7      9.8        10.1
ROAE (rolling 12 months)**)                                   n/a      n/a    n/a   ROAE (rolling 12 months)**)                                     6.8      8.5         6.1

Maintenance investments and                                                         Maintenance investments and
other investments                            5          3      8        8       9   other investments                             145       182    417      497          663
Investments in new capacity                 36         37    112       79     134   Investments in new capacity                    84        18    240      166          309
Investments in shareholdings                 -          -      -        -       -   Investments in shareholdings                   53         -     53        -            -

Delivered volume (TWh)                     0.1        0.1     0.6      0.7    1.0   Generation (TWh)                              1.0       1.0     3.4      4.2         5.7
*) Included in Other financial items.                                               *)    Included in Other financial items.

**) Return on average equity accounted investments.                                 **)   Return on average equity accounted investments.

Quarterly financial performance                                                     Key events
  The underlying EBIT decreased as a result of lower                                 The subsidiary Skagerak Energi has acquired the
    district heating prices due to lower power prices.The                               shares in Hjartdal Elverk for NOK 53 million, see note
    comparable period included revenues from sale of CO2-                               14.
    allowances.                                                                       On 9 October, BKK purchased 6517 of its own C-
  The decrease was partly offset by lower operating                                    shares from Statkraft, see note 16.
    expenses due to changes in the Norwegian pension
    scheme.                                                                         Quarterly financial performance
                                                                                      Underlying EBIT decreased, mainly due to lower power
Year-to-date financial performance                                                      prices.
  The underlying EBIT decreased due to higher energy                                 The decrease in share of profit/loss in equity accounted
     purchase costs, mainly due to increased fuel prices and                            investments was mainly due to lower power prices and
     sale of CO2-allowances in the comparable period.                                   decreased generation in BKK. Similar effects, as well
  The decrease was partly offset by lower operating                                    as lower positive effects from energy derivatives, led to
     expenses.                                                                          a lower contribution from Agder Energi.

Financial metrics                                                                   Year-to-date financial performance
   The ROACE was stable at 5.8 %. The return was mainly                              Underlying EBIT increased, driven by an expired
     driven by results from district heating activities in                               hedging contract with negative contribution in the
     Trondheim, which accounts for more than 50% of the                                  comparable period and pension scheme changes in
     capital employed.                                                                   Norway. This was partly offset by effects from the
                                                                                         deconsolidation of Fjordkraft in March 2018.
Quarterly investments
                                                                                    Financial metrics
  The investments were primarily related to pipelines in
    Norway.                                                                            The ROACE was 10.7%, a decrease from previous
                                                                                         period, driven by lower underlying EBIT.
                                                                                       The ROAE was 6.8%, a decrease from previous
                                                                                         period, mainly due to lower contribution from Agder
                                                                                         Energi and BKK.

                                                                                    Quarterly investments
                                                                                           The investments were primarily related to various
                                                                                                maintenance and new capacity investments within grid
                                                                                                activities and investments in shareholdings, following
                                                                                                the acquisition of Hjartdal Elverk, see note 14.
STATKRAFT AS GROUP – THIRD QUARTER AND INTERIM REPORT 2019                        14

OTHER ACTIVITIES

                                         Third quarter   Year to date     Year
NOK million                             2019     2018    2019      2018   2018

Gross operating income                   336      235      867      739   1 011
Net operating income                     336      235      867      739   1 011
EBITDA, underlying                       -61     -130     -282     -304    -485
Operating profit/loss (EBIT)
underlying                               -99     -144     -398     -347    -545
Unrealised value changes from
energy derivatives                         -         -       -        -       -
Gains/losses from divestments
of business activities                     -        -        -        -       -
Impairments                                -        -        -        -       -
Operating profit/loss (EBIT) IFRS        -99     -144     -398     -347    -545
Share of profit/loss in equity
accounted investments                     -8        5      -26      -11     -20
Gains/losses from divestments of
equity accounted investments*)             -         -       -        -       -

Maintenance investments and
other investments                         11       22      36       29      40
Investments in new capacity                -        -       -        -       -
Investments in shareholdings              89        1     234       77      97

Generation (TWh)                           -         -       -        -       -
*) Included in Other financial items.

Key events
  Statkraft has acquired the shares in the EV charging
    company E-WALD GmbH, see note 14.
  Statkraft has sold a data centre project located in
    Norway.

Quarterly financial performance
  The increase in underlying EBIT was primarily from the
    sale of a data centre project.

Year-to-date financial performance
  The decrease in underlying EBIT was primarily due to
     higher IT costs and higher cost related to new
     business, partly offset by a sale of a data centre
     project.

Quarterly investments
  Investments in shareholdings were mainly related to the
    acquisition of E-WALD GmbH, and investments made by
    Statkraft Ventures GmbH.
STATKRAFT AS GROUP – THIRD QUARTER AND INTERIM REPORT 2019                                                                        15

Outlook
The power surplus in the Nordics is expected to increase in the next years. Demand growth from the transport sector, industry
and data centres will be more than offset by an even larger growth in wind power.

Statkraft has Europe’s largest portfolio of flexible hydropower plants and reservoir capacity. The operations of the assets are
continuously optimised according to the hydrological situation and expected power prices. Statkraft also has a large share of
long-term power contracts within the segments European flexible generation and International power. The contracts have a
stabilising effect on revenues and net profit. Statkraft aims to maintain its position as a competitive supplier to the industry in
Norway by entering into new long-term industry contracts.

Strong underlying operations and successful divestments over the last years, have provided Statkraft with a solid financial
foundation to deliver on the growth strategy.

Statkraft’s ambition is to maintain the position as the largest generator of renewable energy in Europe and grow significantly in
South America and India. The target is to optimise and further grow the hydropower portfolio and to develop 8000 MW of
onshore wind and solar power by 2025. Furthermore, Statkraft aims to increase the market activities, grow the district heating
business and develop new businesses with international potential. To achieve these growth targets, Statkraft plans annual
investments of around NOK 10 billion in renewable energy towards 2025. The investments will be financed through retained
earnings from existing operations, external financing and divestments to other investors. The investment programme has a large
degree of flexibility and will be adapted to market opportunities, the company's financial capacity and commitment to the existing
rating target.

Statkraft’s commitment to act in a safe, ethical and socially responsible manner will continue to be a foundation for all activities.

                                                       Oslo, 23 October 2019
                                                 The Board of Directors of Statkraft AS
STATKRAFT AS GROUP – THIRD QUARTER AND INTERIM REPORT 2019                                                                               16

Statkraft AS Group Interim Financial Statements

                                                                                   Third quarter             Year to date             The year
NOK million                                                                         2019            2018      2019            2018       2018

COMPREHENSIVE INCOME

PROFIT AND LOSS
Sales revenues                                                                     9 483           15 398   30 574          39 096      55 350
Gains/losses from market activities                                                 -176           -1 334    1 916          -3 048      -1 696
Other operating income                                                               421              293      880           2 219       2 580
Gross operating income                                                              9 728          14 357    33 370          38 267     56 233
Energy purchase                                                                    -3 724          -8 761   -11 638         -18 495    -26 808
Transmission costs                                                                   -416            -441    -1 383          -1 302     -1 840
Net operating income                                                               5 587            5 155   20 350          18 470      27 585
Salaries and payroll costs                                                          -912             -905   -2 652          -2 564      -3 615
Depreciations and amortisations                                                     -927             -880    -2 789          -2 666     -3 567
Impairments                                                                          133             -139      119            -160        -167
Property tax and licence fees                                                       -309             -308     -884            -957      -1 352
Other operating expenses                                                            -896             -884    -2 404          -2 561     -3 439
Operating expenses                                                                 -2 910          -3 116   -8 610           -8 908    -12 139
Operating profit/loss (EBIT)                                                        2 678           2 040   11 740            9 562     15 446
Share of profit/loss in equity accounted investments                                  -73             352      698              893        790
Interest income                                                                       105             105      348              291        404
Interest expenses                                                                    -145            -199     -523             -665       -905
Net currency effects                                                                 -912             214      -23            1 289       -464
Other financial items                                                                  51             282      179            5 382      5 377
Net financial items                                                                 -902             402        -20          6 297       4 412
Profit/loss before tax                                                             1 703            2 793   12 418          16 752      20 649
Tax expense                                                                        -1 046          -1 528    -4 887          -4 934     -7 258
Net profit/loss                                                                      656            1 265    7 531          11 818      13 390

Of which non-controlling interest                                                    -33               55      249             624         680
Of which owners of the parent                                                        689            1 210    7 281          11 194      12 710

OTHER COMPREHENSIVE INCOME
Items in other comprehensive income that recycle over profit/loss:
Changes in fair value of financial instruments, net of tax                           -29              -13      -58               33          8
Items recorded in other comprehensive income in equity accounted investments         -61              -16     -151               18       -131
Recycling of currency translation effects related to foreign operations disposed       -                         -              -54        -54
Currency translation effects                                                       1 699             -515     -188           -3 942       -316

Items in OCI that will not recycle over profit/loss:

Changes in fair value of equity instruments, net of tax                               14                1       17                1        -27
Estimate deviation pensions, net of tax                                              308             -144     -141              -54       -153
Other comprehensive income                                                         1 931             -686     -519           -3 996       -673

Comprehensive income                                                               2 587             579     7 012           7 822      12 717

Of which non-controlling interest                                                    -32              37       242             552         642
Of which owners of the parent                                                      2 619             542     6 770           7 270      12 075
STATKRAFT AS GROUP – THIRD QUARTER AND INTERIM REPORT 2019                                  17

NOK million                                                  30.09.2019   30.09.2018   31.12.2018

STATEMENT OF FINANCIAL POSITION

ASSETS
Deferred tax assets                                                721          572          676
Intangible assets                                                3 964        2 799        3 233
Property, plant and equipment                                  109 078      101 299      105 744
Equity accounted investments                                    12 834       13 182       13 105
Other financial assets                                           3 268        3 884        3 986
Derivatives                                                      4 524        2 466        2 926
Non-current assets                                             134 389      124 201      129 669
Inventories                                                      3 039        3 597        6 316
Receivables                                                      9 650       14 246       12 831
Financial investments                                            1 381          937          604
Derivatives                                                      5 095       10 912        9 118
Cash and cash equivalents (incl. restricted cash)               18 492       19 046       23 175
Current assets                                                  37 657       48 737       52 044
Assets                                                         172 047      172 938      182 388

EQUITY AND LIABILITIES
Paid-in capital                                                 59 219       59 219       59 219
Retained earnings                                               33 564       30 012       34 815
Non-controlling interest                                         4 136        3 815        3 970
Equity                                                          96 919       93 046       98 004
Deferred tax                                                    10 288        8 865        9 826
Pension liability                                                2 721        2 594        2 655
Provisions allocated to capital employed                         2 142        2 466        2 552
Other provisions                                                   639          567          637
Interest-bearing liabilities                                    28 598       29 549       30 354
Derivatives                                                      3 346        1 029        1 253
Non-current liabilities                                         47 735       45 070       47 277
Interest-bearing liabilities                                     5 099        5 891        6 346
Taxes payable                                                    7 862        5 691        7 391
Interest-free liabilities allocated to capital employed          6 963        8 155        9 742
Other interest-free liabilities                                    611          756          503
Derivatives                                                      6 858       14 329       13 124
Current liabilities                                             27 393       34 823       37 107
Equity and liabilities                                         172 047      172 938      182 388
STATKRAFT AS GROUP – THIRD QUARTER AND INTERIM REPORT 2019                                                                                                                                                  18

                                                                                                           Other reserves
                                                                                      Paid-in capital

                                                                                                                                                                           Total majority
                                                                                                                                              Accumulated
                                                                                                                               Other equity

                                                                                                                                                                                                             Total equity
                                                                                                                                              differences

                                                                                                                                                                                            controlling
                                                                                                                                              translation

                                                                                                                                                             Retained
                                                                                                                                                             earnings

                                                                                                                                                                                            interests
                                                                                                                                                                                            Non-
NOK million

STATEMENT OF CHANGES IN EQUITY

Balance as of 01.01.2018                                                           59 219                -874               25 080              4 635       28 842      88 061                3 567       91 627

Net profit/loss                                                                                 -                   -       11 194                     -    11 194      11 194                   624      11 818

Items in other comprehensive income that recycles over profit/loss:
Changes in fair value of financial instruments, net of tax                                      -          36                          -               -         36        36                       -3       33
Items recorded in other comprehensive income in equity accounted investments                    -          18                          -               -         18        18                        -       18

Recycling of currency translation effects related to foreign operations disposed                -                   -                  -            -54        -54         -54                       -       -54

Currency translation effects                                                                    -                   -                  -       -3 872       -3 872      -3 872                    -70     -3 942

Items in OCI that will not recycle over profit/loss:

Changes in fair value of financial instruments, net of tax                                      -                 1                    -               -           1              1                  -             1
Estimate deviation pension, net of tax                                                          -                   -          -54                     -       -54         -54                       -       -54
Total comprehensive income for the period                                                       -          55               11 141             -3 926        7 270       7 270                   552       7 822

Dividend                                                                                        -                   -       -6 100                     -    -6 100      -6 100                   -92      -6 192
Business combinations/divestments                                                               -                   -            -                     -         -           -                  -212        -212
Balance as of 30.09.2018                                                           59 219                -818               30 121                 709      30 012      89 231                3 815       93 046

Balance as of 01.01.2018                                                           59 219                -874               25 080              4 635       28 842      88 061                3 567       91 627

Net profit/loss                                                                                 -                   -       12 710                     -    12 710      12 710                   680      13 390

Items in OCI that recycle over profit/loss:
Changes in fair value of financial instruments, net of tax                                      -                 8                    -               -           8              8                  -             8
Items recorded in other comprehensive income in equity accounted investments                    -        -131                          -              -       -131        -131                       -      -131
Recycling of currency translation effects related to foreign operations disposed                -           -                          -            -54        -54         -54                       -       -54
Currency translation effects                                                                    -                   -                  -          -306        -306        -306                    -10       -316

Items in OCI that will not recycle over profit/loss:
Changes in fair value of equity instruments, net of tax                                         -         -23                          -               -       -23         -23                      -4       -27
Estimate deviation pensions, net of tax                                                         -                   -         -129                     -      -129        -129                    -24       -153
Total comprehensive income for the period                                                       -        -146               12 581                -360      12 075      12 075                   642      12 717

Dividend                                                                                        -                   -       -6 100                     -    -6 100      -6 100                  -204      -6 304
Capital injection from non-controlling interest                                                 -                   -                  -               -           -                -            176         176
Business combinations/divestments                                                               -                   -                  -               -           -                -           -212        -212
Balance as of 31.12.2018                                                           59 219               -1 020              31 561              4 275       34 815      94 035                3 970       98 004
Implementation of IFRS 16 - see note 6                                                          -                   -         487                      -       487        487                        -      487
Balance as of 01.01.2019                                                           59 219               -1 020              32 048              4 275       35 303      94 522                3 970       98 491

Net profit/loss                                                                                 -                   -        7 281                     -     7 281       7 281                   249       7 531

Items in OCI that recycle over profit/loss:
Changes in fair value of financial instruments, net of tax                                      -         -58                          -               -       -58         -58                       -       -58
Items recorded in other comprehensive income in equity accounted investments                    -        -151                          -             -        -151        -151                      -       -151
Currency translation effects                                                                    -           -                          -          -178        -178        -178                    -10       -188

Items in OCI that will not recycle over profit/loss:

Changes in fair value of equity instruments, net of tax                                         -          15                          -               -         15        15                        2       17
Estimate deviation pensions, net of tax                                                         -                   -         -141                     -      -141        -141                       -      -141
Total comprehensive income for the period                                                       -        -193                7 141                -178       6 770       6 770                   242       7 012

Dividend                                                                                        -                   -       -8 510                     -    -8 510      -8 510                    -83     -8 593
Business combinations/divestments                                                               -                   -            -                     -         -           -                      8          8
Balance as of 30.09.2019                                                           59 219               -1 213              30 680              4 097       33 564      92 783                4 136       96 919
STATKRAFT AS GROUP – THIRD QUARTER AND INTERIM REPORT 2019                                                                                                                               19

                                                                                                                     Third quarter                     Year to date                  The year

 NOK million                                                                                                          2019             2018             2019            2018             2018

 STATEMENT OF CASH FLOW

 CASH FLOW FROM OPERATING ACTIVITIES
 Operating profit/loss (EBIT)                                                                                         2 678            2 040          11 740            9 562          15 446
 Depreciations, amortisations and impairments                                                                           793            1 019           2 670            2 826            3 734
 Gains/losses from divestments and disposals of assets                                                                  -58              -20             -44           -1 438           -1 399
 Unrealised effects included in operating profit/loss (EBIT)                                                            194            1 023            -318            3 527            4 557
 Dividend from equity accounted investments                                                                              22               13             732              567              606
 Changes in working capital                                                                                           5 431            3 480           2 778              394           -2 201
 Cash collateral and margin calls                                                                                      -448             -855            -187              167           -1 226
 Cash effects from foreign exchange derivatives related to operations                                                   103             -140             111             -116             -451
 Taxes paid                                                                                                              -5              -44          -3 969           -3 562           -3 605
 Other changes                                                                                                         -281             -334            -583             -320             -175
 Cash flow from operating activities                                                             A                    8 429            6 182          12 931           11 608          15 286

 CASH FLOW FROM INVESTING ACTIVITIES
 Investments in property, plant and equipment and intangible assets 1)                                               -2 020           -1 388          -4 224           -3 116           -4 713
 Business divestments, net liquidity inflow                                                                               -              575             550            7 315            7 316
 Acquisitions of shares in subsidiaries, net liquidity outflow                                                         -185               -9            -373               12           -1 587
 Loans to equity accounted investments                                                                                  -21                -             -25               -3               -3
 Repayment of loans from equity accounted investments                                                                    35                -             101              439            3 894
 Interests received from loans to equity accounted investments                                                            -                -              10               54              102
 Other investments                                                                                                       21              -47             134              -66              292
 Cash flow from investing activities                                                             B                   -2 170             -869          -3 826            4 635            5 301

 CASH FLOW FROM FINANCING ACTIVITIES
 New debt                                                                                                                80               48             179              178              759
 Repayment of debt                                                                                                     -845              -36          -4 665           -4 524           -5 535
 Interests paid                                                                                                        -106             -116            -750             -867           -1 104
 Interest rate derivatives realised before maturity                                                                     -88                -            -220                -                -
 Interests received from cash and other assets                                                                          104               99             348              205              284
 Dividend and group contribution paid to Statkraft SF                                                                     -           -6 040          -8 549           -6 040           -6 040
 Transactions with non-controlling interests                                                                              -                -             -83             -115              -53
 Cash flow from financing activities                                                             C                     -854           -6 045         -13 740          -11 162          -11 689

 Net change in cash and cash equivalents                                                         A+B+C                5 404             -732          -4 636            5 081            8 899

 Currency exchange rate effects on cash and cash equivalents                                                             40             -121              -48            -252                 59

 Cash and cash equivalents 01.07/01.01                                                                               13 046          19 899           23 175           14 217          14 217
 Cash and cash equivalents 30.09/31.12 2)                                                                            18 492          19 046           18 492           19 046          23 175

 Unused commited credit lines                                                                                                                          9 167            9 167            9 189
 Unused overdraft facilities                                                                                                                           1 008            1 006            1 002
 Restricted cash                                                                                                                                          34              440               61
1)   Investments in property, plant and equipment and intangible assets in the cash flow year to date are NOK 504 million lower than investments (excluding investments in shareholdings) shown
     in the segment reporting. This is mainly due to capitalised borrowing costs of NOK -97 million, non-cash additions from right-of-use assets of NOK -116 million and timing differences
     between capitalisation and payment date of NOK -286 million.
2)   Included in cash and cash equivalents are NOK 377 million related to joint operations.
STATKRAFT AS GROUP – THIRD QUARTER AND INTERIM REPORT 2019                                                                   20

Segments
The segment reporting is based on underlying figures, which is in accordance with how the corporate management makes,
follows up and evaluates its decisions. The tables on the next page show the reconciliation of the IFRS figures versus the
underlying figures.

From 2019, certain energy contracts and the related derivatives are recognised at fair value. Thus, the unrealised value
changes of these derivatives are presented as part of the underlying figures. See notes 5 and 6.

THIRD QUARTER 2019

The items below are excluded from the underlying figures1):
1.       Sales revenues: Offsetting effect in gains/losses from market activities. (NOK -25 million)

2.       Gains/losses from market activities: (NOK 379 million):
          Unrealised value changes from embedded derivatives in energy contracts. (NOK 354 million)
          Offsetting effect from Sales revenues. (NOK 25 million)

3.       Other operating income: Gains from divestments of business activities.

4.       Impairments: Related to intangible assets, property, plant and equipment. (NOK -133 million)

5.       Other operating expenses: Losses from divestments of business activities.

THE YEAR 2018

Gains or losses from realised hedges (IFRS 9) within market access activities (Customers) were reclassified from “Sales
revenues” to “Gains/losses from market activities”.

The items below were excluded from the underlying figures1) :
1.       Gains/losses from market activities:
          Unrealised value changes from embedded derivatives in energy contracts.
          Unrealised gains/losses from certain derivatives entered into for risk reduction purposes.

2.       Other operating income: Gains from divestments of business activities.

3.       Impairments: Related to intangible assets, property, plant and equipment.

4.       Other operating expenses: Losses from divestments of business activities.

1)   See section Alternative Performance Measures
STATKRAFT AS GROUP – THIRD QUARTER AND INTERIM REPORT 2019                                                                                  21

RECONCILIATION OF IFRS FIGURES VERSUS UNDERLYING FIGURES

                                                                   Third quarter 2019                         Third quarter 2018
NOK million                                                    IFRS       Adjustments      Underlying     IFRS       Adjustments      Underlying

Sales revenues                                                9 483                -25          9 458   15 398               -477         14 920
Gains/losses from market activities                            -176                379           203     -1 334               995           -339
Other operating income                                          421                   -          421       293                -17           277
Gross operating income                                        9 728                354         10 082   14 357                501         14 858
Energy purchase                                               -3 724                  -        -3 724    -8 761                  -        -8 761
Transmission costs                                             -416                   -          -416     -441                   -          -441
Net operating income                                          5 587                354          5 942    5 155                501          5 656
Salaries and payroll costs                                     -912                   -          -912     -905                   -          -905
Depreciations and amortisations                                -927                   -          -927     -880                   -          -880
Impairments                                                     133               -133              -     -139                139                -
Property tax and license fees                                  -309                   -          -309     -308                   -          -308
Other operating expenses                                       -896                   -          -896     -884                   -          -884
Operating expenses                                            -2 910              -133         -3 043    -3 116               139         -2 977
Operating profit/loss (EBIT)                                  2 678                221          2 899    2 040                640          2 679

                                                                       Year to date 2019                          Year to date 2018
NOK million                                                    IFRS       Adjustments      Underlying     IFRS       Adjustments      Underlying

Sales revenues                                               30 574                -14         30 560   39 096               -693         38 403
Gains/losses from market activities                           1 916                340          2 257    -3 048             2 490           -559
Other operating income                                          880                   -          880     2 219              -1 449          770
Gross operating income                                       33 370                327         33 697   38 267                348         38 615
Energy purchase                                              -11 638                          -11 638   -18 495                          -18 495
Transmission costs                                            -1 383                           -1 383    -1 302                           -1 302
Net operating income                                         20 350                327         20 677   18 470                348         18 817
Salaries and payroll costs                                    -2 652                           -2 652    -2 564                           -2 564
Depreciations and amortisations                               -2 789                           -2 789    -2 666                           -2 666
Impairments                                                     119               -119              -     -160                160                -
Property tax and license fees                                  -884                              -884     -957                              -957
Other operating expenses                                      -2 404                  -        -2 404    -2 561                  -        -2 561
Operating expenses                                            -8 610              -119         -8 729    -8 908               160         -8 748
Operating profit/loss (EBIT)                                 11 740                208         11 948    9 562                507         10 069

RECONCILIATION OF IFRS FIGURES VERSUS UNDERLYING FIGURES

                                                                                                                   The year 2018
NOK million                                                                                               IFRS       Adjustments      Underlying

Sales revenues                                                                                          55 350               -675         54 674
Gains/losses from market activities                                                                      -1 696             1 464           -232
Other operating income                                                                                   2 580              -1 449         1 131
Gross operating income                                                                                  56 233               -660         55 573
Energy purchase                                                                                         -26 808                  -       -26 808
Transmission costs                                                                                       -1 840                  -        -1 840
Net operating income                                                                                    27 585               -660         26 925
Salaries and payroll costs                                                                               -3 615                  -        -3 615
Depreciations and amortisations                                                                          -3 567                  -        -3 567
Impairments                                                                                               -167                167                -
Property tax and license fees                                                                            -1 352                  -        -1 352
Other operating expenses                                                                                 -3 439                  -        -3 439
Operating expenses                                                                                      -12 139               167        -11 972
Operating profit/loss (EBIT)                                                                            15 446               -493         14 953
STATKRAFT AS GROUP – THIRD QUARTER AND INTERIM REPORT 2019                                                                                                                                                                                22

                                                                                                                                                                                           Industrial ownership
                                                                                                                            International power
                                                                 Statkraft AS Group

                                                                                       European flexible

                                                                                                                                                                     District heating

                                                                                                                                                                                                                      Other activities
                                                                                                                                                   European wind

                                                                                                                                                                                                                                            Group items
                                                                                       generation

                                                                                                            operations

                                                                                                                                                   and solar
                                                                                                            Market
NOK million

SEGMENTS

Third quarter 2019
Gross operating income, external                              10 082                   4 904                3 408          920                        128           106                   554                         96                   -34
Gross operating income, internal                                             -             147                   44                  9                150                       -                    5               240                  -595
Gross operating income underlying                             10 082                   5 051                3 452          929                        278           106                   559                        336                  -629
Net operating income underlying                                5 942                   3 894                  390          798                        264            74                   520                        336                  -334
Operating profit/loss (EBIT) underlying                        2 899                   2 509                     53        315                         -17           -33                  200                         -99                  -28
Unrealised value changes from energy derivatives                -354                    -354                        -                    -                    -                 -                        -                       -                 -
Gains/losses from divestments of business activities                         -                       -              -                    -                    -                 -                        -                       -                 -
Impairments                                                     133                    1 035                        -      -516                     -385                -1                               -                       -                 -
Operating profit/loss (EBIT) IFRS                              2 678                   3 189                     53        -201                     -402             -34                  200                         -99                  -28
Share of profit/loss in equity accounted investments             -73                               1               4        -90                        -10                      -          31                            -8                        -

Year to date 2019
Gross operating income, external                              33 697                  14 967               12 819         2 398                       382           605                  2 354                       180                       -7
Gross operating income, internal                                             -             361                   72         64                        648                    1             29                        687                 -1 862
Gross operating income underlying                             33 697                  15 328               12 891         2 462                    1 030            606                  2 383                       867                 -1 869
Net operating income underlying                               20 677                  12 749                2 244         2 085                       989           423                  2 224                       867                  -903
Operating profit/loss (EBIT) underlying                       11 948                   8 699                1 405          721                        233           110                  1 129                      -398                    48
Unrealised value changes from energy derivatives                -327                    -327                       0                     -                    -                 -                        -                       -                 -
Gains/losses from divestments of business activities                         -                       -              -                    -                    -                 -                        -                       -                 -
Impairments                                                     119                    1 035                        -      -529                     -385                -3                               -                       -                 -
Operating profit/loss (EBIT) IFRS                             11 740                   9 407                1 406          192                      -152            107                  1 129                      -398                    48
Share of profit/loss in equity accounted investments            698                                1               5        -70                           -7                    -         796                         -26                          -

Assets and capital employed 30.09.2019
Property, plant and equipment and intangible assets          113 042                  57 601                  183        25 165                    9 246           3 455                16 078                     1 314                           -
Equity accounted investments                                  12 834                               1               8      2 788                       823                       -        9 104                       109                           -
Loans to equity accounted investments                          1 544                                 -              -      985                        530                       -          29                                    -                 -
Other assets                                                  44 627                   2 265                4 221         1 589                       378           143                   975                     35 372                  -315
Total assets                                                 172 047                  59 867                4 412        30 528                   10 977           3 598                26 185                    36 795                  -315
Assets not included in capital employed                      -48 733                         -39               -15       -4 091                   -1 364                        -       -9 644                    -33 580                          -
Liabilities included in capital employed                     -16 967                  -2 969               -2 839        -1 246                     -650            -161                -1 151                     -8 266                  315
Capital employed                                             106 347                  56 859                1 558        25 191                    8 963           3 437                15 390                     -5 051                          -

Return on average capital employed (ROACE)                    15.8%                   21.6%                38.4%          3.4%                     5.3%            5.8%                 10.7%                         n/a                   n/a
Return on average equity accounted investments (ROAE)          4.5%                          n/a               n/a       -2.6%                     2.5%              n/a                 6.8%                         n/a                   n/a

Depreciations, amortisations and impairments                  -2 670                    -219                   -19       -1 171                     -636            -131                  -380                      -115                           -
Maintenance investments and other investments                  1 953                   1 077                     62        261                           93                  8            417                         36                           -
Investments in new capacity                                    2 775                       132                     3       445                     1 842            112                   240                                    -                 -
Investments in shareholdings                                    398                                  -             4        22                           85                     -          53                        234                           -
You can also read