Interim Report Q1/2021 - Statkraft AS

Page created by Byron Richards
 
CONTINUE READING
Interim Report Q1/2021 - Statkraft AS
Interim Report Q1/2021
Statkraft AS
Interim Report Q1/2021 - Statkraft AS
Key figures

                                                                                                                                                First Quarter                             Year
NOK million                                                                                                                             2021           2020       Change                  2020

Income statement
Gross operating revenues and other income underlying                                                                                  18 147         12 034         6 113               38 060
Net operating revenues and other income underlying                                                                                    10 674           7 593        3 081               20 960
EBITDA underlying                                                                                                                       8 201          5 145        3 056               10 736
Operating profit/loss (EBIT) underlying                                                                                                 7 216          4 090        3 126                6 670
Operating profit/loss (EBIT) IFRS                                                                                                       6 318          4 386        1 932                5 749
Share of profit/loss in equity accounted investments                                                                                      444           722           -278                835
Net financial items                                                                                                                     1 511         -5 947        7 458               -1 631
Profit/loss before tax                                                                                                                  8 273           -840        9 113                4 953
Net profit/loss                                                                                                                         4 819         -1 888        6 708                3 532

Key financial metrics
Operating profit/loss (EBIT) margin underlying                                                                                         39.8%          34.0%          5.8%               17.5%
ROACE                                                                                                                                   8.3%          12.5%         -4.2%                 5.7%
ROAE                                                                                                                                    4.2%          11.2%         -7.0%                 6.3%

Balance sheet and investments
Assets                                                                                                                               185 617        199 249       -13 633              181 257
Equity                                                                                                                               100 466        105 409         -4 943              98 028
Net interest-bearing debt                                                                                                             22 963         26 451         -3 487              27 393
Capital employed                                                                                                                     116 790        117 798         -1 008             118 653
Equity accounted investments                                                                                                          13 959         13 915             44              13 492
Total investments                                                                                                                       1 519          1 289          229                9 901

Cash Flow
From operating activities                                                                                                               3 950         -2 458        6 408               11 632
Cash and cash equivalents (incl. restricted cash)                                                                                     12 203         10 105         2 097               11 155

Currency rates
NOK/EUR average rate                                                                                                                    10.26          10.46         -0.19              10.72
NOK/EUR closing rate                                                                                                                    10.00          11.51         -1.51              10.47

Definitions
See section Alternative Performance Measures at the end of this report for definitions.

The quarterly report shows the development in the quarter compared with the same quarter last year, unless otherwise stated.

Table of Contents
Strategic targets ..............................................................................................................................................................2
Corporate responsibility and HSE ...................................................................................................................................3
Market and production.....................................................................................................................................................3
Financial performance .....................................................................................................................................................5
Segments ......................................................................................................................................................................12
Outlook ..........................................................................................................................................................................17
Statkraft AS Group Interim Financial Statements..........................................................................................................18
Alternative Performance Measures ...............................................................................................................................35
Interim Report Q1/2021 - Statkraft AS
STATKRAFT AS GROUP – FIRST QUARTER AND INTERIM REPORT 2021                                                                      1

                                                 CONTINUED LOW
                                               RECORD-HIGH     NORDICRESULT
                                                           OPERATING  POWER
                                                 PRICES

                                                High Nordic power prices and successful energy
                                                The Nordic power
                                                management     led toprices are still
                                                                      an all-time highunder  pressure,
                                                                                         underlying     as they
                                                                                                     EBIT.
                                                have been throughout 2020. Despite this we delivered a
                                                reasonably
                                                Statkraft   good operating
                                                          continues            profitcapture
                                                                     to seek and      in the third
                                                                                             new quarter.
                                                                                                   business
                                                opportunities in the green transition.
                                                A large wind power project in Brazil will contribute to
                                                delivering on our growth strategy.
 The first quarter was a promising start to the year.              Statkraft has decided to build its first wind farms in
 Higher power prices and increased hydropower                      Chile, broadening the company’s renewable energy
 generation resulted in a record-high underlying                   portfolio in the region. The 102 MW project consists of
 operating result. In addition, Statkraft continued to             three wind farms, which are expected to generate more
 deliver on its strategy and initiated new projects in             than 300 GWh of renewable energy annually.
 the quarter.
                                                                   Statkraft has signed a collaboration agreement with
 The underlying EBIT was NOK 7.2 billion in the                    Yara and Aker Horizons, aiming to establish Europe’s
 quarter, an increase of NOK 3.1 billion from the first            first large-scale green ammonia project in Norway. The
 quarter last year.                                                partners will target green ammonia opportunities within
                                                                   shipping, agriculture and industrial applications, by
 The average Nordic system price was 42.3 EUR/MWh,                 electrifying Yara’s existing ammonia facility at Herøya in
 a 175 per cent rise compared with the same quarter in             Porsgrunn, Norway. In addition, Statkraft has entered
 2020. Total power generation increased by 16 per cent             into a partnership with Aker Offshore Wind to explore
 to 20.6 TWh.                                                      offshore wind project opportunities in Norway. These
                                                                   are clear examples of Statkraft finding business
 A strengthening of NOK against EUR had a positive                 opportunities in the green transition, which also support
 effect on net financial items, which ended at NOK 1.5             sustainable development goals, innovation and
 billion. Net profit was NOK 4.8 billion, an increase of           economic development.
 NOK 6.7 billion compared with the result in the first
 quarter last year.                                                Following the transfer of the operation of the Roan wind
                                                                   farm to TrønderEnergi in February, Statkraft has chosen
 Cash flow from operating activities in the quarter was            to sell the ownership interest in the wind farm to
 solid at NOK 4 billion. The net interest-bearing debt to          TrønderEnergi and Stadtwerke München. Statkraft will
 equity ratio was 18.6 per cent, giving room for                   continue its ownership interest and role as an operator
 significant new investments within renewable energy.              of the five remaining wind farms in Fosen Vind.

 Statkraft continues to focus on reliable and safe
 operations amidst the Covid-19 pandemic and is
 closely monitoring the development.

     Operating profit/loss (EBIT) underlying                         Cash flow from operating activities
     NOK million                                                     NOK million
Interim Report Q1/2021 - Statkraft AS
STATKRAFT AS GROUP – FIRST QUARTER AND INTERIM REPORT 2021                                                                     2

Strategic targets
The Board of Directors has set financial and non-financial targets for the Group. The performance related to several of the
targets will be assessed over a longer time horizon. The main targets and the status at the end of the quarter are listed in the
table below.

  AMBITION                                                   TARGET                                              STATUS

  HSE and sustainability

  Prevent incidents and be committed to a workplace
                                                             Zero serious injuries                                   0
  without injury or harm

  Prevent corruption and unethical practices in all
                                                             Zero serious compliance incidents                       0
  activities

  Deliver climate-friendly, renewable power and
                                                             Zero serious environmental incidents                    0
  taking responsible environmental measures

  Financial performance

  Deliver a solid return on capital                          >7% ROACE                                             8.3%

 Value creation in ongoing business

  Efficient management of energy resources in the            >3.5% higher realised prices than the average
                                                                                                                   6.3%
  Nordic hydropower fleet                                    spot price in the market

  Growth

  Grow capacity in renewable energy (hydro-, wind-
                                                             9 GW growth by 2025                                  2.4 GW
  and solar power)

  Organisational enablers

  Improve diversity in background, competence and            Long-term target of 40% women in top
                                                                                                                   30%
  gender across the company                                  management positions

Caring for people is at the core of Statkraft’s activities and Statkraft works continuously towards the goal of zero injuries.
Strengthening the safety culture and performance – across the organisation and among subcontractors – is top priority and has
high attention throughout the organisation. In the first quarter of 2021 there were no serious injuries.

Statkraft has zero tolerance for corruption and unethical practices in all activities, and there were no serious compliance
incidents in the first three months of 2021.

Assessing environmental risks is part of Statkraft’s daily risk management procedures and practices, and there were no serious
environmental incidents in the first quarter.

Statkraft aims to deliver a solid return on capital employed. Measured on 12 months rolling basis, the ROACE was 8.3% which
is above the target. See section “Return on average capital employed (ROACE)” for more information.

With Europe’s largest portfolio of flexible hydropower plants and reservoir capacity, Statkraft can optimise Nordic hydropower
generation over several years. Statkraft is therefore well positioned to achieve a higher average price for this generation than
the average Nordic spot price. As of March 2021, Statkraft’s realised prices (measured over the last 60 months) were 6.3%
higher than the average spot price in the Nordics.

The target of developing 9 GW by 2025 remains. At the end of the first quarter, the status for this target is 2.4 GW, up 145 MW
from the end of 2020. The increase relates to the Torsa wind project in Chile and solar projects in the Netherlands.

Statkraft aims for a diverse workforce and has a long-term ambition of having at least 40% women in top management
positions. At the end of March 2021, the total share of women in all top management positions was 30%, up from 29% at the
end of 2020. The 40% target was reached for the corporate management in 2020.
Interim Report Q1/2021 - Statkraft AS
STATKRAFT AS GROUP – FIRST QUARTER AND INTERIM REPORT 2021                                                                        3

 Corporate responsibility and HSE
                                                                                             First Quarter                        Year
                                                                                              2021                2020            2020

 Corporate responsibility and HSE
 Fatal accidents1)                                                                                 0                 1                 0
 Serious environmental incidents                                                                   0                 0                 0
 Absence due to illness, Group                                                                2.2%               3.5%             2.4%
 TRI rate 1) 2)                                                                                   3.8              4.9                4.2
 Full-time equivalents, Group                                                                4 171            3 700               4 074
1)   Includes employees and suppliers in plants where Statkraft owns 20% or more.
2)   TRI rate (rolling 12 months): Number of injuries per million hours worked.

There were no serious injuries reported in the quarter.

Market and production
Power prices and optimisation of power production constitute the fundamental basis for Statkraft’s revenues. The majority of
Statkraft’s output is generated in the Nordic region. Power prices are influenced by hydrological factors, commodity prices for
thermal power generation, technology cost, grid restrictions and nuclear availability.

POWER PRICES

       Electricity, average monthly system price
       EUR/MWh

Sources: Nord Pool and the European Energy Exchange (EEX).

                                                                                                  First Quarter                   Year
                                                                                           2021           2020           Change   2020

 Market prices (average)
 System price, Nord Pool (EUR/MWh)                                                         42.3           15.4             26.9    10.9
 Spot price (base), EEX (EUR/MWh)                                                          49.6           26.5             23.1    30.4
 Spot price (peak), EEX (EUR/MWh)                                                          59.5           34.8             24.7    37.4
 Spot price (base), N2EX UK (GBP/MWh)                                                      63.9           32.7             31.2    35.2

 Sources: Nord Pool and European Energy Exchange (EEX).

The average system price in the Nordic region was 42.3 EUR/MWh in the quarter, an increase of 175%. The increase was
mainly due to the cold weather combined with lower generation from wind power driven by low wind speeds. In addition, there
were significant price area differences in the quarter.

The average base price in the German market (EEX) was 49.6 EUR/MWh in the quarter, an increase of 87%. The increase was
mainly due to higher gas, CO2 and coal prices. Significantly lower wind power generation due to low wind speeds also
contributed to the increase.

The average base price in the UK was 63.9 GBP/MWh in the quarter, an increase of 96%. The increase was mainly driven by
higher gas prices.
Interim Report Q1/2021 - Statkraft AS
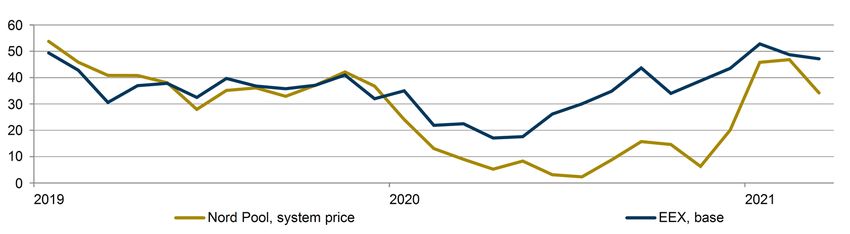
STATKRAFT AS GROUP – FIRST QUARTER AND INTERIM REPORT 2021                                                                                  4

CONSUMPTION AND RESOURCE ACCESS IN THE NORDIC REGION

                                                                                                                  First Quarter              Year
 Nordic reservoir water levels
                                                                         TWh                                         2021      2020          2020
 %
                                                                         Consumption and output

                                                                         Nordic
                                                                         Nordic consumption                       118.6       110.1         386.9
                                                                         Nordic output                            121.5       116.6         387.8
                                                                         Net Nordic import(+)/export(-)              -2.9          -6.5         -0.9

                                                                         Norway
                                                                         Norwegian consumption                       42.7          39.2     133.5
                                                                         Norwegian output                            45.6          40.4     133.4
                                                                         Net Norwegian import(+)/export(-)           -2.9          -1.2          0.1
Source: Nord Pool.

The total reservoir level for all hydropower producers in the Nordic region was 119% of median level at the end of the quarter,
corresponding to 44% of total capacity.

STATKRAFT’S POWER GENERATION
Statkraft’s generation optimisation is determined by price expectations, water reservoir capacity and reservoir water levels,
access to resources (inflow and wind), the margin between power prices and gas in addition to CO2 prices (spark spread) and
grid restrictions.

                                              First Quarter     Year                                         First Quarter                Year
TWh                                            2021     2020    2020   TWh                                    2021      2020              2020

Generation, technology                                                 Generation, geography
Hydropower                                      18.3    15.6    55.7   Norway                                 15.9          13.2          47.5
Wind power                                       1.2      1.4    4.3   Sweden                                  2.0           2.3           7.4
Gas-fired power                                  1.1      0.7    5.1   Europe ex. Nordic                       1.5           1.0           6.4
Biomass and solar power                          0.1      0.1    0.3   Rest of the world                       1.1           1.2           4.1
Total generation                                20.6    17.7    65.4   Total generation                       20.6          17.7          65.4

The Group generated a total of 20.6 TWh in the quarter, an increase of 16%. Norwegian hydropower generation increased,
following optimisation of the factors above. Generation from wind power decreased driven by lower wind speeds, partly offset
by new capacity in Norway. Gas-fired power generation increased, driven by more hours with positive spark spread.

The Group’s district heating deliveries amounted to 0.5 TWh and were 0.1 TWh higher compared with the same quarter last
year.
Interim Report Q1/2021 - Statkraft AS
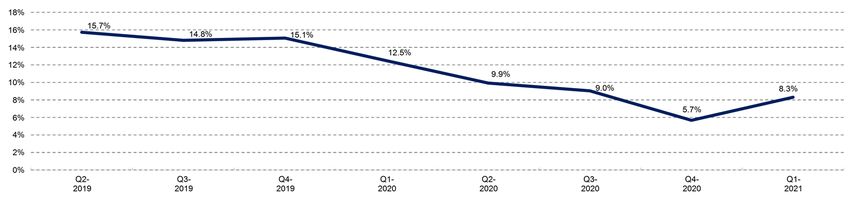
STATKRAFT AS GROUP – FIRST QUARTER AND INTERIM REPORT 2021                                                                      5

Financial performance
                                                                                                    First Quarter              Year
NOK million                                                                                 2021            2020    Change     2020

Net operating revenues and other income underlying                                         10 674          7 593      3 081   20 960
Operating profit/loss (EBIT) underlying                                                     7 216          4 090      3 126    6 670
Operating profit/loss (EBIT) IFRS                                                           6 318          4 386      1 932    5 749
Share of profit/loss in equity accounted investments                                          444            722       -278      835
Net financial items                                                                         1 511         -5 947      7 458   -1 631
Profit/loss before tax                                                                      8 273           -840      9 113    4 953
Tax expense                                                                                -3 453         -1 048     -2 405   -1 421
Net profit/loss                                                                             4 819         -1 888     6 708     3 532

FINANCIAL PERFORMANCE FIRST QUARTER
The increase in underlying EBIT was mainly driven by significantly higher Nordic power prices and higher Norwegian
hydropower generation. Underlying operating expenses were slightly lower than in the same quarter last year.

The decrease in share of profit/loss in equity accounted investments was primarily related to Agder Energi and BKK.

Net financial items in the quarter included positive currency effects of NOK 1361 million, primarily related to a strengthening of
NOK against EUR. In the comparable period there were negative currency effects of NOK 5715 million.
Interim Report Q1/2021 - Statkraft AS
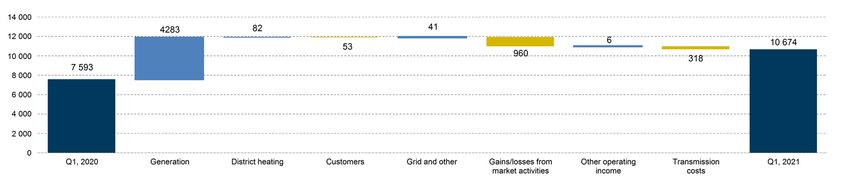
STATKRAFT AS GROUP – FIRST QUARTER AND INTERIM REPORT 2021                                                                                                              6

NET OPERATING REVENUES AND OTHER INCOME UNDERLYING

                                                                                                                                           First Quarter               Year
NOK million                                                                                                                        2021            2020    Change      2020

Net operating revenues and other income
Generation                                                                                                                         9 302          4 643     4 659    16 367
District heating                                                                                                                     433            285       148       773
Customers                                                                                                                          5 785          3 827     1 959    13 579
Grid and other                                                                                                                     1 081            780       302     3 156
Sales revenues                                                                                                                    16 602          9 535     7 067    33 875
Gains/losses from market activities                                                                                                1 436          2 396      -960     3 619
Other operating income                                                                                                               110            103         6       566
Gross operating revenues and other income                                                                                         18 147        12 034       6 113    38 060
Generation                                                                                                                          -689          -314        -376    -1 759
District heating                                                                                                                    -155           -89         -66      -237
Customers                                                                                                                         -5 547        -3 536      -2 012   -13 175
Other                                                                                                                               -494          -234        -261      -889
Energy purchase                                                                                                                   -6 886         -4 172     -2 714   -16 060
Transmission costs                                                                                                                  -588           -269       -318    -1 040
Net operating revenues and other income                                                                                           10 674          7 593     3 081    20 960

    Net operating revenues and other income underlying
    NOK million

In the graph above Generation, District heating, Customers and Grid and other are shown as sales revenues less energy purchase.

   Net operating revenues from Generation increased, mainly driven by significantly higher Nordic power prices and higher
    Norwegian hydropower generation.
   Net operating revenues from District heating increased, primarily driven by higher heating prices in Norway and higher
    delivered volume.
   Gains/losses from market activities decreased, primarily driven by reduced contributions from financial hedging, market
    access and trading. This was partly offset by improved unrealised value changes from certain embedded derivatives linked
    to long-term industry contracts.
   Transmission costs increased, mainly driven by higher Norwegian power prices and higher Norwegian hydropower
    generation.

OPERATING EXPENSES UNDERLYING

                                                                                                                                           First Quarter               Year
NOK million                                                                                                                        2021            2020    Change      2020

Operating expenses
Salaries and payroll costs                                                                                                        -1 310         -1 172       -138    -4 627
Depreciations and amortisations                                                                                                     -985         -1 055         70    -4 066
Property tax and licence fees                                                                                                       -348           -309        -39    -1 264
Other operating expenses                                                                                                            -814           -967        153    -4 334
Operating expenses                                                                                                                -3 458         -3 503        45    -14 290

      The increase in salaries and payroll costs was mainly due to a higher number of full-time equivalents.
      The decrease in depreciations and amortisations was mainly driven by a deconsolidation of a company in Nepal in the
       third quarter of 2020.
      The increased property tax and licence fees was mainly driven by a higher valuation of the tax base in Norway.
      Other operating expenses was lower mainly due to reduced expected credit losses in the segment Market operations
       and a negative one-off effect in Brazil in the comparable period.
Interim Report Q1/2021 - Statkraft AS
STATKRAFT AS GROUP – FIRST QUARTER AND INTERIM REPORT 2021                                                                    7

ITEMS EXCLUDED FROM OPERATING PROFIT/LOSS (EBIT) UNDERLYING
The segment reporting is based on underlying figures, which is in accordance with how the corporate management makes,
follows up and evaluates its decisions. Unrealised value changes from embedded EUR derivatives, gains/losses from
divestments of business activities and impairments/reversal of impairments are excluded from operating profit/loss (EBIT)
underlying. See section Segments in the quarterly financial statements as well as the Alternative Performance Measures section
for further information.

                                                                                                  First Quarter               Year
NOK million                                                                                2021           2020    Change     2020

Items excluded from operating profit/loss (EBIT) underlying
Unrealised value changes from embedded EUR derivatives                                     -949           2 853    -3 803      339
Gains/losses from divestments of business activities                                          -               0        -0      119
Impairments/reversal of impairments                                                          51          -2 558     2 609   -1 379
Items excluded from operating profit/loss (EBIT) underlying                                -898            295     -1 193     -922

    Embedded EUR derivatives linked to long-term industry contracts had a negative effect. This was mainly driven by a
     strengthening of forward NOK against EUR.
    The net reversal of impairments in the quarter was mainly related to wind farms in the segment European wind and solar.

FINANCIAL ITEMS

                                                                                                  First Quarter              Year
NOK million                                                                               2021            2020    Change     2020

Financial items
Net currency effects                                                                      1 361         -5 715     7 076    -1 520
Interest and other financial items                                                          150           -232       382      -111
Net financial items                                                                       1 511         -5 947     7 458    -1 631

      Net currency gains in the quarter were related to a strengthening of NOK against EUR, and were primarily related to
       external debt.
      Interest and other financial items increased mainly due to positive value changes on interest rate derivatives, and reduced
       interest expenses as a result of lower average interest rates.
Interim Report Q1/2021 - Statkraft AS
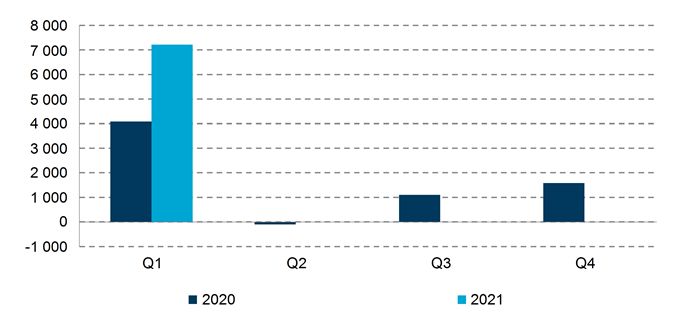
STATKRAFT AS GROUP – FIRST QUARTER AND INTERIM REPORT 2021                                                                 8

TAX EXPENSE

                                                                                               First Quarter              Year
NOK million                                                                            2021            2020    Change     2020

Tax expense
Profit/loss before tax                                                                 8 273           -840     9 113    4 953
Nominal tax rate in Norway                                                              22%            22%        0%      22%

Tax calculated at nominal Norwegian tax rate                                           1 820           -185      2 005   1 090
Tax on share of profit/loss in equity accounted investments                              -98           -159         61    -184
Resource rent tax payable                                                              1 499            502        997   1 282
Resource rent tax deferred                                                               -12          1 123     -1 135     -94
Other differences from the nominal Norwegian tax rate                                   244            -233       477     -673
Tax expense                                                                            3 453          1 048      2 405    1 421
Effective tax rate                                                                    41.7%        -124.8%     166.6%    28.7%

Tax expense first quarter
    Resource rent tax payable increased, mainly due to significantly higher Nordic power prices and higher generation.This
      was partly offset by higher taxable deductions due to changes in resource rent tax regulations. From 2021 onwards all new
      investments related to hydropower generation can be deducted immediately for resource rent tax purposes.
    Resource rent tax deferred decreased, mainly due to unrealised gains related to embedded derivatives in the comparable
      period.
    Other differences from the nominal Norwegian tax rate of NOK 244 million were mainly due to changes relating to previous
      years and foreign tax rates differences.

RETURN ON AVERAGE CAPITAL EMPLOYED (ROACE)

    ROACE (rolling 12 months)

The increase in ROACE compared with year-end 2020 was mainly due to a higher operating profit/loss (EBIT) underlying
(rolling 12 months). Average capital employed was stable compared with year-end 2020.
STATKRAFT AS GROUP – FIRST QUARTER AND INTERIM REPORT 2021                                                                                    9

CASH FLOW

                                                                                                             First Quarter                   Year
NOK million                                                                                           2021           2020     Change         2020

Cash flow
Operating activities                                                                                 3 950         -2 458      6 408        11 632
Investing activities                                                                                -1 074         -1 271        197        -7 226
Financing activities                                                                                -1 761         -1 625       -136        -8 280
Net change in cash and cash equivalents                                                              1 115         -5 354      6 469        -3 874

Cash and cash equivalents (incl. restricted cash) at period end                                     12 203        10 105       2 097        11 155

Cash flow first quarter
 The quarterly EBIT (IFRS) of NOK 6318 million includes NOK 2877 million in negative unrealised effects. This is somewhat
   offset by cash outflow of NOK 3477 MNOK million related to cash collaterals, margin calls, and option premiums as well as
   taxes paid of NOK 1555 million.
 The negative cash flow from investing activities was mainly due to investments in property, plant and equipment.
 The negative cash flow from financing activities was mainly due to repayment of debt.

INTEREST-BEARING DEBT REPAYMENT PLAN
  Long-term debt redemption profile
  NOK million

10 000

 8 000

 6 000

 4 000

 2 000

        -
                 2021          2022            2023           2024   2025   2026       2027           2028             2029        >2030
                                                                                                                                     Year
                                             Loans in subsidiaries                 Loans in Statkraft AS

At the end of the quarter, Statkraft had the following financial structure:
 Net interest-bearing debt totalled NOK 22 963 million.
 Net interest-bearing debt-equity ratio was 18.6%.
STATKRAFT AS GROUP – FIRST QUARTER AND INTERIM REPORT 2021                                                                                       10

INVESTMENTS

New capacity: Construction of new power or heating plants, or investments that increase the capacity (MW) of existing plants.
These projects are referred to as build-own-operate (BOO) further in the report.
Maintenance: Investments in existing power or heating plants that do not increase the capacity (MW).
Other: Other investments in property, plant and equipment (PPE) or intangible assets. This include assets such as grid, heating
pipes, biofuel assets, vehicle charging infrastructure, data center assets and office equipment.
New capacity for subsequent divestment (DS/DBS): Development and construction investments related to projects that
Statkraft intends to divest either before, at the time of, or shortly after completion. The projects are presented as inventories and
are reported under the segment European wind and solar. These projects are referred to as develop-sell (DS) and develop-
build-sell (DBS) further in the report.
Shareholdings, consolidated: Acquisition of shareholdings that are fully or proportionally consolidated.
Shareholdings, equity accounted: Investments in shareholdings that are accounted in accordance with the equity method.
Shareholdings, financial non-current: Investments in shareholdings that are recognised as financial assets in accordance
with IFRS 9 Financial instruments.

Total investments in the quarter amounted to NOK 1519 million. Maintenance investments and other investments were primarily
related to Nordic hydropower. Investments in new capacity were mainly related to construction of hydropower plants in Chile
and India, as well as onshore wind farms in the UK.

                                                                  European                                  European
                                                  Statkraft AS      flexible      Market    International   wind and    District    Industrial            Other
NOK million
                                                        Group    generation    operations         power         solar   heating    ownership          activities

First quarter 2021
New capacity                                              178            16             -            147            -         -            16                  -
Maintenance                                               406           325             -             30            -         4            47                  -
Other                                                     646            12            3              13         368         67           138                44
Investments in PPE and intangible assets                1 230           353            3             190         368         71           201                44

New capacity for subsequent divestment (DS/DBS)           271              -            -               -        271           -             -                 -

Shareholdings, consolidated                                 -              -            -               -           -          -             -                -
Shareholdings, equity accounted                             -              -            -               -           -          -             -                -
Shareholdings, financial non-current                       17              -            -               -           -          -             -               17
Investments in shareholdings                               17              -            -               -           -          -             -               17

Total investments                                       1 519           353            3             191         640         71           200                62

                                                                  European                                  European
                                                  Statkraft AS      flexible      Market    International   wind and    District    Industrial            Other
NOK million
                                                        Group    generation    operations         power         solar   heating    ownership          activities

First quarter 2020
New capacity                                              638            55             -            299         144         38           102                 -
Maintenance                                               454           328             -             11           -          -           111                 4
Other                                                     134             2            2              13          32           -           27                58
Investments in PPE and intangible assets                1 226           385            2             323         176         38           240                62

New capacity for subsequent divestment (DS/DBS)              -             -            -               -           -          -             -                 -

Shareholdings, consolidated                                21              -            -              -          21           -             -                 -
Shareholdings, equity accounted                            43              -            -             43           -           -             -                 -
Shareholdings, financial non-current                        -              -            -              -           -           -             -                 -
Investments in shareholdings                               64              -            -             43          21           -             -                 -

Total investments                                       1 289           385            2             366         196         38           241                62
STATKRAFT AS GROUP – FIRST QUARTER AND INTERIM REPORT 2021                                                                                                                                        11

                                                                                              European                                                European
                                                                        Statkraft AS            flexible        Market            International       wind and        District       Industrial            Other
 NOK million
                                                                              Group          generation      operations                 power             solar       heating       ownership          activities

 The year 2020
 New capacity 1)                                                               4 103                185                     -             1 064           2 263           203               388                 -
 Maintenance                                                                   2 275              1 646                 -                  118               3              13              494                1
 Other                                                                           753                 49                13                   60             294               -              132              205
 Investments in PPE and intangible assets                                      7 131              1 880                13                 1 242           2 560           216            1 014               206

 New capacity for subsequent divestment (DS/DBS) 1)                              413                   -                    -                 -            413                  -             -                 -

 Shareholdings, consolidated                                                   1 923                   -                    -                -            1 850                 -             -               73
 Shareholdings, equity accounted                                                 345                   -                    -               43                -                 -             -              302
 Shareholdings, financial non-current                                             89                   -                    -                -                -                 -             -               89
 Investments in shareholdings                                                  2 357                   -                    -               43            1 850                 -             -              464

 Total investments                                                             9 901              1 880                13                 1 286           4 822           215            1 014               670
 1)   With the introduction of the new business model (DS/DBS) in the segment European wind and solar from the fourth quarter 2020, related investments are presented separately in this overview.
      The change was implemented prospectively. Thus, only investments for the fourth quarter 2020, previously reported as “investments in new capacity” are presented separately in the overview
      of investments for the full year 2020.

Projects in consolidated operations 1)

                                                                                                                 Business                                         Statkraft's             Planned
                                                                                                                                                  New capacity    ownership
First quarter                                                     Project                                         model 2) Country
                                                                                                                                                       (MW) 3)         share           completion

Committed investments in the period
Wind power                                                        Torsa                                    BOO                  Chile                     108          100%          2022         Q4
Hydropower                                                        Eringsdalen and Nordalen Dams            n/a                  Norway                      -          100%          2025         Q4

Completed projects in the period
Wind power                                                        Fosen - Harbaksfjellet                   BOO                  Norway                    108           52%          2021         Q1
                                                                  Fosen - Kvenndalsfjellet                 BOO                  Norway                    101           52%          2021         Q1

Main construction projects
Hydropower                                                        Songa and Trolldalen Dams                n/a                  Norway                      -          100%          2021         Q3
                                                                  Tidong                                   BOO                  India                     150          100%          2022         Q4
                                                                  Los Lagos                                BOO                  Chile                      52          100%          2023         Q4
                                                                  Straumsmo                                n/a                  Norway                      -          100%          2024         Q1
                                                                  Tokke-Vinje                              n/a                  Norway                      -          100%          2025         Q2
                                                                  Trollheim Dam                            n/a                  Norway                      -          100%          2026         Q3
Wind power                                                        Fosen - Geitfjellet                      BOO                  Norway                    155           52%          2021         Q2
                                                                  Windy Rig                                DBS                  UK                         43          100%          2021         Q2
                                                                  Twentyshilling                           DBS                  UK                         38          100%          2022         Q1
                                                                  Cloghan                                  DBS                  Ireland                    34          100%          2022         Q4
                                                                  Taghart                                  DBS                  Ireland                    23          100%          2022         Q4
                                                                  Ventos de Santa Eugenia                  BOO                  Brazil                    519          100%          2023         Q2
Solar power                                                       Ballymacarny                             DBS                  Ireland                   200          100%          2022         Q3
Other technologies                                                Lister Drive Greener Grid Park 4)        BOO                  UK                           -         100%          2021         Q3
1) Projects   with an estimated CAPEX of at least NOK 300 million.
2) In   accordance with the strategy: BOO (Build, Own, Operate), DBS (Develop, Build, Sell). n/a refers to rehabilitation projects.
3) Total   for project, incl. partners' share.
4) Grid   network rotating stabilisers.
STATKRAFT AS GROUP – FIRST QUARTER AND INTERIM REPORT 2021                                                                                                                 12

Segments
The Group’s operating segments are in accordance with how the corporate management makes, follows up and evaluates its
decisions. The operating segments have been identified on the basis of internal management information that is periodically
reviewed by the corporate management and used as a basis for resource allocation and key performance review.

The reportable segments are defined as:

European flexible generation includes asset ownership and operations of most of the Group’s hydropower business in
Norway, Sweden, Germany and the United Kingdom, as well as the gas-fired and the biomass power plants in Germany and the
subsea interconnector between Sweden and Germany.

Market operations includes trading, origination, market access for smaller generators of renewable energy, as well as revenue
optimisation and risk mitigation activities related to Continental and Nordic power generation. The segment has activities in
several countries in Europe, and is also active in Brazil, India and USA. Market operations generates profit from changes in the
market value of energy and energy-related products, and from buying and selling both standard and structured products,
typically environmental certificates and power contracts.

International power includes development, ownership and operations of renewable assets in emerging markets. The segment
operates in Brazil, Peru, Chile, India, Nepal, Turkey and Albania.

European wind and solar includes development and construction of onshore wind and solar power plants with the intention to
divest the power plants either before, at the time of, or shortly after completion (DS/DBS). The segment has development and
construction activities in several countries in Europe. The segment also includes asset ownership and operation of wind farms in
Norway, Sweden, Ireland and the United Kingdom.

District heating includes development, ownership and operations of district heating plants in Norway and Sweden.

Industrial ownership includes management and development of Norwegian shareholdings within the Group’s core business
and includes the shareholdings in Skagerak Energi, BKK and Agder Energi. Skagerak Energi is included in the consolidated
financial statements, while BKK and Agder Energi are reported as equity accounted investments.

In addition:
Other activities includes costs related to governance of the Group, new businesses within biomass and electric vehicle
charging as well as venture capital investments. Unallocated assets are also reported as Other activities.

Group items includes eliminations.
                                                                                                        International
                                                             Statkraft AS

                                                                            generation

                                                                                          operations

                                                                                                                                                 ownership
                                                                            European

                                                                                                                        European

                                                                                                                                                 Industrial
                                                                                                                        and solar

                                                                                                                                                              activities
                                                                                                                                     heating
                                                                            flexible

                                                                                                                                     District
                                                                                          Market
                                                             Group

                                                                                                                                                                                Group
                                                                                                        power

                                                                                                                                                              Other

                                                                                                                                                                                items
                                                                                                                        wind

First quarter

Income statement
Gross operating revenues and other income underlying     18 147               8 016      7 288             745              527        385      1 512           421             -747
Net operating revenues and other income underlying       10 674               6 761      1 398             555              338        248      1 375           383             -384
EBITDA underlying                                         8 201               5 691         984            315                62       174      1 078          -140               37
Operating profit/loss (EBIT) underlying                   7 216               5 202         976            154               -36       126         951         -193               36
Operating profit/loss (EBIT) IFRS                         6 318               4 252         976            149                20       125         951         -193               38

Key financial metrics
Operating profit/loss (EBIT) margin underlying           39.8%               64.9%       13.4%         20.6%              -6.9%     32.8%       62.9%            n/a             n/a
ROACE                                                        8.3%            12.0%           n/a        1.7%              -8.1%     2.5%        6.7%             n/a             n/a
ROAE                                                         4.2%                n/a         n/a       -21.0%             0.9%          n/a     12.3%            n/a             n/a

Investments
Total investments                                         1 519                  353             3         191              640          71        200             62               -

Generation and district heating
Generation, volume sold (TWh)                                 20.6              15.9              -          1.5             1.1           -        2.2               -             -
- hydropower (TWh)                                            18.3              14.8              -          1.4                -          -        2.2               -             -
- wind power (TWh)                                               1.2                 -            -          0.1             1.1           -             -            -             -
- gas-fired power (TWh)                                          1.1             1.1              -                -            -          -             -            -             -
- biomass and solar power (TWh)                                  0.1             0.1              -          0.0             0.0           -             -            -             -
Delivered volume, district heating (TWh)                         0.5                 -            -                -            -       0.4         0.1               -             -
STATKRAFT AS GROUP – FIRST QUARTER AND INTERIM REPORT 2021                                                                              13

EUROPEAN FLEXIBLE GENERATION                                              MARKET OPERATIONS

                                               First Quarter      Year                                                First Quarter          Year
NOK million                                     2021      2020    2020    NOK million                                  2021      2020        2020

Gross operating revenues and other income       8 016    4 990   14 342   Gross operating revenues and other income   7 288    5 576     17 980
Net operating revenues and other income         6 761    4 369   11 401   Net operating revenues and other income     1 398    1 780      4 304
Operating expenses                             -1 559   -1 476   -6 407   Operating expenses                           -422     -467     -1 777
Operating profit/loss (EBIT) underlying         5 202    2 893    4 995   Operating profit/loss (EBIT) underlying       976    1 313      2 527
Unrealised value changes from                                             Unrealised value changes from
embedded EUR derivatives                         -949   2 853       339   embedded EUR derivatives                        -        -             -
Impairments/reversal of impairments                 -       -     1 708   Impairments/reversal of impairments             -        -             -
Operating profit/loss (EBIT) IFRS               4 252   5 746     7 041   Operating profit/loss (EBIT) IFRS             976    1 313         2 527
Share of profit/loss in equity                                            Share of profit/loss in equity
accounted investments                              1         4      16    accounted investments                           -        1            1

ROACE (rolling 12 months)                      12.0%    17.1%     8.3%    ROACE (rolling 12 months)                     n/a       n/a          n/a

Total investments                                353      385     1 880   Total investments                               3        2           13

Generation (TWh)                                 15.9     13.3     50.4   Generation (TWh)                                -         -            -

Key events
  In March, revision of terms for Trollheim water course                 Key events
    was concluded. The flexibility of the Trollheim power                   Statkraft has signed two 10-year long-term contracts in
    plant has been retained. Additional minimum flow                          Spain, one power purchase agreement and one power
    corresponding to 40 GWh (4% of annual generation)                         supply agreement with estimated volume of 313 GWh
    has to be released and further investment in water                        and 103 GWh per year, respectively.
    intake is required.
  Statkraft has signed a gas turbine refurbishment
    contract for Knapsack I with Siemens. The installed                   Quarterly financial performance
    capacity will increase by 80 MW and the increased                       The decrease in underlying EBIT was mainly driven by
    efficiency will reduce specific CO2 emissions and                         lower contribution from market access and trading
    reduce NOx emissions.                                                     activities, partly offset by higher contribution from
                                                                              origination activities as well as lower losses from long-
Quarterly financial performance                                               term contracts.
  The increase in net operating revenues and other
    income was driven by significantly higher Nordic power
    prices, higher Norwegian hydropower generation and
    improved unrealised value changes from certain
    embedded derivatives linked to long-term industry
    contracts. This was partly offset by decreased
    contribution from financial hedging.
  Operating expenses increased due to higher
    depreciations driven by reversal of impairments in
    previous quarters and higher property tax in Norway
    due to an increased valuation of the tax base.

Financial metrics
   ROACE was 12.0%, an increase from last quarter,
     driven by a higher underlying EBIT.

Quarterly investments
  The investments were mainly related to maintenance
    within Nordic hydropower.
STATKRAFT AS GROUP – FIRST QUARTER AND INTERIM REPORT 2021                                                                                             14

INTERNATIONAL POWER                                                             EUROPEAN WIND AND SOLAR

                                                     First Quarter      Year                                                         First Quarter          Year
NOK million                                           2021      2020    2020    NOK million                                           2021      2020        2020

Gross operating revenues and other income               745     841     2 902   Gross operating revenues and other income              527      304        767
Net operating revenues and other income                 555     685     2 314   Net operating revenues and other income                338      285        659
Operating expenses                                     -401    -552    -1 909   Operating expenses                                    -375     -292     -1 452
Operating profit/loss (EBIT) underlying                 154     133       405   Operating profit/loss (EBIT) underlying                -36       -7       -793
Gains/losses from divestments                                                   Gains/losses from divestments
of business activities                                   -        -      119    of business activities                                   -         -         0
Impairments/reversal of impairments                     -5       -6       45    Impairments/reversal of impairments                     57    -2 551    -3 126
Operating profit/loss (EBIT) IFRS                      149      127      569    Operating profit/loss (EBIT) IFRS                       20    -2 558    -3 919
Share of profit/loss in equity                                                  Share of profit/loss in equity
accounted investments                                   36       35      -539   accounted investments                                    6        7            8
Gains/losses from divestments of                                                Gains/losses from divestments of
equity accounted investments*)                            -        -        -   equity accounted investments*)                           -         -            -

ROACE (rolling 12 months)                              1.7%    2.7%      1.6%   ROACE (rolling 12 months)                            -8.1%    -0.8%         -8.3%
ROAE (rolling 12 months)                             -21.0%   -2.4%    -19.8%   ROAE (rolling 12 months)                              0.9%     0.9%          0.9%

Total investments                                      191      366     1 286   Total investments                                      640      196         4 822

Generation (TWh)                                        1.5      1.3      4.7   Generation (TWh)                                       1.1       1.4          3.9
*) Included in Interest and other financial items.                              *) Included in Interest and other financial items.

Key events                                                                      Key events
  Final investment decision has been made for the Torsa                          A share purchase agreement where Statkraft divested
    wind power project in Chile. Estimated project cost is                          the Roan wind farm was signed. See note 15.
    NOK 1.3 billion.                                                              A cooperation agreement with Aker Offshore Wind and
  Statkraft has entered into a power sales agreement with                          Aker Horizons to explore offshore wind project
    a duration of nine years and a total yearly volume of up                        opportunities in Norway was signed.
    to 50 GWh.
                                                                                Quarterly financial performance
Quarterly financial performance                                                   The decrease in underlying EBIT was mainly driven by
  The underlying EBIT increased mainly due to operational                          increased operating expenses, primarily related to
    start of the Moglice hydropower plant in Albania from                           business development activities and costs from newly
    May 2020.                                                                       acquired business. This was partly offset by higher
  The share of profit/loss in equity accounted investments                         revenues driven by increased power prices in the
    was on par with the comparable period.                                          Nordics.

Financial metrics                                                               Financial metrics
   ROACE was 1.7%, a slight increase from last quarter,                           ROACE was -8.1%, a minor improvement compared with
     mainly due to a higher underlying EBIT.                                         previous quarter.
   ROAE was -21.0%, a decrease from last quarter. The                             ROAE was 0.9%, on par with previous quarter.
     negative ROAE is mainly driven by impairments in Chile
     in the third quarter of 2020.                                              Quarterly investments
                                                                                  The investments were mainly related to development
Quarterly investments                                                               and construction of wind- and solar projects to be
  The investments were mainly related to the construction                          divested (DS/DBS), as well as grid and battery projects
    of the hydropower plants Los Lagos in Chile and Tidong                          in Ireland and UK and right-of use assets in UK.
    in India.
STATKRAFT AS GROUP – FIRST QUARTER AND INTERIM REPORT 2021                                                                                              15

DISTRICT HEATING                                                               INDUSTRIAL OWNERSHIP

                                                     First Quarter     Year                                                           First Quarter          Year
NOK million                                           2021      2020   2020    NOK million                                             2021      2020        2020

Gross operating revenues and other income              385      244     686    Gross operating revenues and other income              1 512      672      2 120
Net operating revenues and other income                248      169     488    Net operating revenues and other income                1 375      622      1 975
Operating expenses                                    -121     -117    -471    Operating expenses                                      -424     -403     -1 592
Operating profit/loss (EBIT) underlying                126       53      17    Operating profit/loss (EBIT) underlying                  951      219        382
Impairments/reversal of impairments                     -1       -1      -6    Impairments/reversal of impairments                        -        -          -
Operating profit/loss (EBIT) IFRS                      125       52      10    Operating profit/loss (EBIT) IFRS                        951      219        382
Share of profit/loss in equity                                                 Share of profit/loss in equity
accounted investments                                    -         -       -   accounted investments                                    424      690         1 472
Gains/losses from divestments of                                               Gains/losses from divestments of
equity accounted investments*)                           -         -       -   equity accounted investments*)                             -         -            -

ROACE (rolling 12 months)                            2.5%      3.8%    0.5%    ROACE (rolling 12 months)                               6.7%     7.8%      2.3%
ROAE (rolling 12 months)                               n/a       n/a     n/a   ROAE (rolling 12 months)                               12.3%    17.0%     15.4%

Total investments                                       71       38     215    Total investments                                        200      241         1 014

Delivered volume (TWh)                                 0.4       0.3    0.9    Generation (TWh)                                         2.2       1.7          6.4
*) Included in Interest and other financial items.                             *)   Included in Interest and other financial items.

Quarterly financial performance
  Underlying EBIT increased due to both higher heating                        Quarterly financial performance
    prices and delivered volume. The prices increased due                        Underlying EBIT increased to a record-high level,
    to significantly higher Norwegian power prices, while the                      mainly due to significantly higher power prices and
    volume increased due to lower temperatures.                                    higher generation.
                                                                                 Share of profit/loss in equity accounted investments
Financial metrics                                                                  decreased, mainly due to lower contribution from
   The increase in ROACE compared with the year 2020                              energy contracts in Agder Energi and BKK, partly offset
     was driven by a higher underlying EBIT. The average                           by significantly higher power prices.
     capital employed was on par.
                                                                               Financial metrics
Quarterly investments                                                             ROACE was 6.7%, an increase from previous quarter,
  The investments were primarily related to pipelines and                          driven by the increased underlying EBIT.
    modifications of existing assets in Norway.                                   ROAE was 12.3%, a decrease from previous quarter,
                                                                                    mainly due to lower share of profit from Agder Energi
                                                                                    and BKK.

                                                                               Quarterly investments
                                                                                      The investments were primarily related to grid
                                                                                          activities.
STATKRAFT AS GROUP – FIRST QUARTER AND INTERIM REPORT 2021                        16

OTHER ACTIVITIES

                                                       First Quarter      Year
NOK million                                             2021      2020    2020

Gross operating revenues and other income                421      353     1 594
Net operating revenues and other income                  383      347     1 574
Operating expenses                                      -576     -549    -2 258
Operating profit/loss (EBIT) underlying                 -193     -202      -685
Operating profit/loss (EBIT) IFRS                       -193     -202      -685
Share of profit/loss in equity
accounted investments                                    -23       -15    -123
Gains/losses from divestments of
equity accounted     investments*)                         -         -        -

Total investments                                         62       62      670

*) Included   in Interest and other financial items.

Key events
  Statkraft has signed an agreement to acquire 51% of
    the shares in Bee Charging Solutions in Sweden. See
    note 15.
  A Letter of Intent between Statkraft, Yara International
    and Aker Horizons related to large-scale ammonia
    development was signed.

Quarterly financial performance
  The underlying EBIT was stable compared to first
    quarter 2020.

Quarterly investments
  The investments were primarily related to EV charging
    businesses and investments made by Statkraft Ventures.
STATKRAFT AS GROUP – FIRST QUARTER AND INTERIM REPORT 2021                                                                        17

Outlook
The medium to long-term effects from Covid-19 on the energy markets remain uncertain. Nordic power prices in 2020 was
strongly influenced by a large hydrological surplus. The hydrological situation has now normalised, leading to a strong recovery
of Nordic power prices.

The power surplus in the Nordics is expected to increase in the coming years. Demand growth from the transport sector,
industry and data centres will likely be more than offset by an even larger growth in wind power.

Statkraft has Europe’s largest portfolio of flexible hydropower plants and reservoir capacity. The operations of the assets are
continuously optimised according to the hydrological situation and expected power prices. Statkraft has a large volume of long-
term power contracts within the segments European flexible generation and International power. The contracts have a
stabilising effect on revenues and net profit. Statkraft will continue to offer new contracts to maintain its position as a competitive
supplier to the industry in Norway.

Statkraft’s ambition is to maintain the position as the largest generator of renewable energy in Europe and a significant
player in South America and India by contributing to the energy transition through investments in renewable energy. The
investment programme has a large degree of flexibility and will be financed by retained earnings, external financing and
divestments to other investors. The strategic growth target of developing 9 GW by 2025 remains, and the acquisition of
Solarcentury has provided the company with a strong platform for growth within solar energy. Statkraft has a solid financial
foundation to deliver on the growth strategy.

Statkraft’s commitment to sustainability and responsible business practices will continue to be a foundation for all
activities. Strengthening the safety culture and performance – across the organisation and among subcontractors – remain a top
priority.

                                                           Oslo, 5 May 2021
                                                  The Board of Directors of Statkraft AS
STATKRAFT AS GROUP – FIRST QUARTER AND INTERIM REPORT 2021                                                     18

Statkraft AS Group Interim Financial Statements

                                                                                   First Quarter            The year
NOK million                                                                         2021            2020       2020

STATEMENT OF COMPREHENSIVE INCOME

PROFIT AND LOSS
Sales revenues                                                                     16 602           9 535     33 875
Gains/losses from market activities                                                   487           5 250      3 958
Other operating income                                                                110             103        685
Gross operating revenues and other income                                          17 198          14 888     38 518
Energy purchase                                                                    -6 886          -4 172    -16 060
Transmission costs                                                                   -588            -269     -1 040
Net operating revenues and other income                                             9 725          10 447     21 418
Salaries and payroll costs                                                         -1 310          -1 172     -4 627
Depreciations and amortisations                                                      -985          -1 055     -4 066
Impairments/reversal of impairments                                                   51           -2 558     -1 379
Property tax and licence fees                                                        -348            -309     -1 264
Other operating expenses                                                             -814            -967     -4 334
Operating expenses                                                                 -3 407          -6 061    -15 669
Operating profit/loss (EBIT)                                                        6 318           4 386      5 749
Share of profit/loss in equity accounted investments                                  444             722        835
Net currency effects                                                                1 361          -5 715     -1 520
Interest and other financial items                                                    150            -232       -111
Net financial items                                                                 1 511          -5 947     -1 631
Profit/loss before tax                                                              8 273            -840      4 953
Tax expense                                                                        -3 453          -1 048     -1 421
Net profit/loss                                                                     4 819          -1 888      3 532

Of which non-controlling interest                                                     154             109        213
Of which owners of the parent                                                       4 665          -1 998      3 319

OTHER COMPREHENSIVE INCOME (OCI)

Items in other comprehensive income that recycle over profit/loss:
Changes in fair value of financial instruments, net of tax                              -               -          -
Items recorded in other comprehensive income in equity accounted investments            -              11        -13
Recycling of currency translation effects related to foreign operations disposed        -               -       -132
Currency translation effects                                                       -2 760           7 601      1 092
Total                                                                              -2 760           7 612       947

Items in other comprehensive income that will not recycle over profit/loss:
Changes in fair value of financial instruments, net of tax                            -12               -           -4
Estimate deviation pension in equity acconted investments                             71             -312        -14
Estimate deviation pension, net of tax                                               330             -642       -475
Total                                                                                389             -954       -492

Other comprehensive income                                                         -2 371           6 659       456

Total comprehensive income                                                          2 448           4 771      3 988

Of which non-controlling interest                                                     136              93         29
Of which owners of the parent                                                       2 313           4 677      3 959
STATKRAFT AS GROUP – FIRST QUARTER AND INTERIM REPORT 2021                                 19

NOK million                                                  31.03.2021   31.03.2020   31.12.2020

STATEMENT OF FINANCIAL POSITION

ASSETS
Deferred tax assets                                               1 451        2 353        1 658
Intangible assets                                                4 100        4 668        4 113
Property, plant and equipment                                  110 202      113 130      112 057
Equity accounted investments                                    13 959       13 915       13 492
Derivatives                                                      7 145       12 509        7 406
Other non-current assets                                         6 422        3 367        6 338
Non-current assets                                             143 278      149 942      145 064
Inventories                                                      8 338        6 057        6 363
Receivables                                                     14 877       17 516       13 659
Financial investments                                              605        1 626          606
Derivatives                                                      6 315       14 004        4 410
Cash and cash equivalents (incl. restricted cash)               12 203       10 105       11 155
Current assets                                                  42 338       49 308       36 193
Assets                                                         185 617      199 249      181 257

EQUITY AND LIABILITIES
Paid-in capital                                                 59 219       59 219       59 219
Other reserves                                                   2 011       11 255        4 733
Retained earnings                                               34 918       30 586       29 888
Total equity attributable to owners of the parent               96 148      101 060       93 840
Non-controlling interest                                         4 317        4 348        4 189
Equity                                                         100 466      105 409       98 028
Deferred tax                                                    10 504       13 031       10 596
Pension liability                                                3 008        3 213        3 357
Interest-bearing liabilities                                    29 974       32 163       32 664
Derivatives                                                      8 384        7 857        7 778
Other non-current liabilities                                    3 062        3 146        3 207
Non-current liabilities                                         54 932       59 410       17 161
Interest-bearing liabilities                                     5 751        5 984        6 459
Taxes payable                                                    5 162        5 175        3 412
Derivatives                                                      8 316       12 724        5 639
Other interest-free liabilities                                 10 990       10 547       10 115
Current liabilities                                             30 219       34 431       25 625
Equity and liabilities                                         185 617      199 249      181 257
STATKRAFT AS GROUP – FIRST QUARTER AND INTERIM REPORT 2021                                                                                                                 20

                                                                                                              Other reserves
                                                                           profit and loss

                                                                                                                                           attributable to
                                                                                             Accumulated
                                                                           reserves and

                                                                                                                                           Total equity

                                                                                                                                                                                   Total equity
                                                                                             differences

                                                                                                                                                             controlling
                                                                                             translation

                                                                                                                                Retained
                                                                                                                                earnings

                                                                                                                                           owner of

                                                                                                                                                             interests
                                                                           reserves
                                                                           Hedging
                                                             Paid-in

                                                                           shares
                                                             capital

                                                                                                                                           parent

                                                                                                                                                             Non-
NOK million

STATEMENT OF CHANGES IN EQUITY

Balance as of 31.12.2019                                         59 219             -187       3 814        3 627              33 537          96 383          4 382       100 764

       Net profit/loss                                                 -                -             -                -       -1 998           -1 998            109           -1 888
       Total other comprehensive income                                -              11       7 617        7 628                -954            6 674             -16          6 659

Total comprehensive income for the period                              -              11       7 617        7 628              -2 951            4 677              93          4 771

Dividend                                                               -                -             -                -              -                 -        -121            -121
Business combinations/divestments                                      -                -             -                -              -                 -            -6              -6

Balance as of 31.03.2020                                         59 219             -176      11 431       11 255              30 586         101 060          4 348       105 409

Balance as of 31.12.2019                                         59 219             -187       3 814        3 627              33 537          96 383          4 382       100 764

       Net profit/loss                                                 -                -             -                -        3 319            3 319            213           3 532
       Total other comprehensive income                                -             -16       1 122        1 107                -467               640          -184             456

Total comprehensive income for the period                              -             -16       1 122        1 107               2 852            3 958              29          3 988

Dividend                                                               -                -             -                -       -6 500           -6 500           -217           -6 718
Business combinations/divestments                                      -                -             -                -            -                -             -6               -6

Balance as of 31.12.2020                                         59 219             -203       4 936        4 733              29 888          93 840          4 188        98 028

       Net profit/loss                                                 -                -             -                -        4 665            4 665            154           4 819
       Total other comprehensive income                                -             -10      -2 711       -2 721                 369           -2 352             -19          -2 371

Total comprehensive income for the period                              -             -10      -2 711       -2 721               5 034            2 313            136           2 448

Dividend                                                               -                -             -                -              -                 -          -63            -63
Capital injection from non-controlling interests                       -                -             -                -              -                 -           55             55
Transactions with non-controlling interests                            -                -             -                -            -4                 -4             1              -3

Balance as of 31.03.2021                                         59 219             -213       2 224        2 011              34 918          96 148          4 317       100 466
STATKRAFT AS GROUP – FIRST QUARTER AND INTERIM REPORT 2021                                                                                                                               21

                                                                                                                                                        First Quarter              The year

NOK million                                                                                                                                           2021            2020               2020

STATEMENT OF CASH FLOW

CASH FLOW FROM OPERATING ACTIVITIES
Operating profit/loss (EBIT)                                                                                                                         6 318               4 386           5 749
Depreciations, amortisations and impairments                                                                                                           934            3 613              5 445
Gains/losses from divestments and disposals of assets                                                                                                    2                5                -64
Unrealised effects included in operating profit/loss (EBIT)                                                                                          2 887           -4 086              1 431
Dividends from equity accounted investments                                                                                                             33               16                597
Changes in working capital 1)                                                                                                                         -734             -731              1 381
Cash collateral, margin calls and option prepayments                                                                                                -3 477           -2 604                659
Cash effects from foreign exchange derivatives related to operations                                                                                   -31             -160                -49
Effects from prepayments from customers                                                                                                                -99                -              4 733
Taxes paid                                                                                                                                          -1 555           -2 878             -8 421
Other changes                                                                                                                                         -329              -19                170
Cash flow from operating activities                                                                                             A                    3 950           -2 458             11 631

CASH FLOW FROM INVESTING ACTIVITIES
Investments in property, plant and equipment and intangible assets                                                                                  -1 125           -1 220             -7 124
Business divestments, net liquidity inflow                                                                                                               -                -                  7
Acquisitions of shares in subsidiaries, net liquidity outflow                                                                                           -8              -24             -1 308
Loans and interest related to equity accounted investments                                                                                              21               11                136
Sale of development and construction projects classified as inventories (DS/DBS)                                                                        13                -                  -
Other investments                                                                                                                                       25              -38              1 062
Cash flow from investing activities                                                                                             B                   -1 074           -1 271             -7 226

CASH FLOW FROM FINANCING ACTIVITIES
New debt                                                                                                                                                38            3 443              4 092
Repayment of debt                                                                                                                                   -1 966           -3 324             -4 759
Cash collateral related to financing                                                                                                                   241           -1 618               -266
Interests paid                                                                                                                                        -169             -225               -765
Interests received from cash and other assets                                                                                                           39              100                136
Dividend and group contribution paid to Statkraft SF                                                                                                     -                -             -6 500
Transactions with non-controlling interests                                                                                                             56                -               -218
Cash flow from financing activities                                                                                             C                   -1 761           -1 625             -8 279

Net change in cash and cash equivalents                                                                                         A+B+C                1 115           -5 354             -3 874

Currency exchange rate effects on cash and cash equivalents                                                                                             -68               256             -174

Cash and cash equivalents 01.01                                                                                                                     11 155           15 203             15 203
Cash and cash equivalents 31.03 / 31.12                                                                                                             12 203           10 105             11 155
 Of which are cash and cash equivalents in joint operations                                                                                            363              461                194

Unused commited credit lines                                                                                                                         9 167               9 187           9 194
Unused overdraft facilities                                                                                                                          2 017               1 034           2 023
Restricted cash                                                                                                                                         46                 35                 31
1) Includes
          NOK 271 million in cash outflow from investments in development and construction projects intended to divest (DS/DBS) for the first quarter of 2021. Comparable figures for
 2020 are restated by reclassifying NOK 413 million in cash outflow from investments in property, plant and equipment and intangible assets under investing activities to changes in
 working capital for operating activities. See also note 5.

                                                                                                                                                         First quarter             The year
NOK million                                                                                                                                           2021               2020            2020

Reconciliation of investments in property, plant and equipment and intangible assets

Investments in property, plant and equipment and intangible assets in the cash flow                                                                  1 125               1 220           7 537
Capitalised borrowing costs                                                                                                                             19                  33             113
Capitalised decommissioning provisions                                                                                                                  22                   -              42
Non-cash additions from right-of-use assets                                                                                                            268                  16              78
Timing differences between capitalisation and payment date                                                                                            -205                 -42            -225
Investments in property, plant and equipment and intangible assets in the Investments overview                                                       1 230               1 227           7 544
STATKRAFT AS GROUP – FIRST QUARTER AND INTERIM REPORT 2021                                                                   22

Segments
The segment reporting is based on underlying figures, which is in accordance with how the corporate management makes,
follows up and evaluates its decisions. The tables on the next page show the reconciliation of the IFRS figures versus the
underlying figures.

FIRST QUARTER 2021

The items below are excluded from the underlying figures:
1.   Gains/losses from market activities: Unrealised value changes from embedded EUR derivatives related to long-term
     industry contracts. (NOK -949 million)

2.   Other operating income: Gains from divestments of business activities that are not classified as DS/DBS.

3.   Impairments/reversal of impairments: Related to intangible assets, property, plant and equipment. (NOK 51 million)

4.   Other operating expenses: Losses from divestments of business activities that are not classified as DS/DBS.

THE YEAR 2020

The items below were excluded from the underlying figures:
1.   Gains/losses from market activities: Unrealised value changes from embedded EUR derivatives related to long-term
     industry contracts. (NOK 339 million)

2.   Other operating income: Gains from divestments of business activities that are not classified as DS/DBS. (NOK 119 millon)

3.   Impairments/reversal of impairments: Related to intangible assets, property, plant and equipment. (NOK -1379 million)

4.   Other operating expenses: Losses from divestments of business activities that are not classified as DS/DBS.
STATKRAFT AS GROUP – FIRST QUARTER AND INTERIM REPORT 2021                                                                                   23

RECONCILIATION OF IFRS FIGURES VERSUS UNDERLYING FIGURES

                                                                      First quarter 2021                          First quarter 2020
NOK million                                                   IFRS       Adjustments       Underlying     IFRS       Adjustments       Underlying

Sales revenues 1)                                            16 602                            16 602    9 535                    -         9 535
Gains/losses from market activities 1)                         487                 949          1 436    5 250              -2 853          2 396
Other operating income                                         110                    -          110       103                  -0           103
Gross operating revenues and other income                    17 198                949         18 147   14 888              -2 854         12 034
Energy purchase 1)                                           -6 886                            -6 886    -4 172                            -4 172
Transmission costs 1)                                          -588                              -588     -269                               -269
Net operating revenues and other income                       9 725                949         10 674   10 447              -2 854          7 593
Salaries and payroll costs                                   -1 310                            -1 310    -1 172                            -1 172
Depreciations and amortisations                                -985                              -985    -1 055                            -1 055
Impairments/reversal of impairments                             51                 -51              -    -2 558              2 558                -
Property tax and licence fees                                  -348                              -348     -309                               -309
Other operating expenses                                       -814                   -          -814     -967                    -          -967
Operating expenses                                           -3 407                -51         -3 458    -6 061              2 558         -3 503
Operating profit/loss (EBIT)                                  6 318                898          7 216    4 386                -295          4 090
1)   Comparable figure have been restatated, see note 5.

RECONCILIATION OF IFRS FIGURES VERSUS UNDERLYING FIGURES

                                                                                                                   The year 2020
NOK million                                                                                               IFRS       Adjustments       Underlying

Sales revenues                                                                                          33 875                             33 875
Gains/losses from market activities                                                                      3 958                -339          3 619
Other operating income                                                                                     685                -119           566
Gross operating revenues and other income                                                               38 518                -458         38 060
Energy purchase                                                                                         -16 060                           -16 060
Transmission costs                                                                                       -1 040                            -1 040
Net operating revenues and other income                                                                 21 418                -458         20 960
Salaries and payroll costs                                                                               -4 627                            -4 627
Depreciations and amortisations                                                                          -4 066                            -4 066
Impairments/reversal of impairments                                                                      -1 379              1 379                -
Property tax and licence fees                                                                            -1 264                            -1 264
Other operating expenses                                                                                 -4 334                   -        -4 334
Operating expenses                                                                                      -15 669              1 379        -14 290
Operating profit/loss (EBIT)                                                                             5 749                 922          6 670
STATKRAFT AS GROUP – FIRST QUARTER AND INTERIM REPORT 2021                                                                                                                                                                                24

                                                                                                                                                                                             Industrial ownership
                                                                                                                              International power
                                                                   Statkraft AS Group

                                                                                         European flexible

                                                                                                                                                                       District heating

                                                                                                                                                                                                                       Other activities
                                                                                                                                                     European wind

                                                                                                                                                                                                                                                Group items
                                                                                         generation

                                                                                                              operations

                                                                                                                                                     and solar
                                                                                                              Market
NOK million

SEGMENTS

First quarter 2021
Gross operating revenues and other income, external             18 147                   7 881                7 454          730                        141           385                  1 486                      106                       -36
Gross operating revenues and other income, internal                            -             135               -166           15                        386                       -          26                       315                      -711
Gross operating revenues and other income underlying            18 147                   8 016                7 288          745                        527           385                  1 512                      421                      -747
Net operating revenues and other income underlying              10 674                   6 761                1 398          555                        338           248                  1 375                      383                      -384
Operating profit/loss (EBIT) underlying                          7 216                   5 202                  976          154                         -36          126                   951                       -193                      36
Unrealised value changes from embedded EUR derivatives            -949                    -949                        -                    -                    -                 -                        -                      -                    -
Gains/losses from divestments of business activities                           -                       -              -                    -                    -                 -                        -                      -                    -
Impairments/reversal of impairments                                51                                  -              -          -5                        57             -1                               -                      -                    -
Operating profit/loss (EBIT) IFRS                                6 318                   4 252                  976          149                           20         125                   951                       -193                      36
Share of profit/loss in equity accounted investments              444                                1                -       36                              6                   -         424                        -23                             -

Assets and capital employed 31.03.2021
Property, plant and equipment and intangible assets            114 301                  59 917                  140        22 878                    9 303           3 543                16 820                     1 700                             -
Equity accounted investments                                    13 959                               1                -     2 255                       832                       -       10 794                      104                       -28
Loans to equity accounted investments                            1 443                                 -              -      957                        445                       -          41                                   -                    -
Inventories - development and construction projects (DS/DBS)     2 489                                 -              -                    -         2 489                        -                        -                      -                    -
Other assets                                                    53 426                   2 302               20 397         1 989                       605           264                  1 378                    27 147                     -657
Total assets                                                   185 617                  62 220               20 537        28 079                   13 674           3 806                29 033                    28 953                     -685
Capital employed                                               116 790                  59 917                  140        22 878                   11 792           3 543                16 820                     1 700                        -
                                                                                                                                                                                                                                                    1
Average capital employed (rolling 12 months)                   117 926                  60 883                  165        24 876                   10 161           3 536                16 597                     1 708                      n/a 1
                                                                                                                                                                                                                                                    6
Return on average capital employed (ROACE)                       8.3%                   12.0%                    n/a        1.7%                    -8.1%            2.5%                  6.7%                        n/a                      n/a #
                                                                                                                                                                                                                                                    7
                                                                                                                                                                                                                                                    R
Return on average equity accounted investments (ROAE)            4.2%                          n/a               n/a       -21.0%                    0.9%              n/a                12.3%                        n/a                      n/a 9
                                                                                                                                                                                                                                                    E
                                                                                                                                                                                                                                                    0
                                                                                                                                                                                                                                                    F
Depreciations, amortisations and impairments                      -934                    -489                      -8       -166                        -41           -49                  -128                       -53                             - !

Total investments                                                1 519                       353                     3       191                        640            71                   200                        62                              -
STATKRAFT AS GROUP – FIRST QUARTER AND INTERIM REPORT 2021                                                                                                                                                                                 25

                                                                                                                                                                                             Industrial ownership
                                                                                                                              International power
                                                                   Statkraft AS Group

                                                                                         European flexible

                                                                                                                                                                       District heating

                                                                                                                                                                                                                       Other activities
                                                                                                                                                     European wind

                                                                                                                                                                                                                                             Group items
                                                                                         generation

                                                                                                              operations

                                                                                                                                                     and solar
                                                                                                              Market
NOK million

SEGMENTS

First quarter 2020
Gross operating revenues and other income, external             12 034                   4 864                5 584          820                           90         244                   664                        91                  -323
Gross operating revenues and other income, internal                            -             126                    -8        21                        214                       -                    8              262                  -623
Gross operating revenues and other income underlying            12 034                   4 990                5 576          841                        304           244                   672                       353                  -946
Net operating revenues and other income underlying               7 593                   4 369                1 780          685                        285           169                   622                       347                  -665
Operating profit/loss (EBIT) underlying                          4 090                   2 893                1 313          133                            -7         53                   219                       -202                 -312
Unrealised value changes from embedded EUR derivatives           2 853                   2 853                        -                    -                    -                 -                        -                      -                 -
Gains/losses from divestments of business activities                           -                       -              -                    -                    -                 -                        -                      -                 -
Impairments/reversal of impairments                             -2 558                                 -              -          -6                 -2 551                -1                               -                      -                 -
Operating profit/loss (EBIT) IFRS                                4 386                   5 746                1 313          127                    -2 558             52                   219                       -202                 -312
Share of profit/loss in equity accounted investments              722                                4               1        35                              7                   -         690                        -15                          -

Assets and capital employed 31.03.2020
Property, plant and equipment and intangible assets            117 798                  60 251                  191        27 561                    8 188           3 527                16 364                     1 718                          -
Equity accounted investments                                    13 915                               5             10       3 156                       967                       -        9 760                       43                   -26
Loans to equity accounted investments                            1 781                                 -              -     1 154                       585                       -          42                                   -                 -
Inventories - development and construction projects (DS/DBS)                   -                       -              -                    -                    -                 -                        -                      -                 -
Other assets                                                    65 755                   7 537               31 035         1 607                       451           234                  1 398                    25 889                -2 395
Total assets                                                   199 249                  67 793               31 235        33 478                   10 190           3 761                27 563                    27 649                -2 421
Capital employed                                               117 798                  60 251                  191        27 561                    8 188           3 527                16 364                     1 718                          -
Average capital employed (rolling 12 months)                   112 765                  57 562                   n/a       25 165                    8 871           3 471                16 071                       n/a                   n/a

Return on average capital employed (ROACE)                      12.5%                   17.1%                    n/a        2.7%                    -0.8%            3.8%                  7.8%                        n/a                   n/a
Return on average equity accounted investments (ROAE)           11.2%                          n/a               n/a        -2.4%                    0.9%              n/a                17.0%                        n/a                   n/a

Depreciations, amortisations and impairments                    -3 613                    -465                      -9       -264                   -2 656             -46                  -127                       -47                          -
Total investments                                                1 289                       385                     2       366                        196            38                   241                        62                           -

The year 2020
Gross operating revenues and other income, external             38 060                  13 983               18 491         2 878                       278           684                  2 087                      363                  -704
Gross operating revenues and other income, internal                            -             359               -511           24                        489                    2             33                      1 231                -1 627
Gross operating revenues and other income underlying            38 060                  14 342               17 980         2 902                       767           686                  2 120                     1 594                -2 331
Net operating revenues and other income underlying              20 960                  11 401                4 304         2 314                       659           488                  1 975                     1 574                -1 754
Operating profit/loss (EBIT) underlying                          6 670                   4 995                2 527          405                      -793             17                   382                       -685                 -178
Unrealised value changes embedded EUR derivatives                 339                        339                      -                    -                    -                 -                        -                      -                 -
Gains/losses from divestments of business activities              119                                  -              -      119                                -                 -                        -                      -                 -
Impairments/reversal of impairments                             -1 379                   1 708                        -       45                    -3 126                -6                               -                      -                 -
Operating profit/loss (EBIT) IFRS                                5 749                   7 041                2 527          569                    -3 919             10                   382                       -685                 -178
Share of profit/loss in equity accounted investments              835                            16                  1       -539                             8                   -        1 472                      -123                          -

Assets and capital employed 31.12.2020
Property, plant and equipment and intangible assets            116 170                  61 446                  156        23 387                    9 168           3 559                16 752                     1 704                          -
Equity accounted investments                                    13 492                                 -              -     2 247                       839                       -       10 297                      135                   -26
Loans to equity accounted investments                            1 442                                 -              -      962                        439                       -          41                                   -                 -
Inventories - development and construction projects (DS/DBS)     2 483                                 -              -                    -         2 483                        -                        -                      -                 -
Other assets                                                    47 669                   2 520               16 193         2 039                       711           223                  1 279                    24 606                   97
Total assets                                                   181 257                  63 966               16 349        28 635                   13 641           3 782                28 369                    26 445                   71
Capital employed                                               118 653                  61 446                  156        23 387                   11 651           3 559                16 752                     1 704                          -
Average capital employed (last four quarters)                  117 531                  60 495                   n/a       25 872                    9 505           3 524                16 477                       n/a                   n/a

Return on average capital employed (ROACE)                       5.7%                    8.3%                    n/a        1.6%                    -8.3%            0.5%                  2.3%                        n/a                   n/a
Return on average equity accounted investments (ROAE)            6.3%                          n/a               n/a       -19.8%                    0.9%              n/a                15.4%                        n/a                   n/a

Depreciations, amortisations and impairments                    -5 445                    -235                   -34         -794                   -3 477            -193                  -503                      -207                          -

Total investments                                                9 901                   1 880                     13       1 286                    4 822            215                  1 014                      670                           -
You can also read