ATCO LTD. MANAGEMENT'S DISCUSSION AND ANALYSIS
←
→
Page content transcription
If your browser does not render page correctly, please read the page content below
ATCO LTD.
          MANAGEMENT’S DISCUSSION AND
                  ANALYSIS
                                    FOR THE THREE MONTHS ENDED MARCH 31, 2021

This Management's Discussion and Analysis (MD&A) is meant to help readers understand key operational and financial events
that influenced the results of ATCO Ltd. (ATCO, our, we, us, or the Company) during the three months ended March 31, 2021.

This MD&A was prepared as of April 28, 2021, and should be read with the Company's unaudited interim consolidated financial
statements for the three months ended March 31, 2021. Additional information, including the Company's previous MD&A (2020
MD&A), Annual Information Form (2020 AIF), and audited consolidated financial statements for the year ended December 31,
2020, is available on SEDAR at www.sedar.com. Information contained in the 2020 MD&A is not discussed in this MD&A if it
remains substantially unchanged.

The Company is controlled by Sentgraf Enterprises Ltd. and its controlling share owner, the Southern family. The Company
includes controlling positions in Canadian Utilities Limited (Canadian Utilities or CU) (52.7 per cent ownership), ATCO Structures &
Logistics Ltd. (100 per cent ownership), ATCO Land and Development Ltd. (100 per cent ownership), and ASHCOR Technologies
Ltd. (100 per cent ownership). The Company also has a non-controlling equity investment in Neltume Ports S.A. (Neltume Ports)
(40 per cent ownership). Throughout this MD&A, the Company's earnings attributable to Class I and Class II Shares and adjusted
earnings are presented after non-controlling interests.

Terms used throughout this MD&A are defined in the Glossary at the end of this document.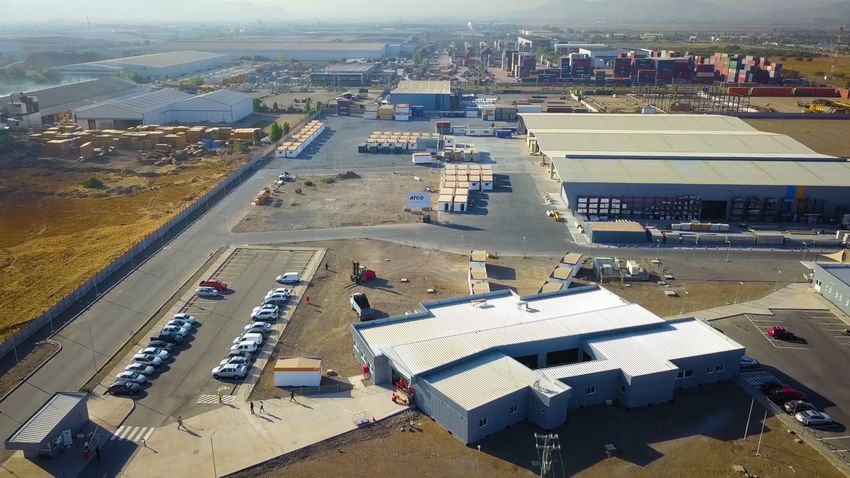
TABLE OF CONTENTS
                                                                                                                                                                                               Page
    Performance Overview....................................................................................................................................................                     2
    Business Unit Performance.............................................................................................................................................                       5
      Structures & Logistics....................................................................................................................................................                 5
      Neltume Ports................................................................................................................................................................              8
      ATCO Corporate & Other..............................................................................................................................................                       9
      Canadian Utilities...........................................................................................................................................................             10
             Utilities .....................................................................................................................................................................    10
                Utilities Regulatory Developments...................................................................................................................                            11
             Energy Infrastructure.............................................................................................................................................                 12
             Canadian Utilities Corporate & Other..................................................................................................................                             13
    Other Expenses and Income...........................................................................................................................................                        14
    Liquidity and Capital Resources.....................................................................................................................................                        16
    Share Capital.....................................................................................................................................................................          18
    Quarterly Information......................................................................................................................................................                 19
    Non-GAAP and Additional GAAP Measures..................................................................................................................                                     21
    Reconciliation of Adjusted Earnings to Earnings Attributable to Class I and Class II Shares..................................                                                               22
    Reconciliation of Funds Generated by Operations to Cash Flows from Operating Activities.................................                                                                    25
    Reconciliation of Capital Investment to Capital Expenditures....................................................................................                                            26
    Other Financial Information ...........................................................................................................................................                     27
    Glossary.............................................................................................................................................................................       28

1       ATCO LTD. 2021 MANAGEMENT'S DISCUSSION & ANALYSIS
PERFORMANCE OVERVIEW
FINANCIAL METRICS
The following chart summarizes key financial metrics associated with our financial performance.

                                                                                                                                Three Months Ended
                                                                                                                                          March 31

($ millions, except per share data and outstanding shares)                                                         2021              2020   Change

Key Financial Metrics
Revenues                                                                                                        1,072           1,056          16
                         (1)
Adjusted earnings                                                                                                  119               106       13
    Structures & Logistics                                                                                          14                 7        7
    Neltume Ports                                                                                                     3                3       —
    ATCO Corporate & Other                                                                                            1                1       —
    Canadian Utilities Limited
         Utilities                                                                                                 106                99        7
         Energy Infrastructure                                                                                        5                3        2
         Canadian Utilities Corporate & Other                                                                      (10)               (7)       (3)
                                           (1)
Adjusted earnings ($ per share)                                                                                   1.04           0.93        0.11
Earnings attributable to Class I and Class II Shares                                                                83                87        (4)
Earnings attributable to Class I and Class II Shares ($ per share)                                                0.73           0.76        (0.03)
Cash dividends declared per Class I and Class II Share (cents per share)                                        44.83           43.52        1.31
                                           (1)
Funds generated by operations                                                                                      491               516      (25)
                          (1)
Capital investment                                                                                                 253               303      (50)
Other Financial Metrics
Weighted average Class I and Class II Shares outstanding (thousands):
   Basic                                                                                                     114,302        114,352           (50)
   Diluted                                                                                                   114,551        114,732          (181)
(1) Additional information regarding these measures is provided in the Non-GAAP and Additional GAAP Measures section of this MD&A.

REVENUES
Revenues for the first quarter of 2021 were $1,072 million, $16 million higher than the same period in 2020. Higher
revenues were mainly due to improved performance at ATCOenergy resulting from higher electricity and natural
gas commodity prices and customer growth.

ADJUSTED EARNINGS
Our adjusted earnings in the first quarter of 2021 were $119 million or $1.04 per share, compared to $106 million or
$0.93 per share for the same period in 2020.
The primary drivers of adjusted earnings results were as follows:
     •     Structures and Logistics adjusted earnings in the first quarter of 2021 were $7 million higher than the same
           period in 2020. Higher earnings were mainly due to ATCO Structures' workforce housing trade sale and
           rental activity, higher space rental activity, and additional ATCO Frontec client work requests at the BC
           Hydro Site C Camp due to COVID-19 proactive and preventative safety measures.
     •     Canadian Utilities adjusted earnings in the first quarter of 2021 were $6 million higher than the same
           period in 2020. Higher earnings were mainly due to cost efficiencies and growth in the Utilities' rate base,
           earnings from International Electricity Operations, as well as demand for natural gas storage services and
           recovered business development costs in Energy Infrastructure.

                                                                               ATCO LTD. 2021 MANAGEMENT'S DISCUSSION & ANALYSIS                      2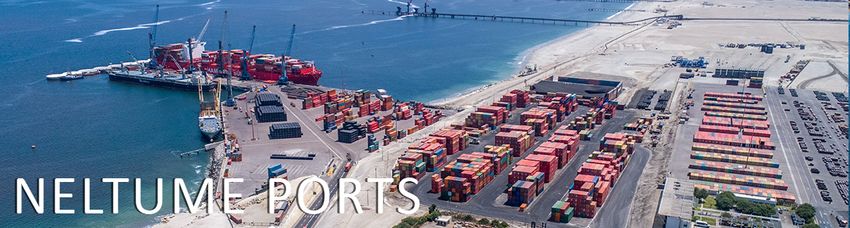
Adjusted Earnings ($ Millions)

                                                                                      $6               $119
                                $7               $—                $—
             $106

           Q1 2020        Structures &        Neltume            ATCO            Canadian            Q1 2021
                            Logistics          Ports          Corporate &         Utilities
                                                                 Other

    Additional detail on the financial performance of our business units is discussed in the Business Unit Performance
    section of this MD&A.

    EARNINGS ATTRIBUTABLE TO CLASS I AND CLASS II SHARES
    Earnings attributable to Class I and Class II Shares were $83 million in 2021, $4 million lower compared to 2020.
    Earnings attributable to Class I and Class II Shares include timing adjustments related to rate-regulated activities,
    unrealized gains or losses on mark-to-market forward and swap commodity contracts, one-time gains and losses,
    significant impairments, and items that are not in the normal course of business or a result of day-to-day
    operations. These items are not included in adjusted earnings.
    In the fourth quarter of 2020 and first quarter of 2021, Canadian Utilities signed Master Services Agreements (MSA)
    with IBM Canada Ltd. and IBM Australia Limited (IBM), respectively, to provide managed information technology (IT)
    services. These services are currently provided by Wipro Ltd. (Wipro) under a ten-year MSA expiring in December
    2024. For the three months ended March 31, 2021, ATCO recognized $6 million (after-tax and non-controlling
    interests) in termination and transition costs. As these costs are not in the normal course of business, they have
    been excluded from Adjusted Earnings.
    More information on these and other items is included in the Reconciliation of Adjusted Earnings to Earnings
    Attributable to Class I and Class II Shares section of this MD&A.

    FUNDS GENERATED BY OPERATIONS
    Funds generated by operations were $491 million in the first quarter of 2021, $25 million lower than the same
    period in 2020. The decrease was mainly due to the timing of certain revenues and expenses. Lower funds
    generated by operations were partially offset by higher customer contributions for Canadian Utilities' Electricity
    Transmission capital expenditures.

3      ATCO LTD. 2021 MANAGEMENT'S DISCUSSION & ANALYSIS
COMMON SHARE DIVIDENDS
Dividends paid to Class I and Class II share owners totaled $51 million in the first quarter of 2021. On April 14, 2021,
the Board of Directors declared a second quarter dividend of 44.83 cents per share.
We have increased our common share dividend each year since 1993.

                                       Quarterly Dividend Rate 1993 - 2021
                                               (dollars per share)

                                                                                                              $0.4483

   93 94 95 96 97 98 99 00 01 02 03 04 05 06 07 08 09 10 11 12 13 14 15 16 17 18 19 20 21

CAPITAL INVESTMENT
Total capital investment of $253 million in the first
                                                                              Capital Investment for the
quarter of 2021 was $50 million lower compared to the                     Three Months Ended March 31, 2021
same period in 2020 mainly due to lower investment in
ATCO Structures' rental fleet and the timing of capital
investment in the Utilities.
Capital spending in Canadian Utilities' Regulated Utilities
accounted for 87 per cent of total capital invested in the                                                        13%
first quarter of 2021. The remaining 13 per cent invested
in the first quarter of 2021 included continued
                                                                    87%
expansion of ATCO Structures' space rental fleet and
construction of Storage & Industrial Water's long-term
contracted hydrocarbon storage cavern in Fort
Saskatchewan, Alberta.
                                                                                  Regulated Utilities
                                                                                  ATCO Structures & Other

                                                               ATCO LTD. 2021 MANAGEMENT'S DISCUSSION & ANALYSIS           4
BUSINESS UNIT PERFORMANCE
REVENUES
Structures & Logistics revenues of $167 million in the first quarter of 2021 were $4 million lower than the same
period in 2020 mainly due to the completion of manufacturing work on ATCO Structures' LNG Canada Cedar Valley
Lodge project in the second quarter of 2020, partially offset by ATCO Structures' workforce housing trade sale
activity in the US and higher space rental activity in Australia and Canada.
ADJUSTED EARNINGS
Three Months Ended
March 31
($ millions) 2021 2020 Change
ATCO Structures 13 7 6
ATCO Frontec 1 — 1
Total Structures & Logistics 14 7 7
Structures & Logistics recorded adjusted earnings of $14 million in the first quarter of 2021, $7 million higher
compared to the same period in 2020. Higher earnings were mainly due to ATCO Structures' workforce housing
trade sale activity in Canada and the US, workforce housing rental activity in Canada, higher space rental activity in
Canada and Australia, and additional ATCO Frontec client work requests at the BC Hydro Site C Camp due to
COVID-19 proactive and preventative safety measures.
Detailed information about the activities and financial results of the Structures & Logistics businesses is provided in
the following sections.
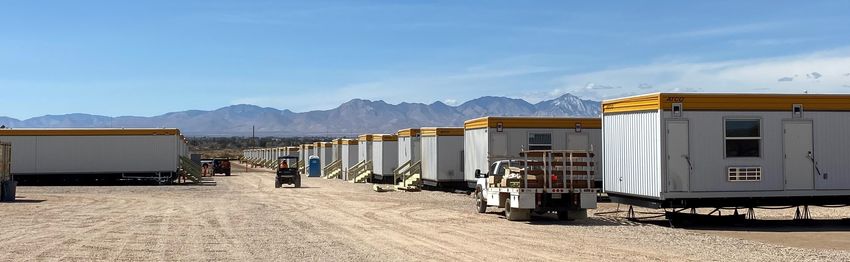
ATCO STRUCTURES
ATCO Structures manufactures, sells and leases transportable workforce housing, residential housing and space
rental products. Space rentals sells and leases mobile office trailers in various sizes and floor plans to suit our
customers’ needs. Workforce housing delivers modular workforce housing worldwide, including short-term and
permanent modular construction, pre-fabricated and relocatable modular buildings.
ATCO Structures recorded adjusted earnings of $13 million in the first quarter of 2021, $6 million higher than the
same period in 2020 mainly due to workforce housing trade sale activity in Canada and the US, workforce housing
rental activity in Canada, and higher space rental activity in Canada and Australia. Higher earnings were partially
offset by lower activity on the LNG Canada Cedar Valley Lodge project with the transition from manufacturing to
installation work in the second quarter of 2020.
5 ATCO LTD. 2021 MANAGEMENT'S DISCUSSION & ANALYSISThe following table compares ATCO Structures' manufacturing hours and rental fleet for the first quarter of 2021
and 2020.
Three Months Ended
March 31
2021 2020 Change
North America
Manufacturing hours (thousands) 120 350 (66%)
Global Space Rentals
Number of units 18,927 16,669 14%
Average utilization (%) 79 71 8%
Average rental rate ($ per month) 582 551 6%
Global Workforce Housing
Number of units 2,552 2,894 (12%)
Average utilization (%) 60 45 15%
Average rental rate ($ per month) 1,862 1,646 13%
Manufacturing Hours
The decrease in manufacturing hours in the first quarter of 2021 was mainly due to the completion of
manufacturing on the LNG Canada Cedar Valley Lodge project in the second quarter of 2020.
Rental Fleet
Global Space Rentals
ATCO Structures increased its global space rental fleet size by 2,258 units year-over-year. The increase in the
number of space rental units was mainly due to the acquisition of the remaining 50 per cent interest in the ATCO
Sabinco S.A. joint venture partnership on December 30, 2020, and the continued strategic expansion of the space
rental fleet in targeted regions of Canada and the US. In the first quarter of 2021, space rental demand increased in
Canada, Australia, the US and Chile mainly due to increased activity in the construction and mining sectors, as well
as physical distancing protocols implemented in response to the COVID-19 pandemic. This increase in demand also
produced an increase in the utilization and average rental rates.
Global Workforce Housing
ATCO Structures decreased the size of its workforce housing fleet and increased the average utilization rate year-
over-year by selling used and non-utilized fleet assets in the US, Canada and Australia. The increase in the utilization
rate was also due to workforce housing fleet on rent for the Trans Mountain Expansion project in British Columbia
(BC). Workforce housing average rental rates have reflected higher demand compared to the prior year as a result
of the conversion of 44-person dorms with shared ensuites to 36-person dorms with private ensuites in Canada.
ATCO Sabinco S.A., Chile
ATCO LTD. 2021 MANAGEMENT'S DISCUSSION & ANALYSIS 6ATCO STRUCTURES RECENT DEVELOPMENTS
Canada
Brucejack - Pretium Exploration Inc.
ATCO Structures was awarded a contract for the supply of a 450-person camp for Pretium Exploration Inc.’s
Brucejack operations in Northwest BC. The $44 million contract includes the supply of accommodation dorms with
complete kitchen and recreation amenities. Detailed engineering work has commenced with manufacturing and site
work expected to begin in the second quarter of 2021. Installation work is expected to be complete by the end of
2021.
United States
China Lake Military Rebuild - Environmental Chemical Corporation
During the first quarter of 2021, ATCO Structures completed installation on a 450-person camp that had been
previously awarded on a $12 million rental contract for 31 months. The project will support the rebuild and
expansion of the China Lake Military Base in Southern California. The military base was damaged by two major
earthquakes in July 2019.
China Lake Military Rebuild, Southern California, US
ATCO FRONTEC
Frontec provides facility operations and maintenance services, workforce lodging and support services, defense
operations services, and disaster and emergency management services.
ATCO Frontec's adjusted earnings of $1 million in the first quarter of 2021 were $1 million higher than the same
period in 2020 mainly due to additional client work requests at the BC Hydro Site C camp resulting from COVID-19
proactive and preventative safety measures.
ATCO FRONTEC RECENT DEVELOPMENTS
In the fourth quarter of 2020, ATCO Frontec was awarded a 31-month workforce lodging services contract for
approximately 450 persons to support the phase I rebuild of the China Lake Military Base. On March 1, 2021,
operations work commenced.
7 ATCO LTD. 2021 MANAGEMENT'S DISCUSSION & ANALYSISNeltume Ports is a port operator and developer with a diversified portfolio of 16 multi-purpose, bulk cargo and
container port facilities and three port operation services. The business is located primarily in Chile with additional
operations in Uruguay, Argentina, and Brazil.
ADJUSTED EARNINGS
Three Months Ended
March 31
($ millions) 2021 2020 Change
Neltume Ports 3 3 —
Neltume Ports adjusted earnings of $3 million in the first quarter of 2021 were comparable to the the same period
in 2020.
ATCO LTD. 2021 MANAGEMENT'S DISCUSSION & ANALYSIS 8ATCO Corporate & Other contains ATCO Land and Development Ltd. which is a commercial real estate business that
holds investments for sale, lease or development, as well as ASHCOR, a company engaged in the processing and
marketing of ash, a waste byproduct of electricity generation. ATCO Corporate & Other also includes the global
corporate head office in Calgary, Canada, ATCO licensing fees received, and financing expenses associated with the
Neltume Ports investment.
ADJUSTED EARNINGS
Three Months Ended
March 31
($ millions) 2021 2020 Change
ATCO Corporate & Other 1 1 —
ATCO Corporate & Other adjusted earnings in 2021 were comparable to the same period in 2020.
9 ATCO LTD. 2021 MANAGEMENT'S DISCUSSION & ANALYSISCanadian Utilities is a diversified global energy infrastructure corporation delivering service excellence and
innovative business solutions in Utilities (Electricity and Natural Gas Transmission and Distribution, and
International Electricity Operations); Energy Infrastructure (Electricity Generation, Energy Storage, and Industrial
Water Solutions); and Retail Energy (Electricity and Natural Gas Retail Sales).
UTILITIES
REVENUES
Utilities revenues of $790 million in the first quarter of 2021 were comparable to the same period in 2020.
Revenue growth for Electricity and Natural Gas Distribution in the first quarter of 2021 has been deferred to be
collected in a future period as a result of our decision to provide rate relief to customers in light of the current
COVID-19 global pandemic and economic situation in Alberta.
ADJUSTED EARNINGS
Three Months Ended
March 31
($ millions) 2021 2020 Change
Electricity
Electricity Distribution 22 18 4
Electricity Transmission 23 23 —
International Electricity Operations 3 — 3
Total Electricity 48 41 7
Natural Gas
Natural Gas Distribution 42 43 (1)
Natural Gas Transmission 10 11 (1)
International Natural Gas Distribution 6 4 2
Total Natural Gas 58 58 —
Total Utilities Adjusted Earnings 106 99 7
Utilities adjusted earnings of $106 million in the first quarter of 2021 were $7 million higher than the same period in
2020. Higher earnings were mainly due to cost efficiencies and continued growth in the regulated rate base,
earnings from International Electricity Operations, and favourable inflation rate and foreign exchange adjustments
in International Natural Gas Distribution.
Detailed information about the activities and financial results of the Utilities business segments is provided in the
following sections.
Electricity Distribution
Electricity Distribution provides regulated electricity distribution and distributed generation mainly in northern and
central east Alberta, the Yukon, the Northwest Territories and in the Lloydminster area of Saskatchewan.
ATCO LTD. 2021 MANAGEMENT'S DISCUSSION & ANALYSIS 10Electricity Distribution adjusted earnings of $22 million in the first quarter of 2021 were $4 million higher compared to the same period in 2020. Higher earnings were mainly due to cost efficiencies and continued growth in rate base. Electricity Transmission Electricity Transmission provides regulated electricity transmission mainly in Northern and Central East Alberta, and in the Lloydminster area of Saskatchewan. Electricity Transmission has a 35-year contract to be the operator of Alberta PowerLine, a 500-km electricity transmission line between Wabamun, near Edmonton and Fort McMurray, Alberta. Electricity Transmission adjusted earnings of $23 million in the first quarter of 2021 were comparable to the same period in 2020. International Electricity Operations International Electricity Operations includes Canadian Utilities' 50 per cent ownership in LUMA Energy, a company formed to transform, modernize and operate Puerto Rico's 30,000-km electricity transmission and distribution system under an Operations and Maintenance Agreement with the Puerto Rico Public-Private Partnerships Authority for a 15-year term after a one-year transition period which commenced on June 22, 2020. International Electricity Operations adjusted earnings in the first quarter of 2021 were $3 million due to continued operations and maintenance transition work. Natural Gas Distribution Natural Gas Distribution serves municipal, residential, commercial and industrial customers throughout Alberta and in the Lloydminster area of Saskatchewan. Natural Gas Distribution adjusted earnings of $42 million in the first quarter of 2021 were $1 million lower than the same period in 2020. Lower earnings were mainly due to the timing of operating costs, partially offset by growth in rate base. Natural Gas Transmission Natural Gas Transmission receives natural gas on its pipeline system from various gas processing plants as well as from other natural gas transmission systems and transports it to end users within the province of Alberta or to other pipeline systems. Natural Gas Transmission adjusted earnings of $10 million in the first quarter of 2021 were $1 million lower than the same period in 2020. Lower adjusted earnings were mainly due to the impact of the 2021-2023 General Rate Application decision which included operating cost efficiencies implemented in prior periods that are being passed on to customers. International Natural Gas Distribution International Natural Gas Distribution is a regulated provider of natural gas distribution services in Western Australia, serving metropolitan Perth and surrounding regions. International Natural Gas Distribution adjusted earnings of $6 million in the first quarter of 2021 were $2 million higher compared to the same period in 2020. Higher earnings were mainly due to an adjustment for the impact of the forecasted inflation rate and favourable foreign exchange movements. UTILITIES REGULATORY DEVELOPMENTS COMMON MATTERS 2021 Rate Relief Application In December 2020, the AUC approved Electric Distribution and Natural Gas Distribution requests to defer rate increases which would normally have come into effect on January 1, 2021. The AUC directed Electricity Distribution and Natural Gas Distribution to file an application outlining the duration of the rate freeze and collection timeline. 11 ATCO LTD. 2021 MANAGEMENT'S DISCUSSION & ANALYSIS
On March 1, 2021, ATCO filed a 2021 Rate Relief Application for Electricity Distribution and Natural Gas Distribution
to postpone rate increases for the full year 2021 and collect the deferred amounts commencing in 2023 for no more
than a 5-year period. This application aligns with our long-standing practice of supporting the communities we have
the privilege to serve. The current economic situation in Alberta, including hardships faced by customers due to the
COVID-19 pandemic, is the rationale for the rate freeze.

Distribution Regulatory Framework - Post 2022
On March 1, 2021, the AUC initiated a process to set revenues and rates for Electricity Distribution and Natural Gas
Distribution for 2023 as well as a process to evaluate the merits of PBR to date. These processes will address how a
one-year cost-of-service study for 2023 will be undertaken as well as a proceeding to determine the regulatory
framework for Alberta distribution utilities going forward.

Generic Cost of Capital (GCOC)
On March 4, 2021, the AUC issued a decision on the 2022 GCOC proceeding. The Commission approved the
extension of the current return on equity of 8.5 per cent and equity thickness ratio of 37 per cent on a final basis for
the 2022 period.

ELECTRICITY TRANSMISSION

2020-2022 General Tariff Application (GTA)
In October 2019, Electricity Transmission filed a GTA for its operations for 2020, 2021, and 2022. The decision was
received in March 2021 approving the vast majority of requested capital expenditures and operating costs as filed.

NATURAL GAS TRANSMISSION

Natural Gas Transmission 2021-2023 General Rate Application (GRA)
In June 2020, Natural Gas Transmission filed a GRA for the period 2021-2023. The decision was received in March
2021, approving the vast majority of requested capital expenditures and operating costs as filed, which included
operating cost efficiencies implemented in prior periods that are being passed on to customers. The decision also
approved a placeholder treatment for the Pioneer Pipeline acquisition pending a decision from the AUC on the
acquisition proceeding. A decision is expected in the second quarter of 2021.

ENERGY INFRASTRUCTURE
REVENUES
Energy Infrastructure revenues of $52 million in the first quarter of 2021 were $2 million higher than the same
period in 2020 mainly due to demand for natural gas storage services.

ADJUSTED EARNINGS

                                                                                                     Three Months Ended
                                                                                                               March 31
($ millions)                                                                                  2021       2020    Change

Electricity Generation                                                                          3          2           1
Storage & Industrial Water                                                                      2          1           1
Total Energy Infrastructure Adjusted Earnings                                                   5          3           2

Energy Infrastructure adjusted earnings of $5 million in the first quarter of 2021 were $2 million higher than the
same period in 2020 mainly due to demand for natural gas storage services and recovered business development
costs.
Detailed information about the activities and financial results of Energy Infrastructure's businesses is provided in
the following sections.
                                                               ATCO LTD. 2021 MANAGEMENT'S DISCUSSION & ANALYSIS       12
Electricity Generation
Non-regulated electricity activities supply electricity from hydroelectric, solar and natural gas generating plants in
Western Canada, Australia, Mexico and Chile and non-regulated electricity transmission in Alberta.
Electricity Generation adjusted earnings of $3 million in the first quarter of 2021 were $1 million higher than the
same period in 2020. Higher earnings were mainly due to recovered business development costs, lower costs of
repairs and maintenance at the Karratha Power Station compared to the prior year, and favourable movements in
the Australian foreign exchange rate.
Storage & Industrial Water
Storage & Industrial Water provides non-regulated natural gas storage and transmission activities, NGL storage, and
industrial water services in Alberta and the Northwest Territories.
Storage & Industrial Water adjusted earnings of $2 million in the first quarter of 2021 were $1 million higher than
the same period in 2020. Higher earnings were mainly due to demand for natural gas storage services.
ENERGY INFRASTRUCTURE RECENT DEVELOPMENTS
Central West Pumped Storage Hydro Project
On February 1, 2021, ATCO announced an agreement to acquire the rights to develop the 325-MW Central West
Pumped Storage Hydro project, located approximately 175 km west of Sydney, Australia. The acquisition marks
ATCO's first renewable energy investment on Australia’s east coast. The project is in close proximity to significant
renewable energy resources and will be integral in supporting the development of new renewable generation
capacity in the state of New South Wales. A final investment decision on project construction is expected in 2023.
CANADIAN UTILITIES CORPORATE & OTHER
Canadian Utilities' Corporate & Other segment includes Retail Energy through ATCOenergy which provides retail
electricity and natural gas services in Alberta. Corporate & Other also includes the global corporate head office in
Calgary, Canada, the Australia corporate head office in Perth, Australia and the Mexico corporate head office in
Mexico City, Mexico. In addition, Canadian Utilities Corporate & Other includes CU Inc. and Canadian Utilities
preferred share dividend and debt expenses.
ADJUSTED EARNINGS
Three Months Ended
March 31
($ millions) 2021 2020 Change
Canadian Utilities Corporate & Other (10) (7) (3)
Including intersegment eliminations, Canadian Utilities' Corporate & Other adjusted earnings in the first quarter of
2021 were $3 million lower than the same period in 2020 mainly due to the timing of certain expenses, partially
offset by improved earnings at ATCOenergy.
13 ATCO LTD. 2021 MANAGEMENT'S DISCUSSION & ANALYSISOTHER EXPENSES AND INCOME
A financial summary of other consolidated expenses and income items for the first quarter of 2021 and 2020 is
given below. These amounts are presented in accordance with IFRS accounting standards. They have not been
adjusted for the timing of revenues and expenses associated with rate-regulated activities and other items that are
not in the normal course of business.
Three Months Ended
March 31
($ millions) 2021 2020 Change
Operating costs 611 574 37
Depreciation and amortization 170 156 14
Earnings from investment in associate company 3 3 —
Earnings from investment in joint ventures 14 7 7
Net finance costs 102 99 3
Income tax expense 45 63 (18)
OPERATING COSTS
Operating costs, which are total costs and expenses less depreciation and amortization, were $37 million higher in
the first quarter of 2021 compared to the same period in 2020. Higher operating costs were mainly due to higher
flow-through Alberta-system natural gas transmission costs in the Utilities, higher electricity costs in ATCOenergy,
and the recognition of termination and transition costs in the first quarter of 2021 related to the early termination
of the Master Services Agreement with Wipro for managed IT services.
DEPRECIATION AND AMORTIZATION
Depreciation and amortization increased by $14 million in the first quarter of 2021 compared to the same period in
2020 mainly due to continued capital investment to expand ATCO Structures' space rental fleet and in Canadian
Utilities' regulated businesses.
EARNINGS FROM INVESTMENT IN ASSOCIATE COMPANY
Earnings from investment in associate company relate to our 40 per cent ownership interest in Neltume Ports, a
leading port operator and developer in South America with operations in 16 port facilities and three port operation
services businesses located in Chile, Uruguay, Argentina, and Brazil.
Earnings from investment in associate company in the first quarter of 2021 were comparable to the same period in
2020.
EARNINGS FROM INVESTMENT IN JOINT VENTURES
Earnings from investment in joint ventures is mainly comprised of Canadian Utilities' ownership positions in
electricity generation plants, LUMA Energy electricity operations and maintenance in Puerto Rico, and the
Strathcona Storage Limited Partnership which operates hydrocarbon storage facilities at the ATCO Heartland Energy
Centre near Fort Saskatchewan, Alberta.
Earnings from investment in joint ventures increased by $7 million in the first quarter of 2021 compared to the
same period in 2020 mainly due to earnings at LUMA Energy with the commencement of transition work under the
Operations and Maintenance Agreement in June 2020.
NET FINANCE COSTS
Net finance costs increased by $3 million in the first quarter of 2021 when compared to the same period in 2020
mainly due to lower interest income resulting from lower interest rates received on bank balances.
ATCO LTD. 2021 MANAGEMENT'S DISCUSSION & ANALYSIS 14INCOME TAX Income taxes were lower by $18 million in the first quarter of 2021 compared to the same period in 2020 mainly due to lower earnings before income taxes as a result of the timing of certain revenues and expenses, termination and transition costs from the early termination of the Master Services Agreement with Wipro for managed IT services, and a foreign exchange adjustment to the deferred tax asset in Mexico. 15 ATCO LTD. 2021 MANAGEMENT'S DISCUSSION & ANALYSIS
LIQUIDITY AND CAPITAL RESOURCES
Our financial position is supported by Regulated Utilities and long-term contracted operations. Our business
strategies, funding of operations, and planned future growth are supported by maintaining strong investment grade
credit ratings and access to capital markets at competitive rates. Primary sources of capital are cash flow from
operations and the debt and capital markets.
Under normal market conditions, we consider it prudent to maintain enough liquidity to fund approximately one full
year of cash requirements to preserve strong financial flexibility. Liquidity is generated by cash flow from operations
and is supported by appropriate levels of cash and available committed credit facilities.

At March 31, 2021, ATCO and its subsidiaries had the following lines of credit.

($ millions)                                                                    Total               Used           Available

Long-term committed                                                        3,104                    946              2,158
Uncommitted                                                                  571                     164               407
Total                                                                      3,675                   1,110             2,565

                                                                                    Lines of Credit
Of the $3,675 million in total lines of credit,
                                                                                      ($ millions)
$571 million was in the form of uncommitted credit
facilities with no set maturity date. The other                       $3,675
$3,104 million in credit lines was committed, with
maturities between 2022 and 2024, and may be
extended at the option of the lenders.                                                                 $2,565

Of the $1,110 million in lines of credit used,                                          $(1,110)
$660 million was related to ATCO Gas Australia Pty
Ltd. Long-term committed credit lines are used to
satisfy all of ATCO Gas Australia Pty Ltd.'s term debt
financing needs. The majority of the remaining usage
is for the issuance of Canadian Utilities' letters of
credit and ATCO Structures & Logistics' funding to                      Total            Used          Available

expand its global rental fleet and working capital
needs on workforce housing projects.

CONSOLIDATED CASH FLOW
At March 31, 2021, the Company's cash position was $1,147 million, an increase of $47 million compared to
December 31, 2020 mainly due to funds generated by operations achieved during the quarter and the recovery of
incurred costs related to the termination of the La Laguna Cogeneration facility contract in the first quarter of 2021,
partially offset by dividends paid and cash used to fund the capital investment program.

Funds Generated by Operations
Funds generated by operations were $491 million in the first quarter of 2021, $25 million lower compared to the
same period in 2020. The decrease was mainly due to the timing of certain revenues and expenses. Lower funds
generated by operations were partially offset by higher customer contributions for Canadian Utilities' Electricity
Transmission capital investments.
Funds generated by operations in 2021 are expected to be adversely impacted as a result of ATCO's decision to
provide rate relief to customers through the deferral of rate increases for Electricity Distribution and Natural Gas
Distribution and the proposal to the AUC to collect these deferred amounts beginning in 2023.

                                                              ATCO LTD. 2021 MANAGEMENT'S DISCUSSION & ANALYSIS            16
Cash Used for Capital Investment
Cash used for capital investment was $253 million in the first quarter of 2021, $50 million lower compared to the
same period in 2020 mainly due to lower investment in ATCO Structures' rental fleet, the timing of capital
investment in the Utilities, and the completion of construction in the first quarter of 2020 on the Pembina-Keephills
transmission pipeline in Canadian Utilities' Natural Gas Transmission business.
Capital investment for the first quarter of 2021 and 2020 is shown in the table below.
Three Months Ended
March 31
($ millions) 2021 2020 Change
Structures & Logistics 18 38 (20)
Neltume Ports — — —
ATCO Corporate & Other 5 6 (1)
23 44 (21)
Canadian Utilities
Utilities
Electricity Distribution 54 66 (12)
Electricity Transmission 34 42 (8)
Natural Gas Distribution 56 57 (1)
Natural Gas Transmission 60 73 (13)
International Natural Gas Distribution 16 11 5
220 249 (29)
Energy Infrastructure
Electricity Generation — 2 (2)
Storage & Industrial Water 8 6 2
8 8 —
CU Corporate & Other 2 2 —
Canadian Utilities Total Capital Investment 230 259 (29)
(1) (2) (3)
ATCO Total Capital Investment 253 303 (50)
(1) Includes capital expenditures in joint ventures of $5 million (2020 - $2 million) for the first quarter of 2021.
(2) Includes additions to property, plant and equipment, intangibles and $3 million (2020 - $5 million) of interest capitalized during construction for the first
quarter of 2021.
(3) Includes $56 million (2020 - $26 million) of capital investment, mainly in the Utilities, that were funded with the assistance of customer contributions.
Base Shelf Prospectus - CU Inc. Debentures
On September 16, 2020, CU Inc. filed a base shelf prospectus that permits it to issue up to an aggregate of
$1.2 billion of debentures over the 25-month life of the prospectus. As of April 28, 2021, aggregate issuances of
debentures were $150 million.
Dividends and Common Shares
We have increased our common share dividend each year since 1993, a 28-year track record. Dividends paid to
Class I and Class II Share owners totaled $51 million in the first quarter of 2021.
On April 14, 2021, the Board of Directors declared a second quarter dividend of 44.83 cents per share. The payment
of any dividend is at the discretion of the Board of Directors and depends on our financial condition and other
factors.
Normal Course Issuer Bid
We believe that, from time to time, the market price of our Class I Shares may not fully reflect the value of our
business, and that purchasing Class I Shares represents a desirable use of available funds. The purchase of Class I
Shares, at appropriate prices, will also minimize any dilution resulting from the exercise of stock options.
On March 9, 2020, we commenced a normal course issuer bid to purchase up to 1,014,684 outstanding Class I
Shares. This bid expired on March 8, 2021. During this period, 150,000 shares were purchased for $6 million.
17 ATCO LTD. 2021 MANAGEMENT'S DISCUSSION & ANALYSISOn March 9, 2021, we commenced a normal course issuer bid to purchase up to 1,013,478 outstanding Class I
Shares. The bid will expire on March 8, 2022. From March 9, 2021 to April 27, 2021, no shares were purchased.
SHARE CAPITAL
ATCO's equity securities consist of Class I Shares and Class II Shares.
At April 27, 2021, we had outstanding 101,356,899 Class I Shares, 13,196,129 Class II Shares, and options to
purchase 1,102,600 Class I Shares.
CLASS I NON-VOTING SHARES AND CLASS II VOTING SHARES
Each Class II Share may be converted into one Class I Share at any time at the share owner’s option. If an offer to
purchase all Class II Shares is made, and such offer is accepted and taken up by the owners of a majority of the
Class II Shares, and, if at the same time, an offer is not made to the Class I Share owners on the same terms and
conditions, then the Class I Shares will be entitled to the same voting rights as the Class II Shares. The two share
classes rank equally in all other respects, except for voting rights.
Of the 10,200,000 Class I Shares authorized for grant of options under our stock option plan, 1,998,550 Class I
Shares were available for issuance at March 31, 2021. Options may be granted to our officers and key employees at
an exercise price equal to the weighted average of the trading price of the shares on the Toronto Stock Exchange for
the five trading days immediately preceding the grant date. The vesting provisions and exercise period (which
cannot exceed 10 years) are determined at the time of grant.
ATCO LTD. 2021 MANAGEMENT'S DISCUSSION & ANALYSIS 18QUARTERLY INFORMATION
The following table shows financial information for the eight quarters ended June 30, 2019 through March 31, 2021.
($ millions, except for per share data) Q2 2020 Q3 2020 Q4 2020 Q1 2021
Revenues 938 897 1,053 1,072
Earnings attributable to Class I and Class II Shares 45 54 66 83
Earnings per Class I and Class II Share ($) 0.39 0.48 0.58 0.73
Diluted earnings per Class I and Class II Share ($) 0.39 0.47 0.58 0.72
Adjusted earnings per Class I and Class II Share ($) 0.61 0.47 1.07 1.04
Adjusted earnings (loss)
Structures & Logistics 21 12 17 14
Neltume Ports 2 3 7 3
ATCO Corporate & Other (1) — — 1
Canadian Utilities
Utilities 57 47 102 106
Energy Infrastructure 2 3 7 5
Canadian Utilities Corporate & Other (11) (11) (11) (10)
Total adjusted earnings 70 54 122 119
($ millions, except for per share data) Q2 2019 Q3 2019 Q4 2019 Q1 2020
Revenues 1,103 1,097 1,182 1,056
Earnings attributable to Class I and Class II Shares 158 160 83 87
Earnings per Class I and Class II Share ($) 1.38 1.40 0.73 0.76
Diluted earnings per Class I and Class II Share ($) 1.37 1.40 0.72 0.76
Adjusted earnings per Class I and Class II Share ($) 0.68 0.65 0.88 0.93
Adjusted earnings (loss)
Structures & Logistics 7 13 14 7
Neltume Ports 4 3 4 3
ATCO Corporate & Other — 3 (9) 1
Canadian Utilities
Utilities 68 48 92 99
Energy Infrastructure 10 20 8 3
Canadian Utilities Corporate & Other (11) (13) (8) (7)
Total adjusted earnings 78 74 101 106
Our financial results for the previous eight quarters reflect the cyclical demand for workforce housing and space
rental products and services in ATCO Structures and ATCO Frontec, cargo volumes and margins at Neltume Ports,
and in Canadian Utilities, the timing of utility regulatory decisions, and the seasonal nature of demand for natural
gas and electricity.
ADJUSTED EARNINGS
$122M $119M
$101M $106M
$78M $74M $70M
$54M
Q2 2019 Q3 2019 Q4 2019 Q1 2020 Q2 2020 Q3 2020 Q4 2020 Q1 2021
19 ATCO LTD. 2021 MANAGEMENT'S DISCUSSION & ANALYSISAdjusted earnings in the second and third quarters of 2019 and 2020 were impacted by lower seasonal demand in
Canadian Utilities' Natural Gas Distribution business. Adjusted earnings in the fourth quarter of 2020 and first
quarter of 2021 were positively impacted by ATCO Structures' workforce housing sale and rental activity and space
rental activity as well as additional client work requests for COVID-19 proactive and preventative safety measures at
ATCO Frontec. Adjusted earnings in the fourth quarter of 2020 and first quarter of 2021 in Canadian Utilities were
higher compared to the same periods in 2019 and 2020 mainly due to continued cost efficiencies, rate base growth
and earnings from International Electricity Operations.
EARNINGS ATTRIBUTABLE TO CLASS I AND CLASS II SHARES
Earnings attributable to Class I and Class II Shares include timing adjustments related to rate-regulated activities
and unrealized gains or losses on mark-to-market forward and swap commodity contracts. They also include
one-time gains and losses, significant impairments, and other items that are not in the normal course of business or
a result of day-to-day operations recorded at various times over the past eight quarters. These items are excluded
from adjusted earnings and are highlighted below:
• In the second, third and fourth quarters of 2019, Canadian Utilities closed a series of transactions related
to the sale of its Canadian fossil fuel-based electricity generation business and Alberta PowerLine
resulting in a gain on sale of operations of $65 million (after-tax and non-controlling interests). As these
transactions were one-time in nature, they were excluded from adjusted earnings.
• In 2020, impairment and other costs not in the normal course of business of $20 million (after-tax and
non-controlling interests) were recorded. These costs mainly related to certain assets that no longer
represent strategic value for the Company. As these costs were one-time in nature, they were excluded
from adjusted earnings.
• In the fourth quarter of 2020 and first quarter of 2021, Canadian Utilities signed Master Services
Agreements with IBM Canada Ltd. and IBM Australia Limited, respectively, to provide managed
information technology services. These services are currently provided by Wipro under a ten-year MSA
expiring in December 2024. The transition of the managed IT services from Wipro to IBM commenced on
February 1, 2021 and is expected to be completed by the third quarter of 2021. ATCO recognized costs of
$32 million (after-tax and non-controlling interests) in the fourth quarter of 2020 and termination and
transition costs of $6 million (after-tax and non-controlling interests) in the first quarter of 2021. As these
costs are not in the normal course of business, they have been excluded from adjusted earnings.
ATCO LTD. 2021 MANAGEMENT'S DISCUSSION & ANALYSIS 20NON-GAAP AND ADDITIONAL GAAP MEASURES Adjusted earnings are defined as earnings attributable to Class I and Class II Shares after adjusting for the timing of revenues and expenses associated with rate-regulated activities and unrealized gains or losses on mark-to-market forward and swap commodity contracts. Adjusted earnings also exclude one-time gains and losses, significant impairments, and items that are not in the normal course of business or a result of day-to-day operations. Adjusted earnings present earnings from rate-regulated activities on the same basis as was used prior to adopting IFRS - that basis being the US accounting principles for rate-regulated activities. Management’s view is that adjusted earnings allow for a more effective analysis of operating performance and trends. A reconciliation of adjusted earnings to earnings attributable to Class I and Class II Shares is presented in this MD&A. Adjusted earnings is an additional GAAP measure presented in Note 3 of the unaudited interim consolidated financial statements. Adjusted earnings per Class I and Class II Share is calculated by dividing adjusted earnings by the weighted average number of shares outstanding for the period. Funds generated by operations is defined as cash flow from operations before changes in non-cash working capital. In management’s opinion, funds generated by operations is a significant performance indicator of the Company’s ability to generate cash during a period to fund capital expenditures. Funds generated by operations does not have any standardized meaning under IFRS and might not be comparable to similar measures presented by other companies. A reconciliation of funds generated by operations to cash flows from operating activities is presented in this MD&A. Capital investment is defined as cash used for capital expenditures, business combinations, and cash used in the Company's proportional share of capital expenditures in joint ventures, and cash used for equity investment in associate companies. In management's opinion, capital investment reflects the Company's total cash investment in assets. Capital expenditures includes additions to property, plant and equipment and intangibles as well as interest capitalized during construction. A reconciliation of capital investments to capital expenditures is presented in this MD&A. 21 ATCO LTD. 2021 MANAGEMENT'S DISCUSSION & ANALYSIS
RECONCILIATION OF ADJUSTED EARNINGS
TO EARNINGS ATTRIBUTABLE TO CLASS I
AND CLASS II SHARES
Adjusted earnings are earnings attributable to Class I and Class II Shares after adjusting for the timing of revenues
and expenses associated with rate-regulated activities and unrealized gains or losses on mark-to-market forward
and swap commodity contracts. Adjusted earnings also exclude one-time gains and losses, significant impairments,
and items that are not in the normal course of business or a result of day-to-day operations.
Adjusted earnings are a key measure of segment earnings that management uses to assess segment performance
and allocate resources. It is management’s view that adjusted earnings allow a better assessment of the economics
of rate regulation in Canada and Australia than IFRS earnings.

                                                                                                                  Three Months Ended
($ millions)                                                                                                                March 31
                                                    ATCO
2021                      Structures    Neltume                                                                               ATCO
                                                  Corporate                   Canadian Utilities Limited
                          & Logistics    Ports                                                                             Consolidated
2020                                               & Other
                                                               Utilities        Energy          CUL         Consolidated
                                                                            Infrastructure   Corporate
                                                                                              & Other
Revenues                         167        —            (2)        790               52             65            907          1,072
                                 171        —           —           789               50             46            885          1,056
Adjusted earnings                 14         3           1          106                 5           (10)           101            119
  (loss)
                                    7        3           1            99                3             (7)            95           106

Unrealized gains on
 mark-to-market                   —         —           —             —                —             —               —              —
 forward and swap
 commodity
 contracts                        —         —           —             —                —              3               3              3

Rate-regulated                    —         —           —            (28)              —             —              (28)           (28)
  activities
                                  —         —           —            (17)              —             —              (17)           (17)

IT Common Matters                 —         —           —             (2)              —             —               (2)            (2)
   decision
                                  —         —           —             (2)              —             —               (2)            (2)

Transition of
  managed IT services             —         —           —             (6)              —             —               (6)            (6)

                                  —         —           —             —                —             —               —              —

Other                             —         —           —             —                —             —               —              —
                                  —         —            1            —                (4)           —               (4)            (3)

Earnings (loss)                   14         3           1            70                5           (10)             65             83
  attributable to Class
  I and Class II Shares             7        3           2            80               (1)            (4)            75             87

UNREALIZED GAINS ON MARK-TO-MARKET FORWARD AND SWAP COMMODITY CONTRACTS
The Company’s retail electricity and natural gas business in Alberta enters into fixed-price swap commodity
contracts to manage exposure to electricity and natural gas prices and volumes.
These contracts are measured at fair value. Unrealized gains and losses due to changes in the fair value of the fixed-
price swap commodity contracts are recognized in the earnings of the Corporate & Other segment.

                                                                    ATCO LTD. 2021 MANAGEMENT'S DISCUSSION & ANALYSIS                    22
The CODM believes that removal of the unrealized gains or losses on mark-to-market forward and swap commodity
contracts provides a better representation of operating results for the Company's operations.
Realized gains or losses are recognized in adjusted earnings when the commodity contracts are settled.
RATE-REGULATED ACTIVITIES
Electricity Distribution and Transmission and their subsidiaries, ATCO Electric Yukon, Northland Utilities (NWT) and
Northland Utilities (Yellowknife), as well as Natural Gas Distribution, Natural Gas Transmission and International
Natural Gas Distribution are collectively referred to as the Regulated Utilities.
There is currently no specific guidance under IFRS for rate-regulated entities that the Company is eligible to adopt.
In the absence of this guidance, the Regulated Utilities do not recognize assets and liabilities from rate-regulated
activities as may be directed by regulatory decisions. Instead, the Regulated Utilities recognize revenues in earnings
when amounts are billed to customers, consistent with the regulator-approved rate design. Operating costs and
expenses are recorded when incurred. Costs incurred in constructing an asset that meet the asset recognition
criteria are included in the related property, plant and equipment or intangible asset.
The Company uses standards issued by the Financial Accounting Standards Board (FASB) in the United States as
another source of generally accepted accounting principles to account for rate-regulated activities in its internal
reporting provided to the CODM. The CODM believes that earnings presented in accordance with the FASB
standards are a better representation of the operating results of the Company’s rate-regulated activities. Therefore,
the Company presents adjusted earnings as part of its segmented disclosures on this basis. Rate-regulated
accounting (RRA) standards impact the timing of how certain revenues and expenses are recognized when
compared to non-rate regulated activities, to appropriately reflect the economic impact of a regulator's decisions on
revenues.
Rate-regulated accounting differs from IFRS in the following ways:
Timing Adjustment Items RRA Treatment IFRS Treatment
Additional Future removal and site The Company defers the The Company recognizes
revenues billed in restoration costs, and impact of recognition of cash revenues when amounts are
current period colder temperatures received in advance of billed to customers and costs
future expenditures. when they are incurred.
Revenues to be Deferred income taxes, impact of The Company recognizes The Company recognizes
billed in future warmer temperatures, and revenues associated with costs when they are
periods impact of inflation on rate base recoverable costs in incurred, but does not
advance of future billings recognize their recovery until
to customers. customer rates are changed
and amounts are collected
through future billings.
Regulatory Regulatory decisions received The Company recognizes The Company does not
decisions received which relate to current and prior the earnings from a recognize earnings from a
periods regulatory decision regulatory decision when it is
pertaining to current and received as regulatory assets
prior periods when the and liabilities are not
decision is received. recorded under IFRS.
Settlement of Settlement of amounts The Company recognizes The Company recognizes
regulatory receivable or payable to the amount receivable or earnings when customer
decisions and customers and other items payable to customers as a rates are changed and
other items reduction in its regulatory amounts are recovered or
assets and liabilities when refunded to customers
collected or refunded through future billings.
through future billings.
23 ATCO LTD. 2021 MANAGEMENT'S DISCUSSION & ANALYSISThe significant timing adjustments as a result of the differences between rate-regulated accounting and IFRS are as
follows:
Three Months Ended
March 31
($ millions) 2021 2020 Change
Additional revenues billed in current period
(1)
Future removal and site restoration costs 15 12 3
(2)
Impact of colder temperatures — 3 (3)
Revenues to be billed in future periods
(3)
Deferred income taxes (14) (18) 4
(4)
Distribution rate relief (21) — (21)
(2)
Impact of warmer temperatures (1) — (1)
(5)
Impact of inflation on rate base (3) (2) (1)
(6)
Settlement of regulatory decisions and other items (4) (12) 8
(28) (17) (11)
(1) Removal and site restoration costs are billed to customers over the estimated useful life of the related assets based on forecast costs to be incurred in
future periods.
(2) Natural Gas Distribution customer rates are based on a forecast of normal temperatures. Fluctuations in temperatures may result in more or less
revenue being recovered from customers than forecast. Revenues above or below the normal in the current period are refunded to or recovered from
customers in future periods.
(3) Income taxes are billed to customers when paid by the Company.
(4) In the first quarter of 2021, Electricity Distribution and Natural Gas Distribution recorded a decrease in earnings of $21 million related to interim rate
relief for customers as applied for by ATCO and approved by the AUC to hold current distribution base rates in place. This will be recovered from
customers in future periods.
(5) The inflation-indexed portion of International Natural Gas Distribution's rate base is billed to customers through the recovery of depreciation in
subsequent periods based on the actual or forecasted annual rate of inflation. Under rate-regulated accounting, revenue is recognized in the current
period for the inflation component of rate base when it is earned. Differences between the amounts earned and the amounts billed to customers are
deferred and recognized in revenues over the service life of the related assets.
(6) In the first quarter of 2020, Electricity Distribution recorded a decrease in earnings of $14 million related to the payment of transmission costs. This is
being recovered from customers in future periods.
IT COMMON MATTERS DECISION
Consistent with the treatment of the gain on sale in 2014 from the IT services business by the Company, financial
impacts associated with the IT Common Matters decision are excluded from adjusted earnings. The amount
excluded from adjusted earnings for the three months ended March 31, 2021 was $2 million (2020 - $2 million).
TRANSITION OF MANAGED IT SERVICES
In the fourth quarter of 2020 and first quarter of 2021, Canadian Utilities signed Master Services Agreements with
IBM Canada Ltd. and IBM Australia Limited, respectively, to provide managed information technology services.
These services are currently provided by Wipro under a ten-year MSA expiring in December 2024. The transition of
the managed IT services from Wipro to IBM commenced on February 1, 2021 and is expected to be completed by
the third quarter of 2021.
For the three months ended March 31, 2021, ATCO recognized termination and transition costs of $6 million (after-
tax and non-controlling interests). As these costs are not in the normal course of business, they have been excluded
from adjusted earnings.
OTHER
The Company adjusts the deferred tax asset which was recognized as a result of the 2015 Tula Pipeline Project
impairment. During the three months ended March 31, 2021, the Company recorded a foreign exchange loss of nil
after tax and non-controlling interests (2020 - a foreign exchange loss of $4 million) due to a difference between the
tax base currency, which is the Mexican peso, and the US dollar functional currency.
ATCO LTD. 2021 MANAGEMENT'S DISCUSSION & ANALYSIS 24You can also read