Efficient integration of renewable energy into future energy systems - Development of European energy infrastructures in the period 2030 to 2050 ...
←
→
Page content transcription
If your browser does not render page correctly, please read the page content below
Efficient integration
of renewable energy into
    future energy systems
     Development of European energy
          infrastructures in the period
                         2030 to 2050
Content

1.   The SUSPLAN project                                       3
		   Background                                                 3
		   Brief overview                                             4
		   Storylines                                                 4
		   Framework conditions                                      6

2. Regional scenarios in the period 2030-2050                  7
		   Objectives and selection criteria                          7
		   Main characteristics of the regions and results            8
		   Islands and Northern Europe:
		   The RES potential exceeds the demand                       8
		   South-Western and Southern Europe:
		   Investment in electricity transmission
     depends on storyline                                      9
		   Western Balkan, North- and South-Eastern Europe:
		   Early decisions are important for efficient investments   9
		   Central Europe and Alpine-Region:
		   Heat demand will decline in the future                    10
		   Conclusions                                               11

3. Transnational infrastructure
   development in the period 2030-2050                         12
		   Objectives and assumptions                                12
		   Electricity infrastructure development                    13
		   Gas infrastructure development                            14
		   Integral analysis of electricity and gas
     infrastructure developments                               15

4. Steps towards the European energy
   system of the future                                        16
		   Barriers to future energy infrastructures                 16
		   Implementation strategies for decision-makers             17
		   Conclusion                                                18

     Imprint                                                   19

2
1. The SUSPLAN project

Background                                                     national level. In the future, much more energy production
                                                               will be based on local or regional renewable energy sources
In consideration of strategic climate mitigation, energy       (RES). Many consumers may also become energy producers
security and economic competitiveness goals, the EU            feeding into the infrastructures. Transnational energy
passed the Directive 2009/28/EC, including a binding target    transfers will gain in importance.
of 20 per cent renewable energy consumption in the EU by
2020. This target is comprehensive and includes energy         These changes will require very different electricity and gas
generation, transport, heating and cooling sectors. In 2008,   infrastructures and decision-making processes from today.
renewable energy consumption in the EU was about 		            Lack of infrastructure capacity is already a barrier for the
10 per cent. So meeting the 20 per cent renewable energy       further deployment of RES-based energy production in some
objective will require massive changes in energy production,   regions in Europe.
transmission and consumption in the EU. Furthermore, it is
obvious that the development of the energy system will not
stop in 2020, but that it will continue towards 2050 and
beyond.

Over the past century, the European electricity system was
developed in line with a national utility perspective which
heavily emphasised large, centralised conventional power
production. Investment decisions for new energy infra-
structure and technology were typically made at the

                                                                                                                             3
Brief overview Storylines
Developing energy systems is a long-term process. If large To describe possible futures for the European energy
amounts of renewable resources are to be integrated by system, a storyline approach was used as a consistent
2050, it is necessary to begin reorganising energy systems methodology for structuring the problem into a manage
today. This is why the project SUSPLAN (PLANning for able form.
SUStainability) focused on developing strategies, recom-
mendations, and benchmarks for the integration of renew- As primary driving forces two main uncertainties were
able energy sources by 2030-2050 within a Europe-wide identified:
context. SUSPLAN sought to find solutions for the coming Technology development
environmental and energy challenges facing the Euro-
pean community. SUSPLAN was carried out from 2008 to 2011 Public attitude regarding climate change and
under the European Union’s 7th Framework Programme. It environmental issues
was sponsored by the Directorate-General for Energy (DG-ENER).
The rest of the unknown factors that should be considered
The project tasks were carried out by a consortium with a as possible futures for the European energy system were
mix of academic and research institutions, utilities, local combined into four storylines defined by these drivers. T
hese
authorities, and energy companies. The 16 SUSPLAN partners storylines established the background for the scenario
are acknowledged experts in their field. Furthermore, analyses (Figure 1).
stakeholders from representative regions including New
Member States were engaged in the project. The basic assumptions for the storylines were:
1. There is a strong political drive in Europe to promote
SUSPLAN’s two level approach (regional and transnational) sustainable development and security of supply. This results
made it possible to meet the challenge of a variety of energy in the use of necessary incentives and regulations for the
production and infrastructure throughout Europe. By con- increased deployment of RES.
necting regional case studies and a transnational analysis,
SUSPLAN connected the regional implementation of energy 2. The share of RES in the future European energy system will
infrastructure with national and European strategic aims. be significant. The use of nuclear and fossil fuels with CCS
(carbon capture and storage) will follow traditional infra-
The project took a multi-dimensional approach by assembling structure planning and is not given particular attention in
policy, business, economic, environmental and energy any of the storylines.
professionals together.
3. Hydrogen will not have a breakthrough as a major energy
SUSPLAN addresses the following objectives: carrier at distribution level in the given time frame. Electricity
Develop and evaluate grid-related RES scenarios at regional will be the most cost-effective alternative to fossil fuels in the
and transnational level that include combined electricity/ transport sector, but in some storylines, biofuels meet a
heat generation and options for gas. certain amount of the energy demand in the transport sector.
Evaluate, compare and synthesise the scenarios to identify
the best development paths for the integration of RES at
regional and transnational level, contributing to increased
security of supply and industrial competitiveness.
Establish implementation strategies for decision-makers
by generalising results and experiences from the RES inte-
gration scenario studies.
Establish an advanced toolbox to support the grid-related
scenarios by combining the best available tools and
knowledge.
Disseminate results to relevant decision-makers like
political, infrastructure and network planners and
power distributors.
4
Positive public attitude
High environmental focus in population and business,
Yellow reduced energy consumption and demand Green
for environmentally-friendly products
Positive future for high RES Positive future for high RES
integration, but too low technology integration, both market pull
development rate, mainly and technology push existing.
decentralised development.
Slow tech development Fast tech development
No major technology break- Major breakthroughs
throughs, gradual develop- several technologies,
ment of current technologies RES, grids, demand side
Difficult future for high RES
integration, few new technologies New technologies are available,
are available, low interest to but low interest to invest and use,
invest, mainly centralised development mainly centralised development,
with traditional technologies. but with new technologies.
Indifferent public attitude
Red Blue
Low environmental focus in population and business,
higher energy consumption and no demand
for environmentally-friendly products or services
Yellow storyline: Comparing it to traffic Green storyline: The Green storyline describes the
lights, Yellow can be interpreted as “the time environmentally- friendly energy future, and
slot you have is limited”. It is still p
ossible to making use of the marine environment. The energy
pass through or to change to a better direc- system is developing in a direction which will
tion towards sustainable energy systems. prevent or at least limit climate changes. An alter-
In addition, PV (photovoltaics) is specially native way of regarding the Green storyline is by
mentioned as a s ignificant part of the Yellow comparing it to traffic lights. Green lights can be
storyline, and the sun is y ellow. regarded as “continue in the same way”.
Red storyline: Comparing it to traffic lights, Blue storyline: Large-scale ocean energy and off-
the Red storyline can be interpreted as “Stop! shore-wind is an important part of this storyline,
This is not a way to a sustainable future”. and the ocean is blue. In this storyline renewable
energy is mainly produced far away from consumers’
sites. This highlights the problem that people are
not in touch with these sustainable technologies
and also might not fully understand the need to
behave in an environmentally-friendly way. Thus,
the Blue storyline is also indicating that people
live their lives without much concern for the
situation tomorrow.
Figure 1: Drivers and characteristics of the four different storylines in SUSPLAN
5
Framework conditions
60 RES share of total final energy demand [%]
In the storylines, it was assumed that the EU 2020 targets
regarding energy from renewables are met at the latest by
2030, and that the development of RES in Europe will continue
50
towards 2050, although with different momentum in different
storylines (Figure 2).
To create a mutual starting point for the SUSPLAN studies, a
40
sequential use of large-scale energy system models was applied.
First, the Primes/Green-X modelling and database framework
was used to generate a European-wide distribution of renew-
able energy sources up to 2030. Then, the European Multi-
30
area Power Market Simulator EMPS was used to establish a
Assumption that
harmonised level of European electricity market prices up
EU 2020 targets –
to 2050, also including the regions not included in further in the worst case
SUSPLAN analyses. The need for electricity infrastructures (Red) – are met
20 at least in 2030
was analysed by the MTSIM (Medium Term SIMulator) tool,
which is an electricity market simulator able to determine
the hourly clearing of a zonal market over an annual time
Today
horizon. For the transnational gas network study, GASTALE
10
was used: A game-theoretic equilibrium model of the Euro-
pean natural gas market.
based on existing studies & SUSPLAN
European goals scenario analysis
0
10
20
30
40
50
20
20
20
20
20
Green Blue
Yellow Red
Figure 2: RES deployment as a share of total final energy demand on aggregated
European level in the four different storylines in SUSPLAN
6
2. Regional scenarios in the period 2030-2050
Objectives and selection criteria A region is defined as a physical area which may be part of
one single country or parts of several countries. The system
Nine different regions were selected throughout Europe boundaries are either geographically defined or designated
for comprehensive in-depth analyses of the long-term grid by specific energy infrastructures.
integration of renewable electricity, heat and gas generation
technologies (Figure 3). These analyses are based on future
renewable deployment scenarios in different European regions
up to the year 2050, and quantify the corresponding grid
infrastructure needs and costs necessary.
The major objective of the regional scenario studies was to
analyse renewable grid infrastructure integration in different
energy systems through a variety of different geographical,
structural, technical, economic, institutional and political
framework dimensions. Moreover, the multiplicity of these
dimensions was the major selection criterion of a particular
SUSPLAN region.
The regions were selected according to the following
criteria:
1. Sufficient number of regional studies necessary to cover
several representative regions all over Europe.
2. Different starting points of RES integration.
3. Different characteristics of the energy system.
4. Different RES/environmental policy, energy market
maturity and macro-economic aspects.
Figure 3: The 9 SUSPLAN regions
7
Main characteristics of the regions and results The Green and Blue storylines in particular will require
other infrastructure development paths compared to current
The results from the regional studies indicate that all r egions strategies of regional security of supply and centralised
are able to integrate larger shares of renewable energy generation. In Spain, for example, gas demand will sub
sources, but non-RES sources will also be present in varying stantially decline in the Green storyline after 2030. No further
degrees in most regions. In some regions, the electricity g rids expansion of gas infrastructure will, therefore, be required in
must be massively expanded to achieve the integration of this storyline. The situation is similar in Austria where
large shares of renewable energy. For instance, by 2050, declining household gas demand will mean that no expansion
Italy‘s electricity grids must be expanded by 170 per cent of gas infrastructure will be required after 2030.
over present levels so that power can be transmitted from
future renewable power generation sites in the south to the In the following, one illustrative result is presented for each
centres of demand in northern Italy. of the nine regional scenario studies highlighting at least one
important aspect that has to be considered in integration of
However, very different infrastructures will be needed at renewable energy sources.
regional level depending on the different storylines.
Islands (Outer Hebrides, Scotland) Northern Europe (Norway)
Very high offshore wind and marine resources High onshore and offshore RES potentials
Barriers to development of onshore resources Existing scenarios of transmission system operator for onshore grid
development are robust
Low local demand, weak connection to main UK (United Kingdom) grids
Weak national drivers to further develop RES generation
No major RES development possible when region is seen as isolated,
needs connection to central grids and load areas to fully exploit its Further RES exploitation should be as part of a joint, transnational grid
resources development
Islands and Northern Europe: The RES potential
7,000 Installed capacity (MW)
exceeds the demand
6,000
In the two regions described above the renewable e nergy
potential is high, both regions can become electricity 5,000
exporters. In this case, strong grid connections to c ontinental
4,000
Europe are required. Incentives for the utilisation of t hese
RES potentials are needed since the benefits are only p artly 3,000
used in the energy-producing regions. Large-scale RES
exploitation should be part of a joint, transnational grid 2,000
development (Figure 4).
1,000
0
20
25
30
35
40
45
50
10
15
20
20
20
20
20
20
20
20
20
Nearshore marine Mainland import + diesel generation
Onshore wind Offshore marine
Offshore wind Max. electricity demand
Figure 4: RES potential in the Outer Hebrides (Blue storyline)
8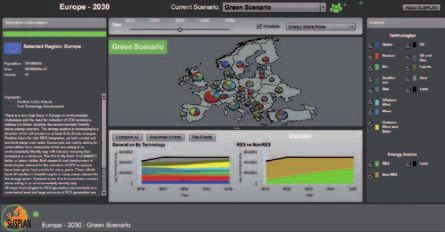
South-Western Europe (Spain) Southern Europe (Italy)
Large potential for solar and wind generation Region remains a net energy importer in all storylines
Challenges related to intermittency and balancing; parallel strategy of Energy efficiency measures needed to reach current RES targets
gas-fired CCGT (combined cycle gas turbines)
Major wind and solar resources in the south, main load centres in
Stronger interconnection with rest of Europe (France) needed the north; considerable infrastructure developments needed both
between regions (highest in Green storyline) and inside regions
No further need for domestic gas investments if RES-electricity shares (highest in Red storyline)
exceed 70 per cent
Further expansion of gas grid only through role as a European gas hub
Transnational gas interconnections with Europe needed in all storylines
South-Western and Southern Europe: Investment in
180 %
electricity transmission depends on storyline
In Italy, the renewable generation technologies with the greatest
potential (wind and solar) will be available in regions where 160
the transmission grid is weak or nonexistent and, therefore,
will require heavy investment in the network (Figure 5). More-
over, the South-Italian regions are generally in a situation where
140
the generation exceeds the load, so a significant amount of
energy will be exported to neighbouring regions.
Also in Spain, those storylines with the highest RES penetration 120
growth need the larger grid expansion. However, it is also
very important to consider the impact of distributed RES
generation in reducing costs due to an assumed reduction in 100 %
peak demand. The Blue and Red storylines have a higher RES
10
20
30
40
50
capacity connected to the transmission network. On the other
20
20
20
20
20
hand, in the Yellow and Green storylines, half of the RES Green Blue Yellow Red
capacity is connected to the distribution network.
Figure 5: Transregional grid expansion (Italy)
North-Eastern Europe (Pomerania, Poland) Western Balkans (Serbia)
Huge RES potential (mainly wind) Abundant local lignite resources utilised in all storylines together with
hydropower
Current policies focus on security of supply, not particularly on RES
Due to current development, it is assumed that major resources will be
Significant investments in infrastructure are needed, but not necessarily utilised before 2030
triggered by integration of RES
Current under-investment in infrastructure and low purchasing power
Major decisions made now and up to 2020 may limit the extensive among consumers
development of RES
Mainly development of small-scale RES generation and storage is
Region becomes a major exporter in all storylines, but not necessarily of RES foreseen, combined with demand side management and smart grid
technologies at low cost
South-Eastern Europe (Romania)
Fossil generation present in all storylines; based on local lignite and
Balanced energy supply of fossil, nuclear and hydro power CCGT connected to the planned South Stream gas pipeline project
National strategy needed to develop cogeneration based on biomass
Focus on national supply and storage/balancing, no major energy exchange
Stronger regional interconnections with Bulgaria and Turkey needed to
exploit onshore and offshore wind potential in a cost-efficient way
Western Balkan, North- and South-Eastern Europe: be minimised if a coordinated approach is taken. The same
Early decisions are important for efficient investments integration of RES electricity may be obtained in different
storylines, but with differing infrastructure expansion costs.
In the three regions in the eastern part of Europe, it is important In the Red storyline, the grid integration of RES will be the
to take decisions for future development now. Grid costs can smallest, but not necessarily at the lowest cost.
9Central Europe (Rhine-Neckar, Germany) Alpine (Austria)
Multiple grid infrastructures of electricity, heat and gas Already high national share of RES
Reduced energy demand expected in all storylines Only solar PV resources still available beyond 2030, most other hydro
and wind potentials already exploited
No grid expansion necessary, but smart grid and control equipment may
be needed for more variable local PV production Further development of pumped storage and international exchange
capacity possible to supply balancing to neighbouring countries
May export electricity from solar PV during summer under favourable
conditions Major transition from fossil to RES heat technologies expected, but no
further expansion of heat or gas infrastructures needed
Existing gas and heat infrastructures may be converted to biogas/
bioheat
Still dominant coal-fired production unit in the area, large amounts of
RES must be imported from other regions
Central Europe and Alpine-Region: Heat demand
will decline in the future 20 End-use heat generation [TWh/yr]
In the heat market, a major transition from fossil renewable
heat technologies is expected. Heat demand declines in all 15
storylines in the Rhine-Neckar and Alpine regions. Therefore,
in all storylines, no further expansion of heat or gas infra-
structures is needed (Figure 6).
10
5
0
30
40
50
20
20
20
Natural Gas Geothermal (incl. heat pumps)
Bioenergy Oil
Solar thermal Waste
Coal
Figure 6: Shares of resources used for district heating in the Metropolitan
Region Rhine-Neckar (Green storyline)
10Conclusions
The regional case studies have confirmed a huge potential
of unexploited renewable resources in Europe. The potential
can be seen as local (e.g. solar PV in Italy and Rhine-Neckar),
regional (e.g. onshore wind in Spain and Pomerania) as well
as transnational (e.g. offshore wind in the North Sea and off
the coast of Scotland) in character.
Several regions may develop a huge surplus of renewable
energy to export to other regions. For example, the coast
of Scotland may export energy produced by offshore wind
and wave, Norway may export energy produced by offshore
wind or hydropower to balance intermittent production in
Europe, the Pomeranian region may export a large surplus
of electricity produced by wind etc. Even the Rhine-Neckar
region, with limited resources for power production, may
export electricity under favourable conditions (solar PV in
the summer).
Many regions in southern Europe have good conditions for
utilising the sun for power production in the form of PV and ther-
mal CSP (concentrated solar power). Even in the geographical
region of Rhine-Neckar (app. 5,600 km2), there is a potential of
about 3 TWh/year of production from PV in the Green story-
line. Thus, given the favourable development of PV technology,
solar production may be an important part of power production
in Europe in the future.
The need for infrastructure expansion, especially for distri-
bution grid and heat infrastructure, has to be analysed on a
regional level. Since it is strongly dependent on regional issues,
it cannot be summarised across the regions. The regional
case studies show that the future may look very different
depending on which RES sources are utilised for energy
production, and also in which sequence they are included in
the energy system.
113. Transnational infrastructure development
in the period 2030-2050
Objectives and assumptions out based on the development of electricity and gas demand
for the four storylines. The electricity demand is lower in the
The main overall objectives of the transnational Green and the Yellow storyline. The positive public attitude
scenarios were the following: leads to more conscious consumption behaviour but a decrease
Determination of transnational electricity and gas infra- in electricity demand is not foreseen. All four storylines show
structure routes and capacities needed in the future differences in the development of the gas demand. T hese
differences are particularly driven by d evelopments in the
Insights into the interaction between changes in gas and electricity sector, and, to a lesser extent, by developments in
electricity infrastructures the residential sector. Regional-based i ncreases or decreases
in gas demand can be considered a primary driver for gas
The analyses included the demand for transmission corridor infrastructure investments.
capacity development between countries at an aggregated
level. Geographical distances or numbers of physical inter-
connectors have only been partly included in the c alculations.
The analysis of infrastructure development has been carried
12Electricity infrastructure development The electricity infrastructure analysis shows that a strong increase in the penetration of especially large-scale renewable electricity generating units (i.e. large-scale offshore wind parks) has a large impact on the future need for electricity infra- structure upgrades, both in offshore DC (direct current) and onshore AC (alternating current) lines. Since most favourable wind locations generally lay in the South-Western and North- Western parts of Europe, a substantial share of f uture invest- ments needs to be spent for strengthening the e lectricity corridors from South and North-Western Europe to Central and Eastern Europe. The corridors that connect Central Europe with the Iberian Peninsula are expanded in order to exploit RES potential and feed consumption centres in Central Europe at minimum marginal cost. Some corridors in Eastern and South-Eastern Europe are also significantly expanded in all the storylines. In general, the analyses show similar trends in electricity infrastructure reinforcements as the ongoing and expected developments in the period before 2030. This is particularly the case for some crucial regions and corridors of the pan- European transmission system, like the France-Spain links, the interconnections along the axis Germany-Poland-Baltic countries, as well as the Central European region, and the North Sea offshore grids concerning the British Isles, the Scan- dinavian countries and North-Western Europe. These regions and corridors are in fact to be considered crucial for the fulfilment of RES targets, both in 2020 and in the 2030 to 2050 storylines (Figure 7).
Gas infrastructure development xternal gas sources are required, triggering more invest-
e
ments in new EU import capacity (pipelines and LNG (liquified
Gas flows and the expansion of particular corridors and natural gas) terminals) and in cross-border pipelines.
cross-border interconnections change during the period
regarded in the SUSPLAN project. From a gas infrastructure perspective, results show that some
cross-border investments are robust across the different story
The following observations are made: lines, such as the high investments in the corridor from T
urkey
The gradual depletion of gas reserves in the UK and the crossing the Balkan to Central Europe.
Netherlands significantly reduces gas flows from North-
Western Europe to neighbouring countries (i.e. Nether- Investments in the North-West European region are c onstant
lands – Germany, UK – Belgium interconnections). across the storylines as well, but rather limited due to the
already quite well-developed infrastructure in this part of
A large increase in direct gas flows from Russia to Germany Europe. It will be used increasingly to accommodate import
via the proposed North Stream corridor reduces gas flows flows in the future, whereas it was previously used to accom-
from Russia via the Central European corridor in all story- modate Dutch and UK export flows.
lines.
Important storyline differences can be observed especially
Italy emerges as a gas hub in all storylines, although its in the South-West and South of Europe where additional EU
relative importance differs across storylines. Its gas hub internal pipeline investments are required to facilitate pipe-
position gives rise to a net gas flow from Italy to Germany line imports from Algeria (to Italy and Spain) and LNG imports
and Central Europe. The Italian gas imports that allow Italy (via Italy). The differences in storylines are due to different
to become a transit hub originate from Algeria, Libya and needs for additional imports across storylines.
various LNG exporting countries.
Gas consumption in the electricity generation sector has
Spain increases its importance as a gas transit country several implications for gas infrastructure: A larger amount
to a varying degree across storylines due to increased of gas consumption gives rise to a larger need for gas infra-
Algerian exports to the EU borders. structure
investment. After 2030, this effect is more limited,
since European reserves are largely depleted, and gas demand
Across all storylines, Turkey and the Balkan region emerge
no longer increases and in some storylines even decreases.
as important gas hubs. Gas is sourced from Central Asia
and Russia, and re-exported to South-East Europe, and
from there further into Central and Western Europe.
In the Red storyline, the need for new gas infrastructure is
highest because of high demand in combination with a
relatively low share of RES in the production system. In the
Red storyline, gas must cover a large share of the demand 60 costs in billion Euro
growth and there is consequently a larger need for gas infra-
structure. On the other hand, there is a more limited need
for new electricity transmission capacity.
40
In the Green storyline, the situation is the opposite. Gas con-
sumption is only 38 per cent of the consumption in the Red
storyline, and the need for expansion of gas cross-border
capacities is, therefore, much lower. However, there is a much 20
larger need for investment in electricity than gas transmission
capacity because a lot of RES has to be transported from
production to load centres.
0
The majority of investments in the gas pipeline system within
0
0
0
0
Europe take place between 2010 and 2030 (Figure 8). After
02
03
04
05
–2
–2
–2
–2
2030 relatively little investment in EU internal cross-border
20
10
40
30
20
20
20
20
capacity is required. In this period, the impact of change in
gas flow patterns throughout Europe is relatively high since
the depletion of EU gas reserves is highest until 2030. New Figure 8: Gas infrastructure expansion costs across storylines
14Integral analysis of electricity and gas
Gigawatt (GW) Billion m3
infrastructure developments
80 There is a strong interaction between gas and electricity
200 markets which implies that different developments in RES
shares will have an impact on both future electricity and gas
infrastructure.
60
150 The locations where electricity or gas is consumed in Europe
will not always match with the locations of electricity
generation or gas production. An increase in electricity or
40
gas demand is, therefore, likely to increase the demand for
100
gas or electricity transmission services. When increases in
transmission demand on particular cross-border intercon-
20
nections exceed available capacity, this will result in congestion
50
and an expansion of available capacity may be required, i.e.
infrastructure investments are triggered.
0 There seems to be a negative correlation between the need for
0 electricity and gas infrastructure expansion for each storyline
e
e
in
and decade. For example, large electricity infrastructure up-
in
e
e
in
yl
yl
in
or
yl
or
yl
grades are necessary in the Green storyline after 2030, where-
or
st
st
or
st
w
n
st
as only limited gas infrastructure upgrades are necessary in
lo
ee
ue
d
l
Re
Gr
Ye
Bl
that very same storyline in the same period. At the other end,
electricity DC transmission capacity the observation is reversed in the case of post-2030 invest-
electricity AC transmission capacity gas pipeline capacity
ments in the Red storyline: In that case, gas infrastructure
requirements are relatively larger than electricity infrastructure
Figure 9: Expansion of electricity transmission capacity (GW) and gas requirements (Figure 9).
pipeline capacity (m3) from 2040 to 2050
154. Steps towards the European energy system
of the future
Barriers to future energy infrastructures
All RES Intermittent RES
Within the SUSPLAN project, solutions were developed to enable
and facilitate a more efficient integration of RES into electri-
technology grid integration
city and gas transnational networks. From the regional case
development balancing issues
studies, the existing technical and non-technical barriers for
deployment and integration of RES were identified and imple- cost reduction resource forecast
mentation strategies developed. storage options
The technical barriers to RES have been analysed on a regional
basis. Barriers differ depending on the maturity and com- Non-mature RES Other challenges
plexity of the technology as well as on the availability of the
resource, and are, therefore, not valid for each RES (Figure 10). plant efficiency grid connection
technology environmental
The large number of non-technical barriers to RES deployment development conditions (sea)
applies to all technologies but varies by region and the c orres- scaling-up
ponding legal, economic and socio-economic factors. With production
regard to the grid development for gas and electricity infra-
structure, there are many barriers not only at national but
also at transnational level (Figure 11). Figure 10: Main technical barriers to RES deployment
16Infrastructure development issues Investment and financial issues
Lack of long-term vision or targets (after 2020) Nationally-orientated legal and regulatory regimes
Lack of long-term, integrated development National orientation and incompatibility of support schemes
(of all RES and for electricity and gas infrastructure) Unequal financing opportunities
Complicated planning procedures Lack of appropriate international infrastructure cost-allocation
Different network security standards
Lack of proper incentives for TSOs (transmission system
operator) to make cross-border investments
Authorisation procedures Infrastructure management issues
Long, complicated and uncertain authorisation procedures Discrepancy of RES potential and energy demand
Lack of definition of priority between conflicting objectives: Insufficient power system flexibility
RES deployment might be in conflict with nature conservation Inefficient allocation of interconnection capacity
Lack of public acceptance
Figure 11: Main non-technical barriers to RES deployment
Implementation strategies for decision-makers mentation strategies (D5.3). The implementation strategies
are valid for all European regions. Generally, the national
Figure 12 and 13 show implementation strategies for the par- governments need to be active, but guidance and assistance
ticular decision-makers according to the identified technical from the EU Commission is needed. The national TSOs and
and non-technical barriers. The recommendations as listed DSOs (distribution system operator) are involved in many
are not prioritised. A detailed description of milestones and infrastructure development processes and, therefore, play an
recommendations is given in the SUSPLAN Report on imple- important role in these issues.
Involved institutions
National
Implementation strategies EU Commission National regulators TSOs/DSOs
governments
Infrastructure development
Establish common planning procedures X X X X
with time horizon longer than 10 years
Develop a transnational institutional framework X (X)
Develop a long-term vision for offshore wind deployment X (X) (X)
Support the development of coherent network extension X (X) X
plans for the entire EU
Integrate electricity and gas network planning X X X X
Support coordinated development processes on X X
transnational level
Coordinate and integrate infrastructure planning X X
with other planning issues and policy goals
Coordinate grid development efficiently X X
X = primary involvement ( X ) = secondary involvement
Figure 12: Implementation strategies on future infrastructure development
17Involved institutions
National
Implementation strategies EU Commission National regulators TSOs/DSOs
governments
Infrastructure management
Improve coordination between Member States X X
Develop efficient congestion management X X
procedures and harmonised grid codes
Realise time-variable electricity prices for consumers X X
Enhance active network management X X
Ensure active participation of the demand side and the X X
distributed generators in infrastructure management
Authorisation procedures
Provide guidelines on harmonised planning procedures X (X)
Involve the public and NGOs early X X X
in the planning process on local level
Simplify planning processes and develop X (X) (X)
effective planning procedures
Integrate strategic environmental impact X (X) (X)
assessment in planning procedures
Investment and financial issues
Harmonise the regulatory practices of the member states X X (X)
Establish transnational cost allocation and compensation X (X)
mechanisms
Create sufficient incentives for offshore infrastructure X X
deployment
Establish funds for research and development X X
and for infrastructure extension
Enhance research and development on forecasting
of renewable power production, storage technologies X X
and smart grid technologies
X = primary involvement ( X ) = secondary involvement
Figure 13: Implementation strategies on infrastructure management, authorisation procedures and economic issues
Conclusion While more detailed studies are still necessary, it seems clear
that in order to harvest Europe‘s large resources of renewable
SUSPLAN has analysed four different possible futures for Europe energy, major changes are needed in today‘s energy infra-
with much higher shares of renewable energy than today. structures. This can best be obtained through a common vision
These storylines were analysed in several dimensions; in a and a joint strategy of transnational planning, authorisation
bottom-up regional perspective, a top-down transnational and financing procedures.
perspective, with regard to combined electricity and gas infra
structure developments, followed by recommendations for
decision-makers. In the Green storyline, the share of renewable
electricity is the highest with more than 70 per cent and rather
low and uniform electricity prices all over Europe. This is made
possible by large expansion of transnational infrastructure, in
particular the South-West to North-East axis as shown in figure 7.
18Imprint
All SUSPLAN reports can be downloaded at: Publisher
www.susplan.eu Deutsche Energie-Agentur GmbH (dena)
German Energy Agency
Aditionally, the main SUSPLAN results are presented Chausseestr. 128 a, 10115 Berlin, Germany
in the interactive data base accessible at Tel.: +49 (0)30 72 61 65 - 600
www.susplan.eu/userinterface Fax: +49 (0)30 72 61 65 - 699
E-Mail: info@dena.de
Internet: www.dena.de
Editorial office
Deutsche Energie-Agentur GmbH (dena)
German Energy Agency
Dr. Carolin Funk, Jeannette Uhlig, Immo Zoch
Picture proof
Page 7: view 7 / photocase.com
Figure 14: Interactive data base for SUSPLAN results
All rights reserved.
Any use is subject to consent by dena.
Partners
SUSPLAN is coordinated by SINTEF Energy Research Berlin, October 2011
Other project partners include the following:
EEG, Vienna University of Technology, Austria
Fraunhofer ISI, Germany
Energy research Centre of the Netherlands, Netherlands
University of the Highlands and Islands, UK
Verbund AG, Austria
MVV Energie, Germany
Enero, Romania
EC BREC IEO, Poland
Statkraft Western Balkans, Serbia
Comhaire nan Eilean Siar, UK
ENVIROS, Czech Republic
Ricerca Sistema Energetico, Italy
Black Sea Region Energy Centre, Bulgaria
UP Comillas, Spain
dena, Germany
Funding
SUSPLAN is performed in response to call
ENERGY.2007.7.3.5: The research leading to
these results has received funding from the
European Community‘s Seventh Framework
Programme FP7/2007-2013 under grant agree-
ment no 218960.
Contact and further information
Dr. Bjørn H.Bakken
Tel.: +47 73597445
E-Mail: bjorn.h.bakken@sintef.no
www.susplan.eu
19Funded and supported by
www.susplan.euYou can also read