Wastewater 151 - Infrastructure Report Card
←
→
Page content transcription
If your browser does not render page correctly, please read the page content below
Wastewater
151
________
2021 INFRASTRUCTURE REPORT CARD
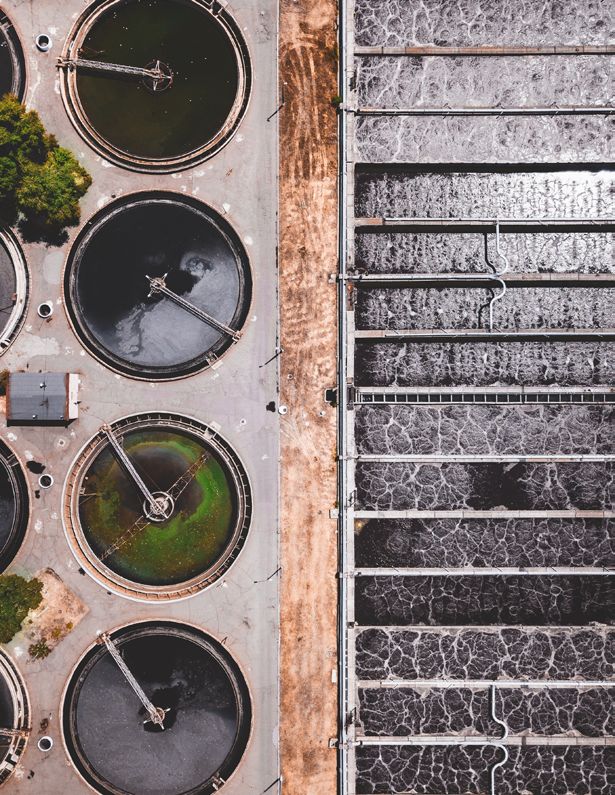
Photo by Ivan Bandura www.infrastructurereportcard.org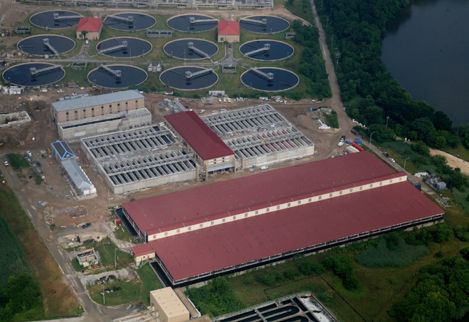
EXECUTIVE SUMMARY
                 The nation’s more than 16,000 wastewater treatment plants are functioning,
                 on average, at 81% of their design capacities, while 15% have reached or
                 exceeded it. Growing urban environments signal a trend that these facilities
                 will increasingly accommodate a larger portion of the nation’s wastewater
                 demand. Though large-scale capital improvements have been made to
                 systems experiencing sanitary sewer overflows, efforts have slowed in
                 recent years. As many treatment plants and collection networks approach
                 the end of their lifespans, the financial responsibilities for operation and
                 maintenance will become more costly. Estimates indicate that utilities
                 spent over $3 billion in 2019, or more than $18 per wastewater customer
                 to replace almost 4,700 miles of pipeline nationwide. Recently, the more
                 prevalent use of asset management plans enables 62% of surveyed utilities
                 to proactively manage wastewater infrastructure maintenance rather than
                 reactively respond to pipeline and equipment failures. In 2019, though the
                 annual water infrastructure capital investment gap is $81 billion, the sector
                 has made strides to address current and future needs through resilience-
                 related planning and innovations that produce profitable byproducts or cost
                 savings from wastewater treatment.

INTRODUCTION
A critical component that influences the well-being of
any community is its system for removing and treating
wastewater for the protection of human and environmental
health. Wastewater infrastructure includes a network of
sewer pipes that collect and carry household, business,
and industrial effluents to wastewater treatment
systems — onsite or centralized facilities. Within these
treatment systems, wastewater undergoes processes to
remove harmful constituents and reduce pollution to the
Environmental Protection Agency (EPA) and/or state-
regulated levels prior to being discharged into nearby                   Photo: rdonar
waterbodies or, in some cases, recovered for water, energy,               AXIAL HYDRODYNAMIC FLOW PUMP IN WASTEWATER PLANT.

and nutrient reuse.

                                                              152
                                                              ________

                                            2021 INFRASTRUCTURE REPORT CARD
                                                 www.infrastructurereportcard.org
CAPACITY
There are more than 16,000 publicly owned wastewater billion gallons of wastewater per day is being treated by
treatment systems of various sizes serving the majority centralized WWTPs. Across all sizes of WWTPs, systems
of wastewater needs in the United States.1 The are operating at an average of 81% of their design
remainder of the population — approximately 20% of capacity, while 15% of systems are at or have exceeded
Americans — rely on onsite wastewater systems such as that threshold.5
septic tanks.2 Although the nation’s population growth
In addition to WWTPs, the nation’s wastewater footprint
projections are modest,3 a 2018 Pew Research Center
also includes a network of over 800,000 miles of public
study expects 86% of this growth to occur in urban and
sewers and an additional 500,000 miles of private
suburban areas.4 Growing urban environments signal
lateral sewers that connect homes and businesses to
a trend that centralized wastewater treatment plants
public sewer lines.6
(WWTP) will increasingly accommodate a larger portion
of the nation’s wastewater demand. Currently, 62.5
CONDITION
The majority of the nation’s WWTPs are designed with Nationwide, the drinking water and wastewater pipes in
an average lifespan of 40 to 50 years, so the systems the ground are on average 45 years old,10 11 while some
that were constructed in the 1970s, around the passing systems have components more than a century old.12 The
of the Clean Water Act in 1972, are reaching the end of typical lifespan expected for wastewater pipes is 50 to 100
their service lives.7 However, smaller onsite systems, such years.13 As collection systems age and decline in condition,
as septic tanks, have a shorter average lifespan of 20 to groundwater and stormwater enters the networks through
30 years.8 Most states do not collect condition data for cracks, joints, or illicit connections as inflow and infiltration.
these smaller systems, so an accurate assessment of the When collection systems are overtaxed, sanitary sewer
remaining lifespan or current condition is nearly impossible overflows (SSOs) can occur. Between 2012 and 2016,
to determine. In 2015, the National Association of Home the EPA reports that improvements were made to more
Builders estimated that the median age of owner-occupied than 180 of the nation’s large sanitary sewer systems,
housing across the U.S. was 37 years old, an indication which typically accommodate over 10 million gallons of
that, without proactive homeowner maintenance, there wastewater per day, and are prone to episodic SSOs.14 In
may be significant needs for upgrading and/or replacing recent years, the progress has slowed.15 Aside from SSOs,
onsite wastewater infrastructure.9 conveyance systems are also susceptible to other failures
like blockages caused by consumer products such as wipes
and paper towels.
In 2015, the National
Association of Home Builders
estimated that the median
age of owner-occupied
housing across the U.S. was
37 years old, an indication
that, without proactive
homeowner maintenance,
there may be significant
needs for upgrading and/or
replacing onsite wastewater
infrastructure.9
153
________
2021 INFRASTRUCTURE REPORT CARD
www.infrastructurereportcard.orgOPERATION & MAINTENANCE
Wastewater infrastructure may be owned by a public, or oversight from state regulatory agencies, if O&M
private, or cooperative entity, and the operation and goes unaddressed, systems may fail, costing homeowners
maintenance (O&M) may be conducted by the same between $3,000 and $7,000.19
party or subcontracted elsewhere. As utilities face
Thousands of miles of the nation’s aging pipes are buried
the challenges of meeting increasingly stringent water
beneath increasingly urbanized cities and will require
quality regulations, funding significant infrastructure
more and more inter-agency collaboration and data
replacements, and affordably providing services amid
sharing, particularly as maintenance needs grow.20 In
growing public and environmental health risks, the
a 2019 American Water Works Association report,
option of merging (utility consolidation) may unlock
as much as 62% of wastewater pipeline maintenance
financial, technical, and managerial resources to meet
performed by combined utilities occurs through the
current needs and adapt to future demands.16
proactive execution of asset management plans; the
According to the U.S. Conference of Mayors, trends remaining 38% is completed as a reactive response to
among municipal WWTPs show that nationwide O&M failures.21 The report goes on to mention, since 2017,
expenditures have increased by approximately 4% annually replacement rates for wastewater collection pipes have
from 1993 to 2017, an increase partially due to deferred essentially stagnated. Nevertheless, in 2020, Bluefield
capital expenditures.17 Depending on the type of WWTP Research estimated that utilities throughout the
and the collection system, O&M spending varies. In rural country will spend more than $3 billion on wastewater
areas where decentralized systems are common, the pipe repairs and replacements, addressing 4,692 miles of
responsibility to coordinate and finance O&M activities wastewater pipeline. This value translates into more than
ranging from $250 to $500 every three to five years falls $18 per wastewater customer, a cost that is projected to
on homeowners.18 However, with little to no instruction grow by an average of 5% annually.22
FUNDING
Wastewater infrastructure may be funded by local user of $504 annually for wastewater collection and treat-
fees and taxes, state-specific grants or discretionary ment.27 28 Since 2008, user rates have trended upward to
set-asides, and federal grants or financing mechanisms. reflect the true cost of service and also due to dwindling
Funding and financing dif- revenues for many waste-
fer through the simple fact Though utilities are seeking to water utilities.29 Though
that infrastructure financ- address affordability challenges utilities are seeking to ad-
ing, like any loan or bond, in vulnerable communities, dress affordability chal-
requires repayment over a lenges in vulnerable com-
30- to 50-year period. 23
decreasing usage due to water munities, decreasing usage
According to the Congres- conservation appliances, persistent due to water conservation
sional Research Service, leaks from aging infrastructure, appliances, persistent leaks
the federal government’s
and increasing inflation have all from aging infrastructure,
share of capital invest- and increasing inflation have
ment has fallen from 63% contributed to the 24% increase in all contributed to the 24%
in 1977 to less than 9% in rates reported from 2008 to 2016. increase in rates reported
2017.24 State and local enti- from 2008 to 2016.30
ties shoulder the majority of capital projects and O&M
Some WWTPs are recouping savings and generating
expenses, which were approximately $20 billion in 1993
profits by implementing innovative technologies that
and increased to $55 billion by 2017.25 26
reuse water, recover energy, and recycle nutrients.31
Nationally, a single-family residence pays an average rate Furthermore, state leaders have turned to levying
154
________
2021 INFRASTRUCTURE REPORT CARD
www.infrastructurereportcard.orglocal taxes, initiating restoration fees, and creating While wastewater utilities are responsible for covering
legislative set-asides as a means to invest in wastewater the majority of their expenses, many also look to federal
infrastructure and to close the funding gap. financing mechanisms, particularly for large capital
projects.
EPA Clean Water State Revolving Fund Appropriations
Appropriations
$1,800
$1,600
$1,400
$1,200
(Millions $)
$1,000
$800 $1,694B $1,694B $1,639B
$1,394B $1,394B
$600 $1, 120B
$400
$200
$0
FY2016 FY2017 FY2018 FY2019 FY2020 FY2021
Wastewater Funding and Financing Mechanisms
Federal Agency Program Details
U.S. Rural Utilities Service: Water and The purpose of this program is to provide basic human amenities, alleviate
Department of Waste Disposal Programs health hazards, and promote the orderly growth of the nation’s rural areas
Agriculture (communities with populations of 10,000 or less) by meeting the need
for new and upgraded drinking water, wastewater, stormwater, and solid
waste infrastructure.
U.S. Community Development Block The program’s primary objective is to develop viable communities by
Department Grants (CDBG) providing decent housing and a suitable living environment, and by
of Housing expanding economic opportunities, principally for persons of low and
and Urban moderate income. Accordingly, CDBG resources are not limited to
Development drinking water, wastewater, and/or stormwater infrastrucure, but these
projects must compete with other eligible activities including historical
preservation, energy conservation, lead-based paint abatement,
and more. The block nature of the CDBG distribution enables local
government’s to exercise discretion and on-the-ground knowledge
when selecting appropriate projects that achieve program objectives.
U.S. Water Infrastructure Finance and Established in 2014, the WIFIA program provides credit assistance through
Environmental Innovation Act Program (WIFIA) long-term, low-cost supplemental loans for regionally and nationally
Protection significant infrastructure projects. WIFIA authorizes EPA to provide credit
Agency assistance directly to an eligible recipient for a broad range of drinking water
and wastewater projects that generally cost $20 million or more.
U.S. Clean Water State Revolving Fund Established in 1987 by amending the Clean Water Act, federal funds
Environmental Loan Program (CWSRF) are directed to CWSRF programs in all 50 states and Puerto Rico to
Protection capitalize state infrastrucutre loans. CWSRF resources must be matched
Agency by 20% state-backed funds. Various projects from CWSRF include new
construction and upgrades of wastewater treatment plants, stormwater
infrastructure, nonpoint source pollution management plans, and more.
155
________
2021 INFRASTRUCTURE REPORT CARD
www.infrastructurereportcard.orgPhoto courtesy of WSP USA
THE BALTIMORE BACK RIVER WASTEWATER TREATMENT PLANT
For instance, the EPA’s Clean Water State Revolving Fund $55.9 billion, indicating that the total, nationwide need
(CWSRF) provides resources to state agencies enabling significantly outpaces available funding.
them to act as “infrastructure banks” that grant funds and
Working in conjunction with EPA’s CWSRF program, the
oversee low-interest loans. CWSRF grants require local
Water Infrastructure and Finance Innovation Act (WIFIA)
entities to put forth a 20% match to the funds requested.
is an additional long-term, low-cost funding mechanism
During FY16 and FY17, Congress assigned funding at
for regionally and nationally significant, large-dollar-value
$1.394 billion, increased that value to $1.694 billion for
projects. From FY17 to FY19, Congress has increased
FY18 and FY19, and then decreased FY20’s amount to
WIFIA’s lending capacity from $2.5 to $6 billion with more
$1.120 billion.32 In 2019, Bluefield Research reports that
than $21 billion being requested for over 150 applicants
state agency requests for CWSRF funding exceeded
During FY16 and FY17, Congress
assigned funding at
$1.394 billion,
increased that value to
$1.694 billion
for FY18 and FY19, and then
decreased FY20’s amount to
$1.120 billion. 32
156
________
2021 INFRASTRUCTURE REPORT CARD
www.infrastructurereportcard.orgnationwide. In FY19, the federal government invited more
than a dozen wastewater and water reuse projects to apply
for over $2.3 billion in loans.
The U.S. Department of Housing and Urban Development
manages the Community Development Block Grants
program under which urban, economically disadvantaged
areas may apply to receive grant funding. However, rural
communities, those that cannot financially bear the
responsibilities of long-term loans, may look to the U.S.
Department of Agriculture’s (USDA) Rural Utilities
Service — Water and Environmental Program — for grant
Photo: Louisville MSD
and financing options tailored particularly for their needs.
THE SOUTHWESTERN PARKWAY COMBINED SEWER
OVERFLOW BASIN PROJECT
FUTURE NEED
In 2019, the total capital spending on water infrastructure
at all levels was approximately $48 billion, while expected lifespans, O&M for water infrastructure
capital investment needs were $129 billion, creating become costlier. In 2019, 90% of the nation’s $104
an $81 billion gap. This underscores a chronic trend of billion O&M funding need was met, leaving an annual
underinvestment in critical water-related infrastructure gap of $10.5 billion. If trends continue, the country will
—drinking water and wastewater systems. With this gap, face a single-year O&M shortfall of $18 billion in 2039.
only 37% of the nation’s total water infrastructure capital
The implications of unaddressed capital and O&M future
needs were met. Assuming the water and wastewater
needs are particularly pervasive within the nation’s
sectors continue along the same path, the total gap will
water-reliant businesses and healthcare industry.
grow to more than $434 billion by 2029.
Economic projections indicate that by 2029, chronic
Also influencing the wastewater sector’s future needs service disruptions would cost water-reliant businesses
are the growing O&M costs that are outpacing available $111 billion and American households a cumulative $378
funding. As system components near or exceed their million in healthcare costs.33
PUBLIC SAFETY
In some communities where legacy infrastructure exists, Additionally, utilities grapple with treating and disposing
wastewater and stormwater systems are integrated into a of byproducts containing contaminants of emerging
combined sewer network. When these areas experience concern such as per- and polyfluoroalkyl substances
heavy rainfall or rapid snowmelt, the capacity of the (PFAS, forever chemicals) or novel biological components
combined system is overtaxed and results in combined (antibiotic-resistant genes).36 37 EPA studies state that
sewer overflows where large volumes of partially treated the PFAS family of chemicals is persistent in both the
or untreated wastewater bypass the treatment process environment and human bodies, which means they are
and enter local waterbodies. According to the EPA, likely to accumulate over time. Furthermore, evidence
there are approximately 860 combined sewer systems shows that exposure to PFAS can lead to adverse human
throughout the country.34 Over the last two decades, health effects. As these threats increase, so too does the
more than 200 of the nation’s largest combined sewer need for costly improvements in wastewater treatment
systems (those serving > 50,000 people) have been systems.38 39
identified and had actions taken to reduce overflow
discharges that degrade water quality.35
157
________
2021 INFRASTRUCTURE REPORT CARD
www.infrastructurereportcard.orgRESILIENCE
Utility managers, WWTP operators, engineers, and critical infrastructure decision-makers are shifting their
elected officials are increasingly incorporating aspects efforts from singularly addressing short-term metrics like
of resilience — a system’s ability to withstand and population growth, capacity demands, and affordability,
adapt to the impacts of natural and/or man-made and are incorporating long-term, resilience-related
disasters — into the design, siting, and planning phases factors into planning such as sea level rise, frequency,
of their wastewater infrastructure. However, the suite intensity, and likelihood of natural disasters, cybersecurity
of wastewater infrastructure vulnerabilities varies by threats, and post-interruption recovery time.41 For
geographic location, type of treatment system, age, instance, the drinking water sector recently set a
and ownership status, so there is not a “one size fits all” resilience precedent that may be instructive for many
solution. wastewater stakeholders. In 2018, resilience planning was
streamlined within drinking water utilities with the signing
For instance, some wastewater systems are in low-lying
of America’s Water Infrastructure Act (AWIA) which
areas that are especially prone to the impacts of flooding,
requires drinking water systems to routinely develop and
while others may be in drought-prone regions or areas with
update Risk and Resilience Assessments and Emergency
increasingly frequent wildfires.40 Rather than continuing
Response Plans.42
to operate under a “business as usual” framework, some
Across all sizes of wastewater treatment systems, technological
and scientific innovations have made significant contributions
to addressing the sector’s challenges.
INNOVATION
Across all sizes of wastewater treatment systems, Antonio, Texas, implemented in-pipe sensors, data was
technological and scientific innovations have made collected to optimize the network’s cleaning schedule,
significant contributions to addressing the sector’s saving thousands of dollars in each location a sensor was
challenges. For example, water conservation appliances installed.43
have reduced the volume of wastewater entering the
Additionally, in recent decades, resource recovery
system, treatment process innovations have more
has increasingly shifted the traditional wastewater
efficiently utilized existing capacity and limited resources,
treatment mindset away from generating a product
and real-time conveyance network monitoring can
solely for disposal but reconceptualizing this “waste” as
pinpoint and prioritize areas suffering from inflow and
a “resource.” Innovations such as anaerobic digestors,
infiltration or in need of O&M.
indirect potable reuse, and biosolids reuse systems
Sensors and monitoring innovations are being installed can recover water, energy, and nutrients from treated
to collect real-time data on the wastewater conveyance wastewater and may contribute to the resilience
network’s condition to inform and prioritize the system’s of treatment facilities, communities, and entire
O&M schedule. After a wastewater utility in San watersheds.44 45
158
________
2021 INFRASTRUCTURE REPORT CARD
www.infrastructurereportcard.orgRECOMMENDATIONS
TO RAISE THE GRADE
· Infrastructure owners should engage in asset management practices across
infrastructure sectors to extend the lifespan of assets and prioritize limited funding.
Wastewater Asset management must include continuous assessment of the condition of assets
and prioritize investment decisions based upon a comprehensive suite of data.
· More collaborations between researchers, technologists, wastewater utilities and
operators, and federal decision-makers will be needed to develop and quickly deploy
effective regulations, systems, public safety education, and policies that address
21st century concerns such as per- and polyfluoroalkyl substances (PFAS, forever
chemicals) or novel biological components.
· Expand EPA’s CWSRF program and the Water Infrastructure and Finance
Innovation Act (WIFIA) with additional long-term, low-cost funding mechanisms
for regionally and nationally significant, large-dollar-value projects.
· Identify new grant programs and funding mechanisms whose goal is to eliminate
and/or decouple the nation’s remaining combined sewer systems.
· Develop a federal grant pilot program for publicly owned wastewater treatment
plants whose purpose is to create or improve waste-to-energy systems that increase
wastewater treatment efficiency.
· Incorporate geographically specific projected impacts of climate change into
wastewater infrastructure planning and long-term funding decisions.
· Utilities should ensure their rates cover the full cost of service including operation,
maintenance, and capital needs; clearly communicate rate increases to the public;
and balance local issues of affordability.
· As all wastewater systems face multiple and increasing natural threats, a rule
similar to America’s Water Infrastructure Act of 2020 should be implemented to
direct utilities to develop, update, and implement vulnerability (risk and resilience
assessments) and emergency response plans.
SOURCES
1. Cybersecurity & Infrastructure Security Agency, “Water and Wastewater Systems
Sector.”
2. U.S. Environmental Protection Agency, “Septic Systems Overview.”
3. The World Bank Group, “Population Growth (Annual %) – United States.”
4. Pew Research Center, Social & Demographic Trends, What Unites and Divides
Urban, Suburban and Rural Communities, May 22, 2018.
5. Interview with Bluefield Research Group on “Segmenting Utility CAPEX – U.S.
Municipal Water Infrastructure Forecast,” September 2019.
6. U.S. Environmental Protection Agency, Office of Research and Development, “State
of Technology for Rehabilitation of Wastewater Collection Systems,” July 2010.
159
________
2021 INFRASTRUCTURE REPORT CARD
www.infrastructurereportcard.orgSOURCES (Cont.)
7. South Dakota Department of Environment and Natural Resources, Division of
Environmental Services, “Recommended Design Criteria Manual,” March 1991.
8. U.S. Environmental Protection Agency, Office of Research and Development,
Wastewater Office of Water, “Onsite Wastewater Treatment Systems Manual,” February 2002.
9. Construction Dive, “NAHB: The Median Age of US Housing Continues to Climb.”
10. Tabuchi H, New York Times, “$300 Billion War Beneath the Street: Fighting to
Replace America’s Water Pipes,” November 10, 2017.
11. Interview with Bluefield Research Group on “Underground Infrastructure: U.S.
Water & Wastewater Pipe Network Forecast, 2019-2028,” November 2019.
12. U.S. Environmental Protection Agency, Office of Wastewater Management, Office
of Water, “Primer for Municipal Wastewater Treatment Systems,” September 2004.
13. U.S. Environmental Protection Agency, Office of Research and Development,
Water Supply and Water Resources Division, “National Database Structure for
Life Cycle Performance Assessment of Water and Wastewater Rehabilitation
Technologies (Retrospective Evaluation),” January 2014.
14. U.S. Environmental Protection Agency, “Former National Compliance Initiative:
Keeping Raw Sewage and Contaminated Stormwater Out of Our Nation’s Waters.”
15. U.S. Environmental Protection Agency, Enforcement and Compliance History Online.
16. US Water Alliance, “Utility Strengthening Through Consolidation: Guiding
Principles for the Water Sector,” 2019.
17. The United States Conference of Mayors, “Local Government Makes Record-
High Investments in Public Water & Sewer Infrastructure.”
18. U.S. Environmental Protection Agency, Septic Systems, “Why Maintain Your
Septic System.”
19. U.S. Environmental Protection Agency, Septic Systems, “Why Maintain Your
Septic System.”
20. Black & Veatch Management Consulting, LLC, 2018-2019 “50 Largest Cities
Water & Wastewater Rate Survey,” 2019.
21. American Water Works Association, “AWWA Utility Benchmarking:
Performance Management for Water and Wastewater,” 2019.
22. Interview with Bluefield Research on “Underground Infrastructure: U.S. Water &
Wastewater Pipe Network Forecast, 2019-2028,” published November 2019.
23. Congress of the United States, Congressional Budget Office, “Federal Support for
Financing State and Local Transportation and Water Infrastructure,” October 2018.
24. American Society of Civil Engineers, “The Economic Benefits of Investing in Water
Infrastructure: How a Failure to Act Would Affect the U.S. Economy Recovery.”
25. Congressional Research Service, “Federally Supported Water Supply and
Wastewater Treatment Programs,” May 3, 2019.
26. The United States Conference of Mayors, “$125.5 Billion – Record Spending on
Municipal Water and Sewer by Cities in 2017,” November 1, 2019.
160
________
2021 INFRASTRUCTURE REPORT CARD
www.infrastructurereportcard.orgSOURCES (Cont.)
27. The National Association of Clean Water Agencies, “Cost of Clean Water Index,” 2018.
28. Black & Veatch Management Consulting, LLC, 2018-2019 “50 Largest Cities
Water & Wastewater Rate Survey,” 2019.
Wastewater
29. The United States Conference of Mayors, “$125.5 Billion – Record Spending on
Municipal Water and Sewer by Cities in 2017,” November 1, 2019.
30. U.S. Department of Energy, Office of Energy Efficiency & Renewable Energy,
“Water and Wastewater Annual Price Escalation Rates for Selected Cities Across
the United States,” September 2017.
31. The World Bank, “Wastewater: A Resource that Can Pay Dividends for People, the
Environment, and Economies, Says World Bank,” March 19, 2020.
32. Congressional Research Service, “Federally Supported Projects and Programs for
Wastewater, Drinking Water, and Water Supply Infrastructure,” July 30, 2020.
33. American Society of Civil Engineers, “The Economic Benefits of Investing in Water
Infrastructure: How a Failure to Act Would Affect the U.S. Economy Recovery.”
34. U.S. Environmental Protection Agency, National Pollutant Discharge Elimination
System (NPDES), “Combined Sewer Overflow Frequent Questions.”
35. U.S. Environmental Protection Agency, Enforcement, “Former National
Compliance Initiative: Keeping Raw Sewage and Contaminated Stormwater Out of
Our Nation’s Waters.”
36. U.S. Environmental Protection Agency, PFOA, PFOS and Other PFASs, “Basic
Information on PFAS.”
37. U.S. Environmental Protection Agency, Science Inventory, “Detection of
Emerging, Clinically Relevant Antibiotic Resistance Genes in Wastewater from
Treatment Plants in Urban and Rural Areas in the United States.”
38. American Society of Civil Engineers, “The Economic Benefits of Investing in Water
Infrastructure: How a Failure to Act Would Affect the U.S. Economy Recovery.”
39. Water Environment Federation, “Current Priority: PFAS.”
40. U.S. Environmental Protection Agency, “Case Study and Information Exchange.”
41. Committee on Adaptation to a Changing Climate, Ayyub BM, ed., “Climate-
Resilient Infrastructure: Adaptive Design and Risk Management,” Published online
October 2, 2018.
42. U.S. Environmental Protection Agency, Water Resilience, “America’s Water
Infrastructure Act: Risk Assessments and Emergency Response Plans.”
43. Water Online, “’Massive Savings’ Earn SAWS Recognition as Insightful Utility and
Among Top 10 Utility Papers Presented At WEFTEC19*,” September 26, 2019.
44. U.S. Environmental Protection Agency, “Mainstreaming Potable Water Reuse in the
United States: Strategies for Leveling the Playing Field,” April 2018.
45. The Water Research Foundation, “Resource Recovery”
161
________
2021 INFRASTRUCTURE REPORT CARD
www.infrastructurereportcard.orgYou can also read