Long-Term Groundwater Depletion in the United States
←
→
Page content transcription
If your browser does not render page correctly, please read the page content below

Rapid Communication/

Long-Term Groundwater Depletion
in the United States
by Leonard F. Konikow

    Abstract
         The volume of groundwater stored in the subsurface in the United States decreased by almost 1000 km3
    during 1900–2008. The aquifer systems with the three largest volumes of storage depletion include the High
    Plains aquifer, the Mississippi Embayment section of the Gulf Coastal Plain aquifer system, and the Central Valley
    of California. Depletion rates accelerated during 1945–1960, averaging 13.6 km3 /year during the last half of the
    century, and after 2000 increased again to about 24 km3 /year. Depletion intensity is a new parameter, introduced
    here, to provide a more consistent basis for comparing storage depletion problems among various aquifers by
    factoring in time and areal extent of the aquifer. During 2001–2008, the Central Valley of California had the
    largest depletion intensity. Groundwater depletion in the United States can explain 1.4% of observed sea-level
    rise during the 108-year study period and 2.1% during 2001–2008. Groundwater depletion must be confronted
    on local and regional scales to help reduce demand (primarily in irrigated agriculture) and/or increase supply.

Introduction                                                            extrapolating depletion trends into the future. This then
     Removal of water from storage in porous media is a                 can serve as a basis for deciding whether management
natural consequence of well withdrawals of groundwater                  intervention is needed and which types of actions are
(see Theis 1940). The decrease in volume of stored                      feasible and most beneficial relative to costs.
groundwater is termed “depletion.” Groundwater storage                       Groundwater depletion can have a number of detri-
depletion is becoming recognized as an increasingly                     mental effects. These include reduced well yields,
serious global problem that threatens the sustainability                increased pumping costs, needs to drill deeper wells, irre-
of water supplies and critical ecosystems (e.g., Konikow                versible land subsidence, reduced base flow to springs,
and Kendy 2005; Gleeson et al. 2010; Schwartz and                       streams, and other surface water bodies, and loss of
Ibaraki 2011; Gleeson et al. 2012). While long-term                     wetlands (Alley et al. 1999; Bartolino and Cunning-
groundwater depletion is driven largely by overexploita-                ham 2003; Konikow and Kendy 2005). Depletion effects
tion (i.e., large and unsustainable withdrawals by wells),              can, in turn, lead to land-use changes (e.g., Harrington
shorter term local to regional trends in depletion may be               et al. 2007). Reduced groundwater discharge can dam-
dominated by natural variability over months to years in                age aquatic ecosystems. Land subsidence can cause costly
precipitation and recharge. Thus, establishing long-term                infrastructure damage (Galloway et al. 1999). The quality
trends in depletion over periods of many decades and                    of groundwater in the presence of substantial depletion
climate variability cycles is required to demonstrate the               can also deteriorate because of sea water intrusion and/or
anthropogenic linkage and to provide a sound basis for                  induced leakage from low-permeability confining units
                                                                        that contain poorer quality groundwater. The effects of
     431 National Center, U.S. Geological Survey, Reston, VA 20192;     continued depletion combine to make groundwater sup-
703-648-5878; fax: 703-648-5274; lkonikow@usgs.gov                      plies unsustainable in the long term (e.g., Custodio 2005;
     There are no conflicts of interest and no financial disclosures.
                                                                        Van der Gun and Lipponen 2010).
     Received October 2014, accepted October 2014.
     Published 2014. This article is a U.S. Government work and is           Groundwater depletion can be characterized or mea-
in the public domain in the USA.                                        sured in two ways. First, water-level declines are a direct
     doi: 10.1111/gwat.12306                                            consequence of depletion and their magnitude provides

2        Vol. 53, No. 1–Groundwater–January-February 2015 (pages 2–9)                                                   NGWA.org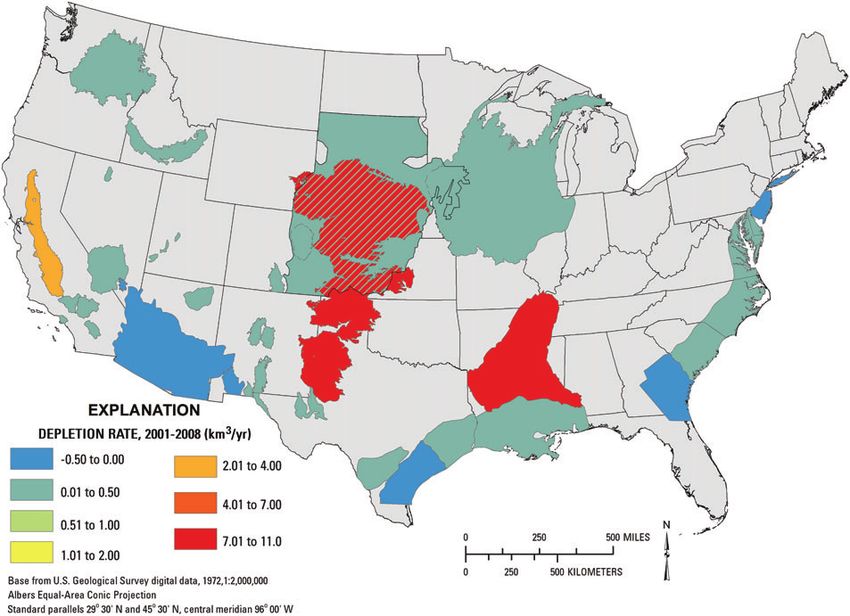
evidence for the seriousness of a depletion problem.           estimate the annual and total cumulative depletion dur-
Water-level declines in the United States from prede-          ing the study period. Most assessed areas are west of the
velopment through 2007 were mapped by Reilly et al.            Mississippi River. The analyses indicate that the cumula-
(2008) and show that substantial depletion occurs, at          tive depletion volume during the 20th century was about
least locally, throughout the nation. However, by defi-        800 km3 . The total depletion increased to almost 1000 km3
nition, depletion represents a change in the volume (and       by the end of 2008—a 25% increase in just 8 years!
mass) of water stored in the subsurface, so the second              During 1950–2005, about 15% of the total U.S. with-
approach is to characterize groundwater depletion in terms     drawals were derived from (or balanced by) groundwater
of volumetric changes. Because volumetric assessments          storage depletion (Konikow and Leake 2014). For just
are difficult to integrate over the area of an aquifer, they   2005, the depletion component had increased to 19%.
have rarely been done or documented, except for some                The magnitudes of depletion volume vary greatly
regional systems where transient three-dimensional flow        across the United States (Konikow 2013; Figure S1). The
models have been well calibrated for time periods starting     three largest volumes of groundwater storage depletion
with early in development or those where the recogni-          occur in the High Plains aquifer, the Mississippi Embay-
tion of the problem has led to comprehensive monitoring        ment section of the Gulf Coastal Plain aquifer system, and
programs.                                                      the Central Valley of California. Combined, the depletion
     Large changes in groundwater volume can also be           in these three systems accounts for two-thirds of the total
detected as a change in mass using a time series of            depletion in the United States. In contrast, two western
accurate gravity measurements. Where all (or a well-           volcanic aquifer systems (Snake River Plain and Columbia
characterized part) of the regional change in mass can be      Plateau aquifer systems) have shown long-term cumula-
attributed solely to changes in the volume of groundwater      tive increases in the volume of groundwater stored (i.e.,
in storage, groundwater depletion can be estimated from        negative depletion), mostly because of increased recharge
these gravity measurements (e.g., Tiwari et al. 2009;          arising from infiltration of irrigation water derived from
Famiglietti et al. 2011; Castle et al. 2014). However, these   imported surface water sources.
gravity methods cannot look back before the start of the            The total long-term depletion volume is equivalent to
time series of gravity measurements, which started in 2002     about twice the volume of water contained in Lake Erie.
for the GRACE satellites.                                      Extracted groundwater can transfer through any number of
     This study evaluates long-term changes in ground-         pathways through the hydrologic cycle. Regardless of the
water storage in the United States for 1900–2008,              pathway and travel time, however, the ultimate sink for
and expands on the results of Konikow (2011, 2013).            the great majority of the depletion volume is the oceans
In aquifer systems not explicitly evaluated herein, the        (Wada et al. 2010; Konikow 2011). The long-term net
changes in storage were either small or indeterminate          depletion volume is large enough that it can represent a
based on available data. The analysis brings together          significant transfer of water mass from land to sea. If the
information from the literature and from new analyses,         U.S. depletion volume is spread over the surface area of
directly estimating net depletion using calibrated ground-     the oceans, it alone would account for a sea-level rise
water models, analytical approaches, and/or volumetric         (SLR) of 2.8 mm. This represents about 1.4% of observed
budget analyses for multiple aquifer systems. Methods          SLR during the 108-year time period.
applied to individual aquifer systems are described in
more detail by Konikow (2013).
                                                               Rates of Depletion
                                                                    Groundwater storage depletion can also be assessed
Volumetric Groundwater Depletion                               and compared in terms of rates—volumetric changes per
     Groundwater withdrawals in the United States have         unit time. The volumetric rates of groundwater depletion
increased dramatically during the 20th century—more            in the 40 study areas during the 20th century were
than doubling from 1950 through 1975 (Hutson et al.            consistently less than 3.0 km3 /year (Figure 1) in individual
2004). In 2005, total groundwater withdrawals were about       systems, but totaled about 8.0 km3 /year for the entire
114 km3 /year and the cumulative withdrawals from 1950         United States (in this and subsequent maps, Hawaii
to 2005 were approximately 5340 km3 (Kenny et al.              and Alaska are not shown because of the relatively
2009). With increasing groundwater use, one might expect       small magnitude of depletion in Hawaii and negligible
increased groundwater depletion.                               depletion in Alaska). The U.S. depletion rate increased
     The long-term volumetric depletion in the United          from 2.4 km3 /year during the first half of the 20th century
States during 1900–2008 was estimated for 40 separate          to 13.6 km3 /year during the last half of the century
aquifers and/or subareas, as well as for one broad dif-        (Figure S4).
fuse land-use category representing agricultural and land           The highest depletion rate in a single system during
drainage where the water table has been permanently low-       this 100-year period is in the High Plains aquifer (about
ered (Konikow 2013; Table S1, Supporting Information).         2.6 km3 /year). However, there was a large variation over
The areas selected included systems where data indicated       time and space. For example, in the Nebraska part
that substantial changes in the volume of groundwater          of the northern High Plains, small water-table rises
stored were occurring and where data were sufficient to        occurred in parts of this area and the net depletion was

NGWA.org                                          Vol. 53, No. 1–Groundwater–January-February 2015 (pages 2–9)            3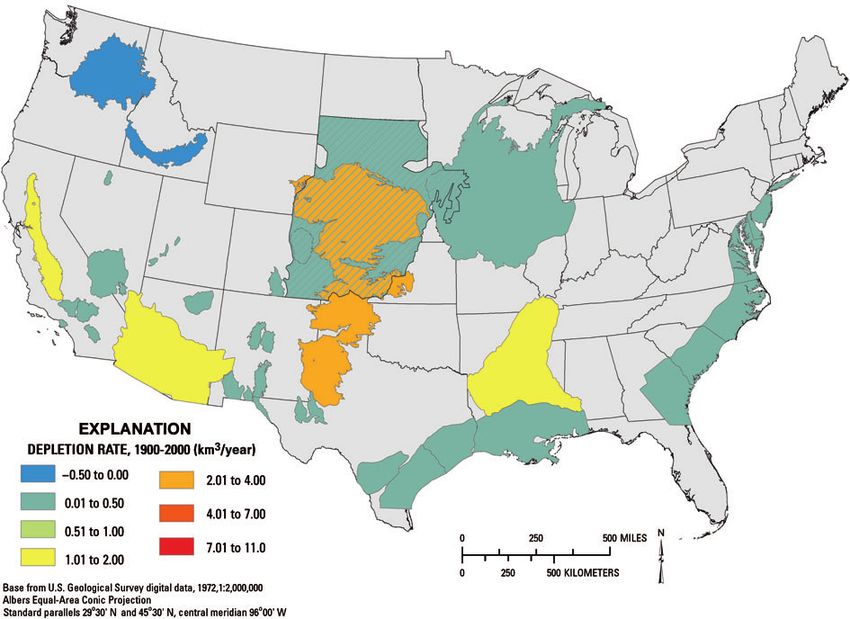
Figure 1. Average groundwater depletion rate during 1900–2000 in 40 assessed aquifer systems or subareas in the
conterminous 48 states.

negligible. In contrast, in the Texas part of the southern   in both the Columbia Plateau and Snake River Plain
High Plains, development of groundwater resources            aquifer systems).
was more extensive and the depletion rate averaged                During 1900–2000, the average groundwater deple-
1.6 km3 /year. Similarly, the majority of depletion in the   tion rate in the United States of about 8.0 km3 /year can
Central Valley occurs in the southern third of the area      explain 0.022 mm/year of SLR. During 2001–2008, the
in the Tulare Basin (San Joaquin Valley). The three          average groundwater depletion rate in the United States
next highest rates of depletion were observed in the         was 23.9 km3 /year, which can explain 0.066 mm/year of
Mississippi embayment (1.2 km3 /year), the Central Valley    SLR. The observed rate of SLR increased from about
of California (1.1 km3 /year), and the alluvial basins of    1.7 mm/year during the 20th century (Church and White
Arizona (1.05 km3 /year). Of the two volcanic systems        2006) to about 3.1 mm/year during 1993–2003 (Bindoff
showing net water-table rises during the 20th century, the   et al. 2007). Thus, although the rate of SLR has increased,
Snake River Plain had the larger negative depletion rate     the relative growth of groundwater depletion in the United
(−0.4 km3 /year), whereas the Columbia Plateau aquifers      States has increased even more, so that the percentage of
averaged −0.05 km3 /year).                                   SLR that can be explained by groundwater depletion in
     During the last 8 years of the study period             the United States has increased from 1.3% during the 20th
(2001–2008), some marked changes occurred and                century to 2.1% during 2001–2008.
the time-averaged depletion rate for the United States
increased to 23.9 km3 /year. The highest rates occur in
the High Plains aquifer (10.2 km3 /year), the Mississippi    Depletion Intensity
embayment (8.0 km3 /year), and the Central Valley                 Another way to assess the magnitude of aquifer
of California (3.9 km3 /year) (Figure 2). Depletion in       depletion, as well as to provide a better basis of com-
the alluvial basins of Arizona—on the whole—was              parisons between different areas, is to normalize the
reversed, and averaged about −0.4 km3 /year during this      depletion volume by time and for the areal extent of
most recent 8-year period. These substantial changes in      the aquifer. This new measure is termed the depletion
Arizona most likely arose from a combination of factors,     intensity and has dimensions of L/T. The depletion inten-
including changes in water management and water use          sity differs from the groundwater footprint introduced
practices after 1980, importation of Colorado River water    by Gleeson et al. (2012) in that the latter is essentially
since 1985, and the implementation of artificial recharge    a water balance that relates groundwater withdrawals
programs (Galloway et al. 1999). During 2001–2008,           to recharge and base flow discharge without directly
the trends of increasing groundwater storage in the          assessing changes in storage. However, depletion intensity
two volcanic aquifer systems was reversed; both now          assesses changes in storage without assessing the imbal-
experienced net decreases in the volumes of groundwater      ance between recharge and discharge that leads to storage
in storage (a depletion rate averaging about 0.2 km3 /year   depletion. Both measures are useful in their own way.

4      Vol. 53, No. 1–Groundwater–January-February 2015 (pages 2–9)                                          NGWA.org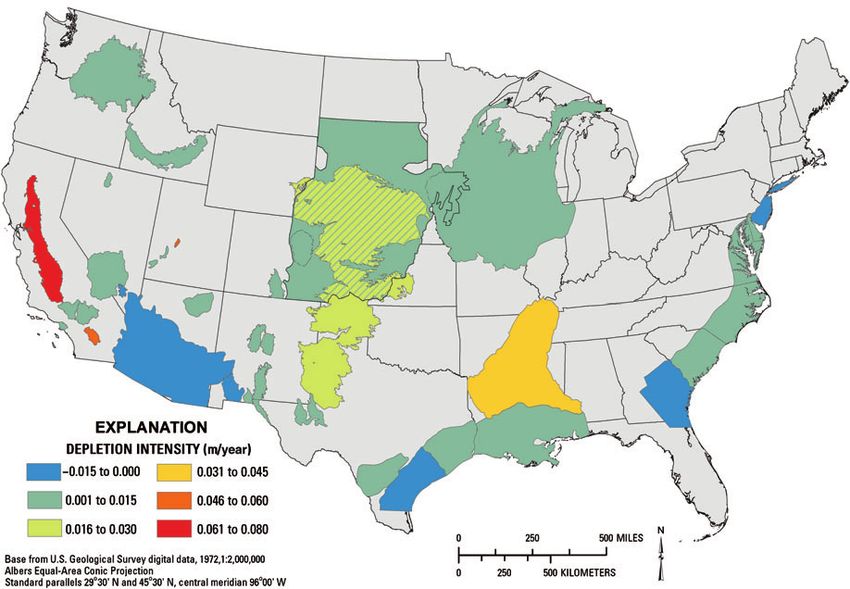
Figure 2. Average groundwater depletion rate during 2001-2008 in 40 assessed aquifer systems or subareas in the
conterminous 48 states.

     The normalization by aquifer area reduces the              wells) mean that more energy (and cost) is required to
apparent variability in groundwater depletion; depletion        lift water, and for a given pump the same expenditure of
intensity in the United States during the 20th century          energy for a greater lift will yield less water. Maintaining
(Figure 3) is generally more uniform than either depletion      steady levels of groundwater extraction, even temporarily,
volumes or depletion rates. For 1900–2000, the highest          may require a substantial expense for deepening existing
depletion intensities were in three relatively small basins     wells or drilling new deeper replacement wells. Together
located in southern California.                                 with other costs and consequences of groundwater
     Depletion intensities changed markedly after 2000          depletion, these physical and economic factors should
(Figure 4). During the beginning of the 21st century,           result in an eventual reduction in groundwater with-
the greatest depletion intensity occurs in the Central          drawals in depleting aquifers. Although there are some
Valley of California, where the aquifer-wide depletion          local examples where storage depletion and persistent
intensity averaged 0.075 m/year. The next highest values        water-level declines are at least a contributing factor to
occur in the Coachella Valley of California and the             reduced pumpage, which in turn should slow down the
Pahvant Valley of Utah. The Mississippi embayment               rate of depletion, for the United States as a whole there
aquifer system exhibits the next largest depletion intensity,   is little indication that this self-limitation on continued
followed by the High Plains aquifer, where the high             depletion is yet in force. Although groundwater depletion
volume of depletion storage depletion is moderated              affects the sustainability of groundwater development,
by the large areal extent of this aquifer system. The           ultimately groundwater depletion itself is unsustainable.
depletion intensity during 2001–2008 in the High Plains              If groundwater depletion persists in an aquifer, at
aquifer system was 0.028 m/year—only about one-third            some time the ability of the aquifer to supply water
of that in the Central Valley. Consideration needs to be        will be adversely affected. In some areas where ground-
given to developing improved water management and               water depletion has continued for decades, well yields
depletion mitigation strategies in critical areas having high   have decreased so much that agricultural production is
depletion intensities.                                          adversely affected because farmers must reduce their
                                                                irrigated acreage, reduce the seasonal irrigation volumes,
                                                                or cease irrigation altogether (Scanlon et al. 2012;
Discussion                                                      Steward et al. 2013).
    Groundwater depletion is manifested by water-level               What does the future hold? Substantial popu-
declines. Thus, well yields in unconfined aquifers should       lation growth over the next several decades seems
decrease over time with continuing depletion because            highly likely, and this would represent a major driving
decreased saturated thickness translates into decreased         force for increasing the demand for food, energy, and
aquifer transmissivity. Furthermore, in all types of            water supply. This is a water security issue of both
aquifers reduced heads (and lowered water levels in             a national and global scope (e.g., see Braga et al.

NGWA.org                                           Vol. 53, No. 1–Groundwater–January-February 2015 (pages 2–9)           5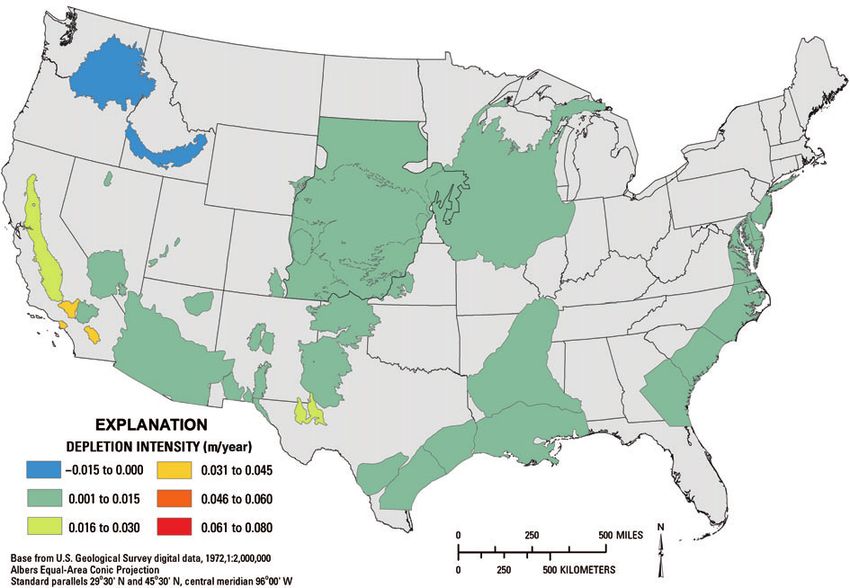
Figure 3. Groundwater depletion intensity during 1900–2000 in 40 assessed aquifer systems or subareas in the conterminous
48 states.

Figure 4. Groundwater depletion intensity during 2001–2008 in 40 assessed aquifer systems or subareas in the conterminous
48 states.

2014). The sustainability of groundwater supplies is          (also see Van der Gun and Lipponen 2010). Success
key in continuing to meet the present demand and in           in controlling or mitigating groundwater depletion will
meeting future increased demands, and such sustain-           require a comprehensive and integrative approach to
ability is threatened by continued groundwater storage        these many factors. Furthermore, the hydrology and
depletion.                                                    hydrodynamics of aquifers dictates that aquifers respond
     Can we, and should we, take steps to control             to stresses at local to regional scales, and optimal
and/or limit future groundwater depletion or to reverse       management will require local and regional cooperation
historical depletion? This is a complex issue because the     and action (also see Llamas and Martinez-Santos 2005).
scientific and technical issues controlling groundwater       Any changes in national policies must recognize that
storage changes are intertwined with political, legal,        local groundwater conditions are highly variable, as is
management, and socioeconomic issues and constraints          groundwater governance, and a single technical approach

6      Vol. 53, No. 1–Groundwater–January-February 2015 (pages 2–9)                                           NGWA.org
may not be suitable or optimal for all aquifers. From the 2001–2008, the depletion rate in the High Plains aquifer
perspective of technical approaches to mediating deple- increased to 10.2 km3 /year. The two volcanic aquifer sys-
tion problems, water managers will have to take actions tems in the northwestern United States (Columbia Plateau
to directly or indirectly (1) reduce demand (primarily in and Snake River Plain), which had experienced substan-
irrigated agriculture) through increased efficiencies, tax tial water-level rises during the 20th century, had a trend
or cost incentives (or disincentives), well permitting, and reversal during 2001–2008, when they both experienced
by fostering changes in land use, industry, and popula- net depletion rates of about 0.2 km3 /year.
tion, and (2) increase supply through managed aquifer Depletion intensity is a new parameter—introduced
recharge, desalination, developing alternative sources, and in this study—to better characterize groundwater storage
other means. depletion. It normalizes the depletion volume by time
Groundwater flow is slow, especially relative to and aquifer area, thereby offering a consistent measure
surface water systems or the atmosphere. Similarly, prop- to compare depletion magnitude among various aquifer
agation of stresses and responses in groundwater systems systems. The greatest depletion intensity in the United
are generally much slower than in surface water sys- States during 2001–2008 occurs in the Central Valley
tems or the atmosphere. Moreover, groundwater residence of California, indicating that, on the basis of this
times are typically much greater than surface water res- measure, this may be the system having the most serious
idence times as well. These general characteristics mean groundwater depletion problem in the United States.
that critical problems in groundwater systems are rela- Because of its large areal extent, the High Plains aquifer
tively slow to spread, slow to be noticed, and slow to system, often cited as one of the most impacted, would
be remedied (e.g., see Alley et al. 2002; Bredehoeft and rank only fifth according to this measure.
Durbin 2009; Walton 2011). Therefore, planning, poli- Long-term groundwater depletion represents a large
cies, and actions must take a long-term view, recognize transfer of water from the continents to the oceans.
the hydraulic interconnection between surface water and Thus, groundwater depletion represents a small but
groundwater, and strive for beneficial results over periods nontrivial contributor to SLR. Depletion in the United
of many years or decades. States alone can explain more than 2% of observed SLR
during 2001–2008, and global depletion would explain
substantially more than that. Groundwater depletion needs
Conclusions to be accounted for when estimating water budgets to
Data from detailed analyses of 40 aquifer systems explain past sea-level change or predicting future sea-level
having substantial groundwater storage changes during change.
the 108-year time period of 1900–2008 showed a Aquifers can serve as large reservoirs to provide
variation in responses. Only two aquifer systems (the a reliable long-term source of water supply—either as a
Columbia Plateau and Snake River Plain aquifer systems primary source or to supplement surface water sources
in the northwestern United States) experienced substantial in times of increased climate uncertainty and resource
increases in water stored, primarily because of increased variability. Actions to limit or even reverse groundwater
irrigation using diverted surface water, which caused storage depletion at a minimum would extend the useful
groundwater recharge to increase above natural rates. life of an aquifer as a source of water supply and with
However, most aquifer systems with changes showed greater effect perhaps even create a new sustainable
a net depletion, often a substantial one. From 1900 to balance. Thus, with increasing demands for water likely
2008, the volume of groundwater stored in aquifers in to occur in the future, such actions would seem to
the United States has decreased by about 1000 km3 , be highly desirable in many currently depleted aquifer
a magnitude indicating that groundwater depletion is systems throughout the nation. Management actions can
a serious problem. The aquifer systems with the three only focus on some combination of reducing demand and
largest volumes of storage depletion include the High increasing supply, and there are a number of ways—both
Plains aquifer, the Mississippi Embayment section of the politically and technologically—to achieve both goals.
Gulf Coastal Plain aquifer system, and the Central Valley The important thing is that beneficial actions to offset or
of California. remediate the substantial national problem of groundwater
Rates of groundwater depletion increased most storage depletion be taken to assure our future water
notably after the mid-1940s, mostly driven by increased security.
use of groundwater as a water source for irrigated
agriculture, which in turn is related to rural electrifica-
tion, availability of more efficient submersible pumps, Acknowledgments
better well drilling technology, and general economic E.A. Achey, S.M. Feeney, D.P. McGinnis, and J.J.
growth at that time. The trend in the rates of depletion Donovan assisted with analyses and calculations for
more or less stabilized at relatively high rates averag- some of the aquifer systems. The author benefited from
ing about 14 km3 /year from about 1960 through 2000. insightful discussions with numerous USGS colleagues
After 2000, the average rate of groundwater depletion in and with the late Prof. T.N. Narasimhan. The author also
the United States increased again—to an average rate of appreciates the helpful review comments and suggestions
almost 24 km3 /year during 2001–2008 inclusive. During of C.C. Faunt, H.M. Haitjema, and K.A. Uhlman.
NGWA.org Vol. 53, No. 1–Groundwater–January-February 2015 (pages 2–9) 7This work was supported by funding from the U.S. Famiglietti, J.S., M. Lo, S.L. Ho, J. Bethune, K.J. Anderson,
Geological Survey’s National Research Program, Office T.H. Syed, S.C. Swenson, C.R. de Linage, and M. Rodell.
of Groundwater, and Groundwater Resources Program. 2011. Satellites measure recent rates of groundwater deple-
tion in California’s Central Valley. Geophysical Research
Letters 38: L03403. DOI:10.1029/2010GL046442.
Galloway, D.L., D.R. Jones, and S.E. Ingebritsen (Eds). 1999.
Supporting Information Land Subsidence in the United States. Reston, Virginia: U.S.
Additional Supporting Information may be found in the Geological Survey Circular 1182.
online version of this article: Gleeson, T., J. VanderSteen, M.A. Sophocleus, M. Taniguchi,
W.M. Alley, D. Allen, and Y. Zhou. 2010. Groundwater
Table S1. Groundwater storage depletion in aquifer sustainability strategies. Nature Geoscience 3: 378–379.
systems, subareas, or by land-use category, United States Gleeson, T., Y. Wada, M.F.P. Bierkens, and L.P.H. van Beek.
(1900–2008). 2012. Water balance of global aquifers revealed by ground-
water footprint. Nature 488: 197–200. DOI:10.1038/
Figure S1. Map of the United States (excluding Alaska) nature11295.
showing cumulative groundwater depletion, 1900–2008, Harrington, L., J. Harrington Jr., and N. Kettle. 2007. Ground-
in 40 assessed aquifer systems or subareas. water depletion and agricultural land use change in
Figure S2. Annual cumulative groundwater depletion in the High Plains: A case study from Wichita County,
the United States, 1900–2008. Kansas. The Professional Geographer 59, no. 2: 221–235.
Figure S3. Change in the average groundwater depletion DOI:10.1111/j.1467-9272.2007.00609.x.
Hutson, S.S., N.L. Barber, J.F. Kenny, K.S. Linsey, D.S. Lumia,
rates from 1961–1980 to 2001–2008 in 40 assessed and M.A. Maupin. 2004. Estimated Use of Water in the
aquifer systems or subareas in the conterminous 48 states. United States in 2000 . Reston, Virginia: U.S. Geological
Figure S4. Five-year averaged rate of groundwater Survey Circular 1268.
depletion in the U.S., 1900–2008. Kenny, J.F., N.L. Barber, S.S. Hutson, K.S. Linsey, J.K.
Figure S5. Change in groundwater depletion intensity Lovelace, and M.A. Maupin. 2009. Estimated use of
from 1900–2000 to 2001–2008 in 40 assessed aquifer water in the United States in 2005 . Reston, Virginia: U.S.
Geological Survey Circular 1344.
systems or subareas in the conterminous 48 states. Konikow, L.F. 2011. Contribution of global groundwater deple-
tion since 1900 to sea-level rise. Geophysical Research
Letters 38: L17401. DOI:10.1029/2011GL048604.
References Konikow, L.F. 2013. Groundwater Depletion in the United States
Alley, W.M., T.E. Reilly, and O.L. Franke. 1999. Sustainability (1900–2008). Reston, Virginia: U.S. Geological Survey
of Groundwater Resources. Reston, Virginia: U.S. Geolog- Scientific Investigations Report 2013–5079.
ical Survey Circular 1186. Konikow, L.F., and E. Kendy. 2005. Groundwater depletion—A
Alley, W.M., R.W. Healy, J.W. LaBaugh, and T.E. Reilly. 2002. global problem. Hydrogeology Journal 13, no. 1: 317–320.
Flow and storage in groundwater systems. Science 296: DOI:10.1007/s10040-004-0411-8.
1985–1990. DOI:10.1126/science.1067123. Konikow, L.F., and S.A. Leake. 2014. Depletion and capture:
Bartolino, J.R., and W.L. Cunningham. 2003. Ground-water revisiting “the source of water derived from wells.” Ground
Depletion across the Nation. Reston, Virginia: U.S. Geo- Water 52, no. S1: 100–111. DOI:10.1111/gwat.12204.
logical Survey Fact Sheet 103–03. Llamas, M.R., and P. Martinez-Santos. 2005. The silent
Bindoff, N.L., J. Willebrand, V. Artale, A. Cazenave, J.M. revolution of intensive ground water use: Pros and cons.
Gregory, S. Gulev, K. Hanawa, C. Le Quéré, S. Levitus, Ground Water 43, no. 2: 161.
Y. Nojiri, C.K. Shum, L.D. Talley, and A.S. Unnikrishnan. Reilly, T.E., K.F. Dennehy, W.M. Alley, and W.L. Cunningham.
2007. In Observations–Oceanic climate change and sea 2008. Ground-water Availability in the United States.
level. Climate Change 2007—The Physical Science Basis; Reston, Virginia: U.S. Geological Survey Circular 1323.
Contribution of Working Group I to the Fourth Assessment Scanlon, B.R., C.C. Faunt, L. Longuevergne, R.C. Reedy, W.M.
Report of the Intergovernmental Panel on Climate Change, Alley, V.L. McGuire, and P.B. McMahon. 2012. Ground-
ed. S. Solomon, D. Qin, M. Manning, Z. Chen, M. Marquis, water depletion and sustainability of irrigation in the US
K.B. Averyt, M. Tignor, and H.L. Miller, 385–432. High Plains and Central Valley. Proceedings of the National
Cambridge, UK: Cambridge University Press. Academy of Sciences of the United States of America 109,
Braga, B., C. Chartres, W.J. Cosgrove, L.V. da Cunha, P.H.
no. 24: 9320–9325. DOI:10.1073/pnas.1200311109.
Gleick, P. Kabat, M.A. Kadi, D.P. Loucks, J. Lundqvist, S.
Schwartz, F.W., and M. Ibaraki. 2011. Groundwater—A
Narain, and J. Xia. 2014. Water and the Future of Humanity:
resource in decline. Elements 7: 175–179. DOI:10.2113/
Revisiting Water Security. Lisbon: Calouste Gulbenkian
Foundation; New York: Springer International. gselements.7.3.175.
Bredehoeft, J.D., and T.J. Durbin. 2009. Ground water Steward, D.R., P.J. Bruss, X. Yang, S.A. Staggenborg, S.M.
development—The time to full capture problem. Ground Welch, and M.D. Apley. 2013. Tapping unsustainable
Water 47, no. 4: 506–514. DOI:10.1111/j.1745-6584.2008. groundwater stores for agricultural production in the High
00538.x. Plains Aquifer of Kansas, projections to 2110. Proceedings
Castle, S.L., B.F. Thomas, J.T. Reager, M. Rodell, S.C. of the National Academy of Sciences of the United States
Swenson, and J.S. Famiglietti. 2014. Groundwater depletion of America 110, no. 37: E3477–E3486. DOI:10.1073/pnas.
during drought threatens future water security of the 1220351110.
Colorado River Basin. Geophysical Research Letters 41: Theis, C.V. 1940. The source of water derived from wells—
5904–5911. DOI:10.1002/2014GL061055. Essential factors controlling the response of an aquifer to
Church, J.A., and N.J. White. 2006. A 20th century acceleration development. Civil Engineering 10: 277–280.
in global sea-level rise. Geophysical Research Letters 33: Tiwari, V.M., J. Wahr, and S. Swenson. 2009. Dwindling
L01602. DOI:10.1029/2005GL024826. groundwater resources in northern India, from satellite
Custodio, E. 2005. Intensive use of ground water and sustain- gravity observations. Geophysical Research Letters 36:
ability. Ground Water 43, no. 3: 291. L18401. DOI:10.1029/2009GL039401.
8 Vol. 53, No. 1–Groundwater–January-February 2015 (pages 2–9) NGWA.orgVan der Gun, J., and A. Lipponen. 2010. Reconciling ground- depletion of groundwater resources. Geophysical Research
water storage depletion due to pumping with sustainability. Letters 37: L20402. DOI:10.1029/2010GL044571.
Sustainability 2: 3418–3435. DOI:10.3390/su2113418. Walton, W.C. 2011. Aquifer system response time and ground-
Wada, Y., L.P.H. van Beek, C.M. van Kempen, J.W.T.M. water supply management. Ground Water 49, no. 2:
Reckman, S. Vasak, and M.F.P. Bierkens. 2010. Global 126–127. DOI:10.1111/j.1745-6584.2010.00770.x.
NGWA.org Vol. 53, No. 1–Groundwater–January-February 2015 (pages 2–9) 9You can also read