Review of Dunedin City District Plan-Natural Hazards - Flood Hazard of Dunedin's urban streams - Water of Leith, May 1923
←
→
Page content transcription
If your browser does not render page correctly, please read the page content below
Review of Dunedin City
District Plan—Natural Hazards
    Flood Hazard of Dunedin’s urban streams

            Water of Leith, May 1923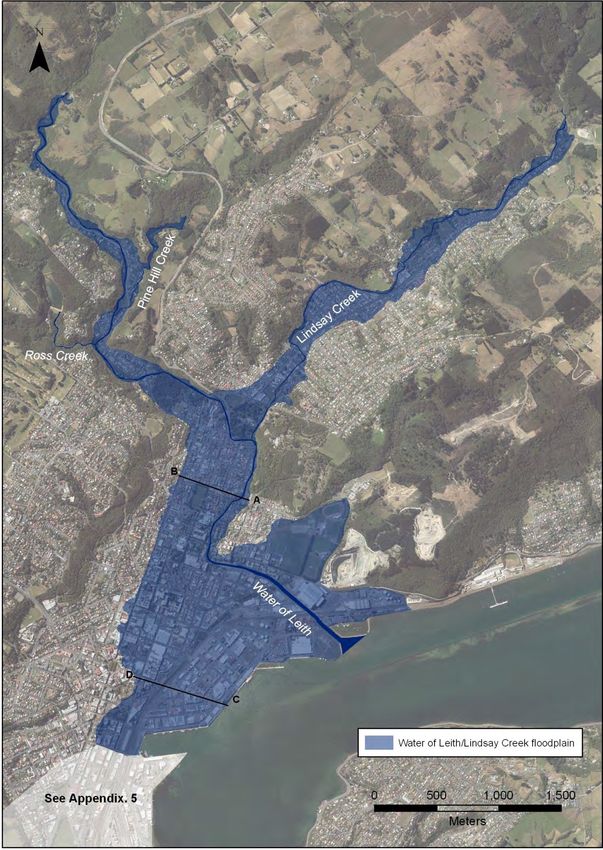
Otago Regional Council
Private Bag 1954, Dunedin 9054
70 Stafford Street, Dunedin 9016
Phone 03 474 0827
Fax 03 479 0015
Freephone 0800 474 082
www.orc.govt.nz

© Copyright for this publication is held by the Otago Regional Council. This publication may
be reproduced in whole or in part, provided the source is fully and clearly acknowledged.

ISBN: 978-0-478-37680-7

Published June 2014

Prepared by:     Michael Goldsmith, Manager Natural Hazards
                 Jacob Williams, Natural Hazards Analyst
                 Jean-Luc Payan, Investigations Engineer
                 Hank Stocker (GeoSolve Ltd)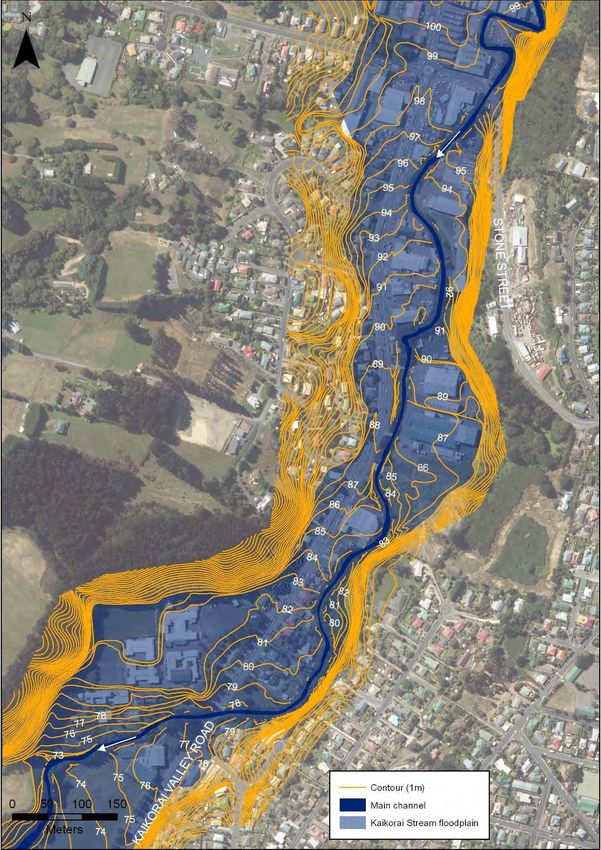
Flood Hazard of Dunedin’s urban streams                                                                                                         iii

Contents
Part 1:     Introduction ..................................................................................................................... 1
            Overview ......................................................................................................................... 1
            Scope ............................................................................................................................. 1
Part 2:     Describing the flood hazard of Dunedin’s urban streams .................................................. 2
            Characteristics of flood events ......................................................................................... 2
            Floodplain mapping ......................................................................................................... 2
            Other hazards ................................................................................................................. 6
Part 3:     Flood hazard characteristics of Kaikorai Stream .............................................................. 7
            Catchment description ..................................................................................................... 7
            Kaikorai Stream floodplain mapping ................................................................................ 8
            Coastal hazards: ............................................................................................................. 8
Part 4:     Water of Leith................................................................................................................ 10
            Catchment description ................................................................................................... 10
            Previous flooding and river control works ....................................................................... 11
            Water of Leith floodplain mapping.................................................................................. 14
Part 4:     Lindsay Creek ............................................................................................................... 18
            Catchment description ................................................................................................... 18
            Previous flooding........................................................................................................... 20
            Lindsay Creek floodplain mapping ................................................................................. 21
Appendix 1. Kaikorai Stream floodplain maps .................................................................................... 24
Appendix 2. Water of Leith floodplain maps ....................................................................................... 32
Appendix 3. Lindsay Creek floodplain maps ...................................................................................... 35
Appendix 4. Previous flood hazard maps........................................................................................... 38
Appendix 5. Topography of the area south of Jetty Street .................................................................. 39
References ..................................................................................................................................... 40

List of figures
Figure 1          Topography of the Kaikorai Stream, Water of Leith, and Lindsay Creek
                  catchments .......................................................................................................... 1
Figure 2          Debris trap, Malvern Street Park, Water of Leith, April 2006 ................................ 3
Figure 3          The Water of Leith channel, downstream of Leith Street, at approximately
                  midday on 18 April 2014 (taken close to the peak flow on that day of
                  71m3/s – see Figure 9). Works to improve the capacity of this reach
                  commenced in 2011. Photo source: Jeff King........................................................ 4
Figure 4          Stormwater runoff on Stafford Street during a period of intense rainfall,
                  February 2005 ...................................................................................................... 5
Figure 5          Kaikorai Stream flooding, Green Island, looking downstream towards the
                  Main South Road Bridge, March 1994. The location of this photo is shown
                  on Figure 27. Photo source Otago Daily Times. ..................................................... 7
Figure 6          Mapped floodplain area for Kaikorai Stream ........................................................ 9
Figure 7          Standing wave in the Water of Leith during the April 2006 flood event .............. 10
Figure 8          Upper catchment rainfall (at Sullivan’s Dam) and river flow (at St. David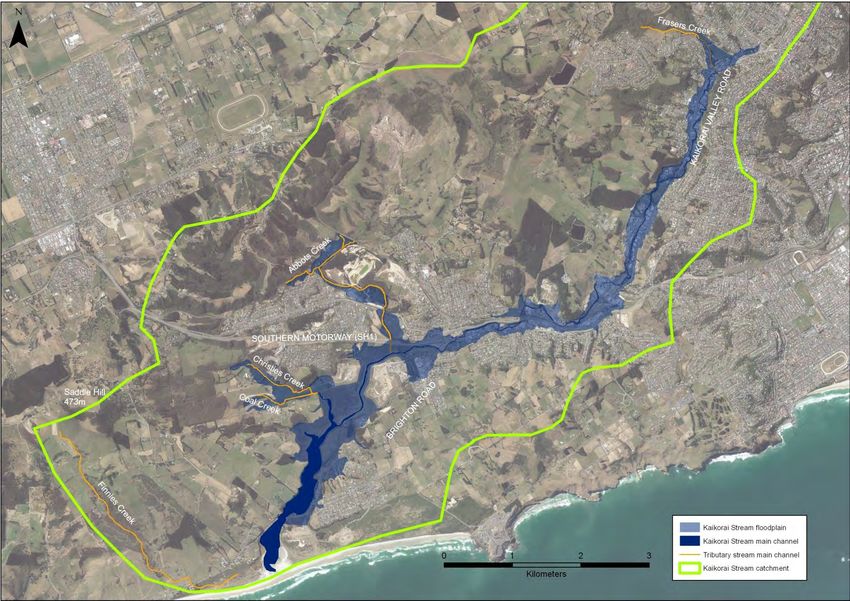
iv                                                                                              Same as main Document Title

            Street) in the Water of Leith catchment during the April 2006 flood event.
            Each vertical bar represents 1 hour. The left-hand scale shows flow (in
            m3/sec) and the right-hand scale shows rainfall intensity (in
            mm/15minutes). ................................................................................................ 11
Figure 9    Top ten flood flows in the Water of Leith at the St David Street footbridge.
            Continuous flow records commenced in Feb 1963, and the accuracy of the
            peak flows for the 1923 and 1929 floods is less than for later events. ................ 12
Figure 10   Floodwater from the Water of Leith ponding in Harrow Street (looking
            south towards the Railway Station), April 1923. The approximate location
            of this photo is shown in Figure 30. .................................................................... 13
Figure 11   Water of Leith in flood upstream of the Rockside Road Bridge, April 1923 ......... 13
Figure 12   Water of Leith and Lindsay Creek mapped floodplain area. The location of
            the cross sections shown in Figure 13 and Figure 14 is also shown. The
            topography of the area to the south of Jetty Street (shaded white) is shown
            in Appendix 5. .................................................................................................... 15
Figure 13   Cross section A-B (along Dundas Street) showing the extent of the
            previously mapped flood area (red line) and the floodplain area mapped
            for this report (green line) .................................................................................. 16
Figure 14   Cross section C-D (along Mason and Stuart streets) showing the extent of
            the previously mapped flood area (red line) and the floodplain area
            mapped for this report (green line) .................................................................... 17
Figure 15   House located immediately next to the main channel of Lindsay Creek .............. 18
Figure 16   View from Blacks Road across the North East Valley floodplain, during an
            event in 1912 (above), and approximately the same view today (below)............ 19
Figure 17   Top ten flood flows in Lindsay Creek at the North Road Bridge. Continuous
            flow records commenced in October 1979. ........................................................ 20
Figure 18   Lindsay Creek at Palmers Quarry Bridge, April 2006 (looking upstream). This
            photo was not taken at the peak of the flood. .................................................... 21
Figure 19   Cross section E-F (North East Valley School to Selwyn Street) showing the
            extent of the previous flood hazard area (red line) and the floodplain area
            mapped for this report (green line) .................................................................... 22
Figure 20   Cross section G-H (Chambers Street to Buccleugh Street) showing the
            extent of the previous flood hazard area (red line) and the floodplain area
            mapped for this report (green line) .................................................................... 22
Figure 21   Geological summary map of Lindsay Creek between Watts Road and North
            Road Bridge, as prepared by Coffey (2010) ......................................................... 23
Figure 22   Kaikorai Stream floodplain area: Frasers Creek confluence to Stone Street ........ 24
Figure 23   Kaikorai Stream floodplain area: Stone Street to Kaikorai College ...................... 25
Figure 24   Kaikorai Stream floodplain area: Kaikorai College to Townleys Road .................. 26
Figure 25   Kaikorai Stream floodplain area: Townleys Road to the Southern Motorway ..... 27
Figure 26   Kaikorai Stream floodplain area: Southern Motorway to Green Island ............... 28
Figure 27   Kaikorai Stream floodplain area: Green Island to Brighton Road. The
            approximate direction and location of the photo shown in Figure 7 is also
            shown. ............................................................................................................... 29
Figure 28   Abbots Creek and Kaikorai Stream floodplain area: adjacent to Sunnyvale

Table of Contents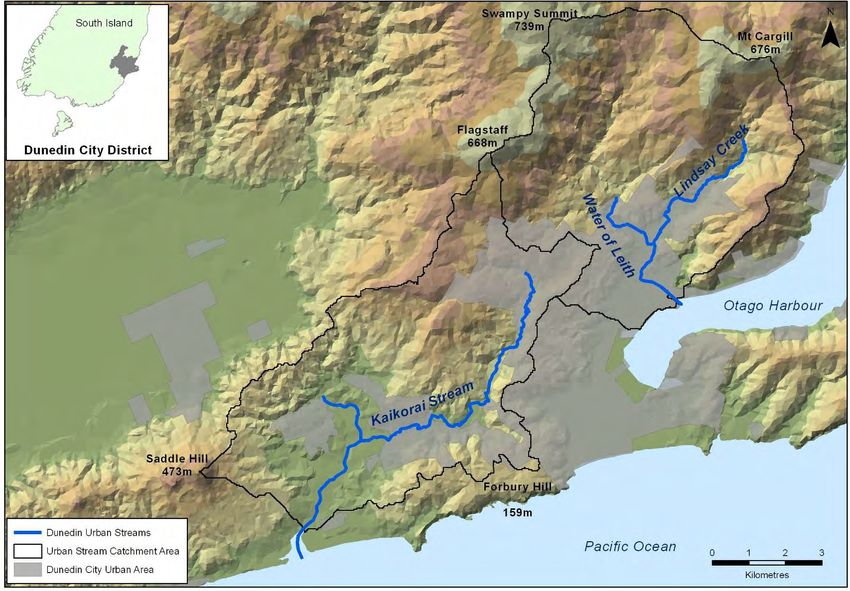
Flood Hazard of Dunedin’s urban streams                                                                                             v

             and SH1 .............................................................................................................. 30
Figure 29    Kaikorai Stream, and Coal and Christies Creek floodplain area: Sunnyvale to
             the Brighton Road Bridge. .................................................................................. 31
Figure 30    Mapped floodplain areas in the upper Water of Leith catchment. The
             approximate direction and location of the photo in Figure 11 is also shown. ...... 32
Figure 31    Mapped floodplain area in the mid Water of Leith catchment............................ 33
Figure 32    Water of Leith – CBD reach floodplain area. The approximate direction and
             location of the photo in Figure 10 is also shown. The topography of the
             area to the south of Jetty Street is shown in Appendix 5. ................................... 34
Figure 33    Lindsay Creek floodplain area - upper reach ....................................................... 35
Figure 34    Lindsay Creek floodplain area – middle reach ..................................................... 36
Figure 35    Lindsay Creek floodplain area - lower reach ....................................................... 37
Figure 36    Previously mapped flood hazard area in the Water of Leith and Lindsay
             Creek catchments. .............................................................................................. 38
Figure 37    Topography of the area between Jetty Street and the South City area ............... 39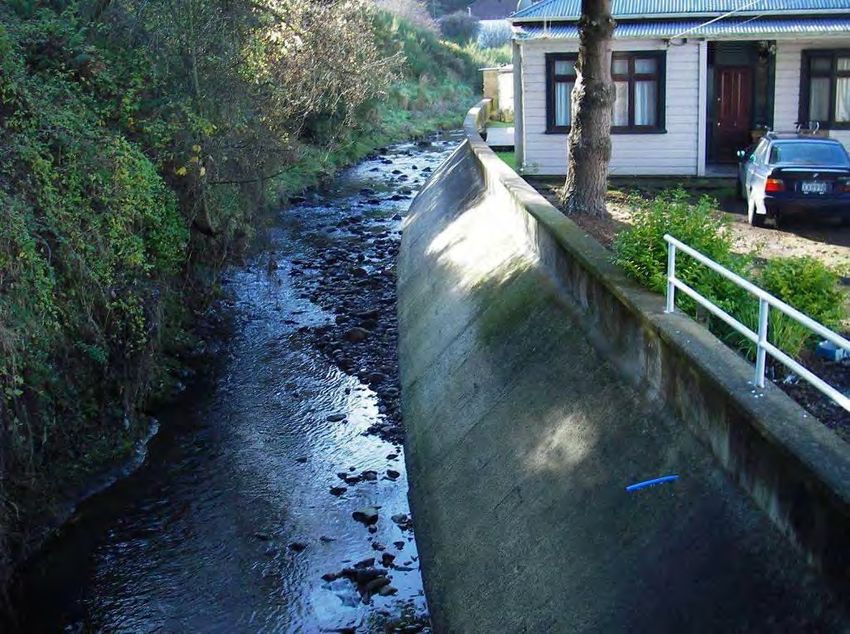
Flood Hazard of Dunedin’s urban streams                                                       1

Part 1: Introduction
Overview

As part of its current review of its District Plan, the Dunedin City Council (DCC) is reviewing
the way it manages the use of land, so that the effects of natural hazards (including the
effects of climate change) can be avoided, or adequately mitigated. The Otago Regional
Council (ORC) is supporting the DCC by collating and presenting natural hazards information
to help inform this review.

This report defines the characteristics of flood events in Kaikorai Stream, the Water of Leith
and Lindsay Creek (Dunedin’s ‘urban’ streams, as shown in Figure 1), and defines the
floodplain area which may be affected if floodwater is able to overtop the main channel. The
purpose of the report is to provide information and knowledge related to flood hazard, which
can be incorporated into planning provisions through the DCC District Plan. This report will
also assist with other activities such as the development of local emergency management
response plans, building consents, and infrastructure planning, renewal and maintenance.

This report identifies areas where flood hazards may affect public safety, buildings, and the
infrastructure which supports communities. It is part of a series of reports which have been
prepared to inform the review of the Dunedin City District Plan:

1.    Project overview                                                          (ORC, 2014a)

2.    Coastal Hazards of the Dunedin City District                              (ORC, 2014b)

3.    Flood Hazard of the Taieri Plain and Strath Taieri                        (ORC, 2014c)

4.    Flood Hazard of Dunedin’s urban streams

5.    The hazard significance of landslides in and around Dunedin City          (GNS, 2014a)

6.    Assessment of liquefaction hazards in the Dunedin City District           (GNS, 2014b)

The description of natural hazards contained in this report should be viewed alongside the
information contained in other reports. In particular the first report listed above provides an
overview of this project, while the two GNS reports describe the steeper parts of these
catchments which are prone to landslide activity (2014a), and lower-lying areas which may
be subject to liquefaction (2014b). The information in this report should also be considered in
conjunction with the information prepared by the Dunedin City Council on stormwater
flooding (DCC, 2011).

Scope

The geographical scope of this report covers the catchments of the following streams,
collectively referred to as Dunedin’s urban streams:

1.    The Kaikorai Stream, downstream of Frasers Creek

2.    The Water of Leith, downstream of Nicol’s Creek

3.    Lindsay Creek, downstream of Forrester Park
2                                                           Flood Hazard of Dunedin’s urban streams

The land-use characteristics and population of each of these urban stream catchments is
described more fully in each of the flood hazard sections below. The investigation excludes
the upper reaches in situations where the main channel is either well incised, heavily
modified, has a low population density, or is indefinite. It is noted that other watercourses in
Dunedin pose a localised flood hazard and are not considered here.
Flood Hazard of Dunedin’s urban streams                                                              1

Figure 1           Topography of the Kaikorai Stream, Water of Leith, and Lindsay Creek catchments
2                                                                      Flood Hazard of Dunedin’s urban streams

Part 2: Describing the flood hazard of Dunedin’s urban
        streams
The first part of this section describes the general characteristics of flood events in
Dunedin’s urban streams, while the second part describes the methods used to map areas
which may be affected by flood flows.

Characteristics of flood events

The largest flood events in Dunedin’s urban streams typically occur when fronts bringing
persistent heavy rainfall pass from east to west over the city. Flood events are caused by
rainfall that can either be short duration and high intensity, low intensity and steady state,
medium intensity with duration of several hours, or a combination of these conditions.

The relatively small and steep catchments of the urban streams can produce significant
flooding in just a few hours after the onset of heavy rain, giving little warning time.
Correspondingly the duration of peak flows is similarly brief. Flooding can also be
compounded by debris blockages of the main channel and by coastal effects (eg, elevated
sea level) at the Kaikorai Stream and Water of Leith mouths.

Damage from previous flood events has included inundation of buildings, houses, and roads,
scouring of river banks and road embankments, and substantial damage to bridges and
fences. Surface flooding and ponding can occur outside of the main stream channels and
can cause damage to properties and infrastructure that are not located in the immediate
vicinity of the channels. The effects of flooding (and other climatic hazards) may be
exacerbated in the future by changes in climate, with heavier and/or more frequent extreme
rainfalls expected over New Zealand (MfE, 2008).

Floodplain mapping

The floodplain areas which may be affected by flood flows in Dunedin’s urban streams have
been identified. A geomorphological approach was used as the basis for identifying land
which may be affected by inundation – i.e. landforms which are composed primarily of
unconsolidated depositional material derived from sediments which have been transported
by fluvial processes. In addition, the land identified as ‘floodplain’ in this report is that which
may be affected if water overtops the main channel, and subsequently flows in a downslope
direction across the floodplain. Land which lies well above potential break-out points has
been excluded, along with areas which have no direct connection to the wider floodplain (eg,
where road or railway embankments have been constructed).

Physical works have been undertaken over many decades, and to varying standards to
mitigate the effects of high flows and debris (examples are shown in Figure 2 and Figure 3).1
Physical works have improved channel capacity in some reaches and eliminated or reduced
the potential for some of the historically recorded flooding. However these works are not
continuous and potential still exists for out-of-channel flooding, particularly if the channel
becomes blocked with alluvial or landslide debris or the flood event is of an extreme
magnitude. Therefore, a residual risk still exists in regards to flood events which overtop the

1
    At the time of writing, works to reduce the effects of flooding are still underway in the Water of Leith.
Flood Hazard of Dunedin’s urban streams 3 main channel and inundate adjacent floodplain areas. It is these areas that have been mapped in this report. Also within the main channels there are some reaches that contain bank protection structures e.g. concrete lining or gabion baskets. Bank protection structures in the urban waterways are maintained by their owners, including ORC, DCC, and private landowners. Failure of these could result in bank erosion during flood events, contributing debris which may affect channel capacity downstream. Figure 2 Debris trap, Malvern Street Park, Water of Leith, April 2006
4                                                                  Flood Hazard of Dunedin’s urban streams

Figure 3           The Water of Leith channel, downstream of Leith Street, at approximately
                   midday on 18 April 2014 (taken close to the peak flow on that day of 71m3/s
                   – see Figure 9). Works to improve the capacity of this reach commenced in
                   2011. Photo source: Jeff King.

The area likely to be affected by flooding has not been determined using hydraulic
modelling, as the extent of inundation during any event will depend on the location of any
overflow, and local effects due to the presence of buildings, fences and roads. Instead, the
land mapped as ‘floodplain’ is intended to represent an envelope of areas which may
potentially be affected under a range of flood scenarios, 2 rather than an area liable to be
fully inundated in any one event. Only flooding from the main channel is included; i.e. the
mapped floodplain is not intended to represent areas subject to flooding from stormwater or
runoff from adjacent hills. In a significant storm event discharges from these sources, and
from overflow of reticulated public stormwater systems can contribute substantially to local
flooding (Figure 4). Information on the likelihood and effects of stormwater flooding is
reported separately by the DCC (2011).

2
 including variations in the magnitude and timing of inputs from different tributaries, channel blockages,
and conditions at the mouth.
Flood Hazard of Dunedin’s urban streams 5
Figure 4 Stormwater runoff on Stafford Street during a period of intense rainfall,
February 2005
In places there are ‘islands’ of high ground within the floodplain, but these are generally
small and only marginally above the potential flood level, and have therefore not been
defined. Further, these areas will potentially be isolated in a major flood event and therefore
should reasonably be included. Localised topography is shown in a series of more detailed
floodplain maps in Appendix 1 – 3. These maps include ground contours, derived from
LiDAR obtained from the DCC, which was collected in 2009. It is noted that the mapped
ground contours will not account for any recent modifications to the floodplain due to
earthworks or other construction.
In parts of the floodplain, particularly adjacent to the main channels, the speed and depth of
flood flows could damage buildings and other assets, move vehicles and make walking
difficult or unsafe for adults, and therefore present a possible risk to life. The likely attributes
of flood flows (depth, speed, and duration) in these more critical areas are:
Depth of water: Between 0.1 and approximately 1m, with the deeper water generally
being located adjacent to the main channel or in areas of significant ponding, with
lower levels on the wider floodplain.
Duration of flooding: Few hours (runoff) to 1 or 2 days (main channel flow)
depending on the intensity and duration of the rainfall event.
Water speed: Fast to very fast; with higher water speed and greater turbulence
occurring in the upper reaches and within the main channel, and lower water speed
and turbulence further downstream and away from the channel.
Elsewhere on the floodplain, the floodwaters will be much shallower and slower, with
damage potential reduced accordingly. In some areas the streets are lower than the
adjacent properties and will act as overland flow paths with the main issue for people being6 Flood Hazard of Dunedin’s urban streams
access limitations. Further damage can occur when vehicle traffic creates waves which can
wash into buildings that would otherwise be above water level.
Other hazards
Aside from flooding, the Dunedin urban stream catchments are vulnerable to a range of
other natural hazards. Climatic hazards such as drought, wind, and snow affect the area
irregularly. Extreme climatic events (such as the snow storm of 1939 3) can have a significant
impact. These hazards have not been addressed as part of this report, and further
information is available through the Otago Natural Hazards Database (available through the
ORC website www.orc.govt.nz).
The area is also vulnerable to seismic shaking from earthquakes. Dunedin is located close to
the Titri and Akatore Faults, and other more distant faults could also affect the area. Reports
by GNS Science and Opus provide more detail on seismic and landslide hazards in the
Dunedin City District (GNS 2014a and 2014b, Opus 2005).
3
See ODT (2011)Flood Hazard of Dunedin’s urban streams 7
Part 3: Flood hazard characteristics of Kaikorai Stream
Catchment description
The Kaikorai Stream drains the southern and eastern slopes of Flagstaff, Kaikorai Hill, and
the Balmacewen area (Figure 1). It has a catchment area of 55km2 which contains the
Dunedin suburbs of Halfway Bush, Brockville, Kaikorai, Kenmure, Concord, Green Island,
Abbotsford, Waldronville, Fairfield, and parts of Balmacewen, Maori Hill, Roslyn, and
Mornington. The Kaikorai catchment is used for rural, residential, commercial, and industrial
activities. The Kaikorai catchment is home to about 24,500 people, mostly located in the
urban area of Dunedin City.
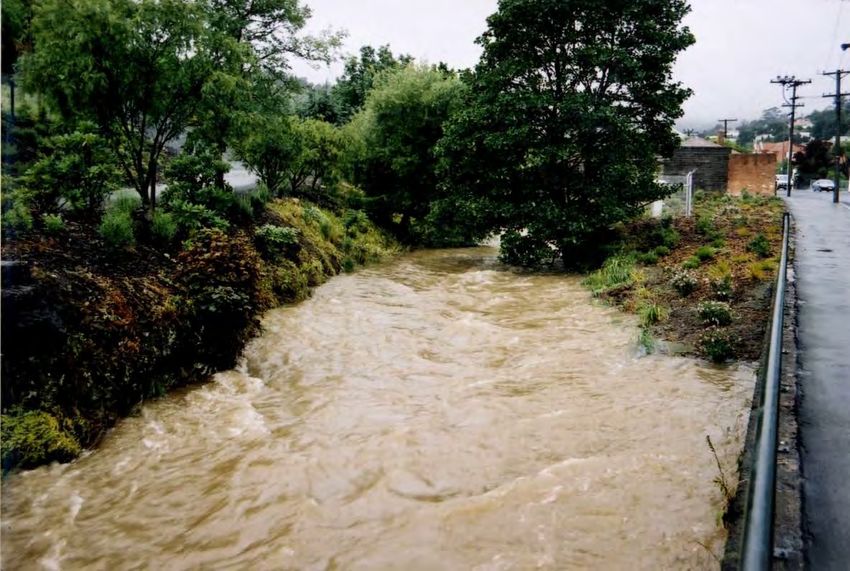
Figure 5 Kaikorai Stream flooding, Green Island, looking downstream towards
the Main South Road Bridge, March 1994. The location of this photo is
shown on Figure 27. Photo source Otago Daily Times.
Past flood-related issues in the Kaikorai catchment have often been caused by mechanisms
other than main channel overflow; including local surface runoff, rainfall triggered landslip, and
blockage of the stream mouth.4 Records of inundation and damage from main channel
overflow have been limited to isolated locations in 1923, 1968, 1991, and 1994 (Figure 5)
(ORC, 2001a). Channel works have improved the flood capacity in the Green Island reach,
subsequent to those observed events.
4
A combination of low flows in the Kaikorai Stream and onshore wind and wave action periodically lead
to the formation of a large sand bar across the mouth of the estuary. Although the sand bar often
dissipates naturally, its presence during storm events may exacerbate flood hazard for low-lying land
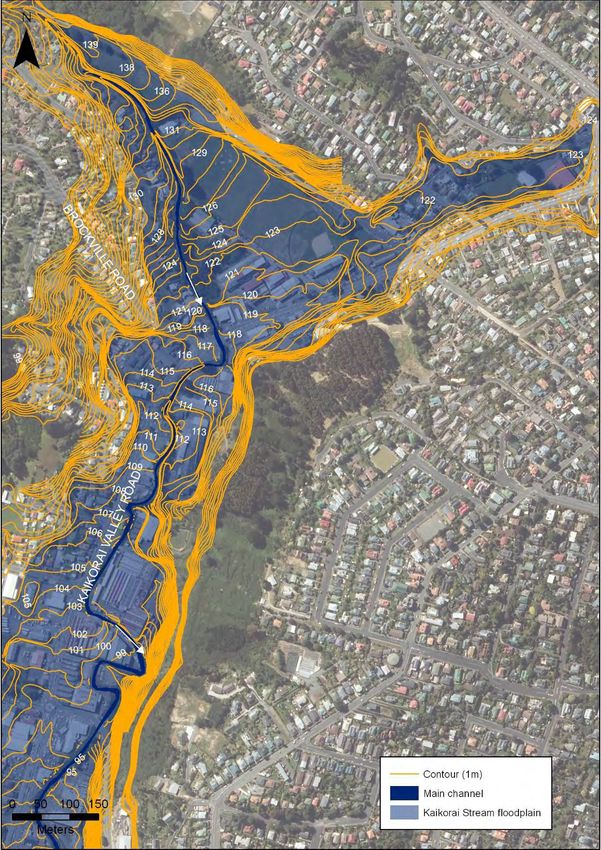
surrounding the Kaikorai Estuary.8 Flood Hazard of Dunedin’s urban streams Kaikorai Stream floodplain mapping The mapped floodplain extends from Frasers Creek downstream to the Brighton Road Bridge (Figure 6). Figure 6 shows there is potential for widespread inundation in some areas as a result of flood events in the Kaikorai Stream, particularly if the stream experienced significant bed aggradation, debris blockage, and/or extreme flood events. The floodplain extends well beyond the main channel in a number of locations, and these are shown in a series of more detailed maps in Appendix 1. Coastal hazards: The lower reaches of the Kaikorai floodplain (below Green Island) could be affected by coastal hazards such as storm surge and tsunami, particularly if sea level was higher than at present (ORC, 2012).5 An increase in mean sea level may also have an impact on the depth and extent of inundation from the Kaikorai Stream in the lower reaches during flood events. The interaction of different processes (e.g. coastal storm surge coinciding with high river flows and surface runoff) can also increase the level of hazard for the Kaikorai Estuary (ORC 2014a, ORC 2014b). 5 MfE (2008) recommend planning authorities consider up to 0.8m of sea level rise over a 100 year period. However, the most recent expert advice from NIWA (Bell, 2013) recommends revising this figure to 1m to account for projected increases in the rate of sea-level rise beyond 2100.
Flood Hazard of Dunedin’s urban streams                         9

Figure 6           Mapped floodplain area for Kaikorai Stream
10                                                         Flood Hazard of Dunedin’s urban streams

Part 4:       Water of Leith
Catchment description

The Water of Leith catchment is located to the north of the Dunedin Central Business District
(CBD), and has a catchment area of approximately 42km 2 including parts of Flagstaff,
Swampy Spur, and Mount Cargill which rise to approximately 700m above sea level. The
permanent population which resides on the Water of Leith floodplain areas is approximately
9,300 (including North East Valley). Much of the floodplain area is also used for commercial,
educational and educational purposes, and is traversed by important lifeline infrastructure
(including State Highways, South Island Main Trunk Line, and electricity and
telecommunications links).

Flows start at the Leith Saddle near Sullivan’s Dam and then travel for 14km southward
through the northern part of the city before discharging into the Otago Harbour south of
Logan Park (Figure 1). The main tributaries of the Water of Leith include Lindsay Creek,
Morrison’s Burn, Nicol’s Creek, Opoho Creek, and Ross Creek. Lindsay Creek, the largest
tributary which joins the Water of Leith in the lower reaches near the Botanical Gardens, is
addressed separately in this report. The flood hazard area for the confluence area is derived
both from the Water of Leith and Lindsay Creek.

The upper section of the catchment and its tributaries are characterised by steep slopes and
fast flows. The lower reaches are still relatively steep hydraulically, with a fall of 25m
between the George Street and Dundas Street bridges. These characteristics result in the
Water of Leith having the potential to behave in times of flood as a mountain torrent, as
evidenced by the large alluvial boulders visible in the channel even in the lower reaches. The
Water of Leith is hydraulically steep with flood flows moving at up to 3m/s in some reaches
(Opus, 2004c). The water surface under flood conditions is likely to be highly turbulent
throughout most reaches (Opus, 2004c) with large standing waves being observed in some
locations (Figure 7).

Figure 7         Standing wave in the Water of Leith during the April 2006 flood event
Flood Hazard of Dunedin’s urban streams                                                      11

During flood events, any increase in rainfall intensity in the upper catchment results in a
rapid increase in flow downstream, as runoff quickly reaches the built up area of Dunedin
(ORC, 1999). An example is shown in Figure 8 - rainfall intensities in the upper catchment
started to increase at 6am on the morning of 26 April 2006, immediately followed by an
increase in flow downstream at St. David Street. By 8:30am river flow had increased from 63
to 94m3/sec. A number of properties and other assets were affected during this event
(particularly between Dundas and St. David Street).

                                                 Rainfall               River peaked
                                              intensity starts          downstream
                                                to pick up

Figure 8           Upper catchment rainfall (at Sullivan’s Dam) and river flow (at St. David
                   Street) in the Water of Leith catchment during the April 2006 flood event.
                   Each vertical bar represents 1 hour. The left-hand scale shows flow (in
                   m3/sec) and the right-hand scale shows rainfall intensity (in mm/15minutes).

Previous flooding and river control works

Damaging floods in the Leith were a frequent occurrence from the time of first settlement;
being recorded in 1868, 1877, 1911, 1923 (Figure 10 and Figure 11), and 1929. The 1929
event was the most severe on record, with floodwaters sweeping away and damaging
bridges and other channel structures, affecting numerous houses, and flowing along the
streets beyond lower Rattray Street. Observed flood extents and anecdotal evidence from
previous events show that inundation of 1m or more can occur in some places. During the
1929 event, flood water from the Water of Leith flooded approximately 500 houses in the
north end of Dunedin City to a depth of up to 1.2m (MacLean et al, 1931). Since 1929 there
have been a number of significant floods in the Water of Leith (the largest in 1991); but none
comparable to the 1929 event (Figure 9). River control works have progressively been
undertaken within the catchment with a formal flood protection scheme in place. The
12 Flood Hazard of Dunedin’s urban streams
combination of relatively small flood events and progressive channel improvement and flood
protection works has limited the amount of damage caused by flooding since 1929.
At the time of writing, works are underway to reduce the flood hazard of the Water of Leith.
As noted above, a residual flood risk will still exist once these works are completed, and the
floodplain maps shown below will therefore still be applicable.
Figure 9 Top ten flood flows in the Water of Leith at the St David Street footbridge.
Continuous flow records commenced in Feb 1963, and the accuracy of the
peak flows for the 1923 and 1929 floods is less than for later events.Flood Hazard of Dunedin’s urban streams 13
Figure 10 Floodwater from the Water of Leith ponding in Harrow Street (looking south
towards the Railway Station), April 1923. The approximate location of this
photo is shown in Figure 32.
Figure 11 Water of Leith in flood upstream of the Rockside Road Bridge, April 192314 Flood Hazard of Dunedin’s urban streams Water of Leith floodplain mapping The mapped floodplain extends from Nicol’s Creek downstream to Otago Harbour (Figure 12). More detailed maps of the upper, mid and lower reaches of the Water of Leith catchment are shown in Appendix 2. Above Woodhaugh, the floodplain is bounded by steep slopes, and its margins are well defined by a sharp break in slope. Downstream of Woodhaugh, the floodplain has been mapped to show the expected overland path of any overflows from the main channel, based on the ground contours of the area. Although any flooding would generally be shallow, localised inundation may reach depths of up to approximately 1m, due to impedances to overland flow (eg, fences, buildings) and land which is particularly low relative to the surrounding area. Due to the general southward slope of this part of the floodplain, overland flows may reach as far as Queens Gardens (Figure 32) before exiting to the Otago Harbour between Fryatt and Birch Streets. This is consistent with the tentative conclusion of MWH (1999). The land continues to slope to the south from this point. It is therefore possible that overflow from the Water of Leith which was not contained within the Queens Gardens area could continue to drain towards the Oval, and beyond. Due to the very flat relief of this area, and the potential effects of buildings, roads and the stormwater system, the floodplain has not been defined beyond Jetty Street. Land which lies at the same level, or downslope of the floodplain at this point is shown in Appendix 5.
Flood Hazard of Dunedin’s urban streams                                                     15

Figure 12          Water of Leith and Lindsay Creek mapped floodplain area. The location of
                   the cross sections shown in Figure 13 and Figure 14 is also shown. The
                   topography of the area to the south of Jetty Street (shaded white) is shown
                   in Appendix 5.
16 Flood Hazard of Dunedin’s urban streams
The approximate area inundated during previous events (including the 1929 flood, Figure 9)
is shown in Appendix 4. The main parts of the Water of Leith floodplain which were not
included in this earlier flood hazard map, but have been identified as ‘floodplain’ in this report
include:
1. Land between the 1-way system (Great King and Cumberland streets) and George
Street in North Dunedin. As noted above, this part of the floodplain includes the area
which could be affected by overland flow, originating from overtopping of the channel
further upstream (i.e. in the vicinity of the George Street Bridge / Woodhaugh
Gardens). Figure 13 shows cross section A-B through this part of the floodplain, along
Dundas Street.
2. Land to the east of the stadium, as far as the raised bund which separates the BP Oil
Terminal from Palmers Engineering. This land is at the same, or a lower elevation than
the existing flood hazard area which extends into Parry Street.
3. Reclaimed land between the South Island Main Trunk Line and Otago Harbour (Anzac
Ave to Fryatt Street). This land has been included as it lies at a similar or lower
elevation than the previously mapped area (Figure 14). Although the effects of
overland flow may be mitigated by the presence of raised road and railway
embankments, this area has a very subtle topography, and it has therefore been
included within the mapped floodplain area for the purposes of this report. Parts of this
area may also be increasingly affected by extreme sea level events, due to sea-level
rise (ORC, 2014b), and it has been affected by surface runoff during previous heavy
rainfall events.
Figure 13 Cross section A-B (along Dundas Street) showing the extent of the
previously mapped flood area (red line) and the floodplain area mapped for
this report (green line)Flood Hazard of Dunedin’s urban streams 17
Figure 14 Cross section C-D (along Mason and Stuart streets) showing the extent of
the previously mapped flood area (red line) and the floodplain area mapped
for this report (green line)18 Flood Hazard of Dunedin’s urban streams Part 4: Lindsay Creek Catchment description Lindsay Creek rises on the flanks of Mount Cargill and runs southwest, draining Northeast Valley and joining the Water of Leith at the Botanic Gardens. The catchment area is about 12km2 and the length of the main channel is about 7 km (Figure 1). In the upper catchment the streambed is steep and the stream has the characteristics of a mountain torrent. Under high flows, it can erode its banks and carry large volumes of debris and detritus. In the lower catchment the slope of the streambed decreases through the urbanised area of North East Valley. All along the catchment, short tributaries (also with short, steep catchments) contribute to the flow in Lindsay Creek. The western slopes are mainly bush covered, with farmland and some urban development on the lower slopes, while the sunnier, eastern slopes are more densely populated. The valley floor floodplain is intensely developed with urban land-use occurring immediately next to the creek (Figure 15). Several hundred residential properties have some degree of exposure to flood hazard, along with three schools, Ross Home and the Otago Community Hospice, roads (including North Road which is the main access to North East Valley) and a number of commercial properties. Figure 15 House located immediately next to the main channel of Lindsay Creek
Flood Hazard of Dunedin’s urban streams 19
Figure 16 View from Blacks Road across the North East Valley floodplain, during an
event in 1912 (above), and approximately the same view today (below)
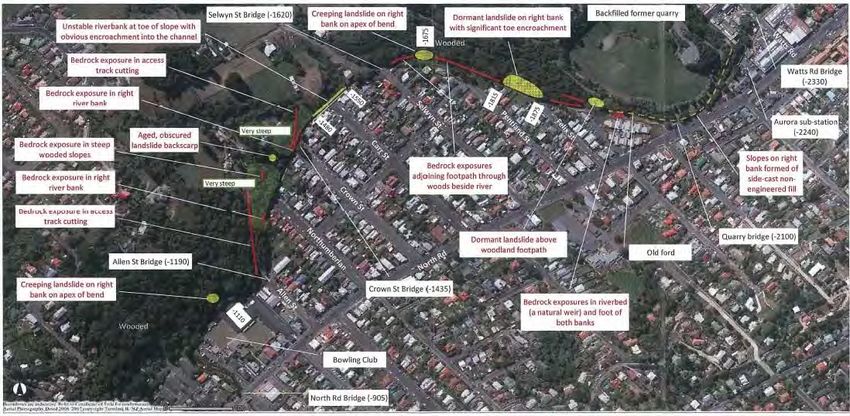
The potential for flood damage from Lindsay Creek is exacerbated by bank instability, with
associated erosion, bed aggradation and/or debris blockage possible in places. Dormant and
creeping landsliding above some points of the channel could be activated in an extreme storm
and partially or fully block the channel causing substantial out-of-channel overflow. A number
of landslide features on the steep true-right (northern) bank of Lindsay Creek were identified by
Coffey Geotechnics (2010), and the toe (or base) of these landslides encroach into the main
channel of Lindsay Creek (Figure 21). Stormwater overflows are also believed to have
contributed significantly to previous surface flooding.20 Flood Hazard of Dunedin’s urban streams
Previous flooding
Records and observations indicate that flooding from Lindsay Creek has been a regular
occurrence. A number of floods in Lindsay Creek have caused damage to properties through
bank erosion and from floodwater overtopping the river banks. Severe flooding and
consequent damage was reported in 1868, 1877, 1912 (Figure 16), 1923, 1929, 1968, 1971
and 1991 (ORC, 2001b). The largest flood event in the last decade was in April 2006 (Figure
18). The ten largest flood events since continuous monitoring commenced in 1979 are
shown in Figure 17.
Figure 17 Top ten flood flows in Lindsay Creek at the North Road Bridge. Continuous
flow records commenced in October 1979.Flood Hazard of Dunedin’s urban streams 21
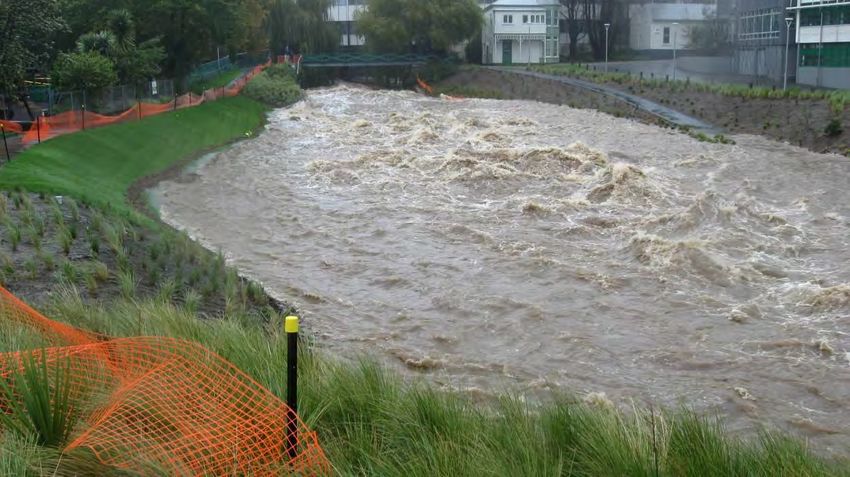
Figure 18 Lindsay Creek at Palmers Quarry Bridge, April 2006 (looking upstream). This
photo was not taken at the peak of the flood.
Lindsay Creek floodplain mapping
The Lindsay Creek floodplain extends from Forrester Park downstream to the confluence
with the Water of Leith (Figure 12). More detailed maps of the upper, mid and lower reaches
of the Water of Leith catchment are shown in Appendix 3.
The mapped floodplain area covers the valley floor and is reasonably consistent with
historically observed flood extents and previously mapped flood hazard areas (Appendix 4).
The main parts of the Lindsay Creek floodplain which were not included in earlier flood
hazard maps, but have been identified as ‘floodplain’ in this report include:
1. The valley floor upstream of Normanby (Bonnington Street) to Forrester Park. This part
of the floodplain had not previously been mapped.
2. Land to the east of North Road, particularly between James Street and Normanby.
Although the previous flood hazard area was truncated at North Road, there is a strip
of land to the east which lies at, or below the level of the previous flood hazard area
(Figure 19).
3. Parts of the true right floodplain downstream of Buccleugh Street (including Sacred
Heart School). This land also lies at a similar elevation to the rest of previous flood
hazard area (Figure 20).22 Flood Hazard of Dunedin’s urban streams
Figure 19 Cross section E-F (North East Valley School to Selwyn Street) showing the
extent of the previous flood hazard area (red line) and the floodplain area
mapped for this report (green line)
Figure 20 Cross section G-H (Chambers Street to Buccleugh Street) showing the
extent of the previous flood hazard area (red line) and the floodplain area
mapped for this report (green line)Flood Hazard of Dunedin’s urban streams 23 Figure 21 Geological summary map of Lindsay Creek between Watts Road and North Road Bridge, as prepared by Coffey (2010)
24                                                   Flood Hazard of Dunedin’s urban streams

Appendix 1. Kaikorai Stream floodplain maps

Figure 22   Kaikorai Stream floodplain area: Frasers Creek confluence to Stone Street
Flood Hazard of Dunedin’s urban streams                                                25

Figure 23          Kaikorai Stream floodplain area: Stone Street to Kaikorai College
26                                                   Flood Hazard of Dunedin’s urban streams

Figure 24   Kaikorai Stream floodplain area: Kaikorai College to Townleys Road
Flood Hazard of Dunedin’s urban streams                                                      27

Figure 25          Kaikorai Stream floodplain area: Townleys Road to the Southern Motorway
28                                                                               Flood Hazard of Dunedin’s urban streams

Figure 26   Kaikorai Stream floodplain area: Southern Motorway to Green Island
Flood Hazard of Dunedin’s urban streams                                                                                                     29

Figure 27          Kaikorai Stream floodplain area: Green Island to Brighton Road. The approximate direction and location of the photo shown in
                   Figure 7 is also shown.
30 Flood Hazard of Dunedin’s urban streams Figure 28 Abbots Creek and Kaikorai Stream floodplain area: adjacent to Sunnyvale and SH1
Flood Hazard of Dunedin’s urban streams                                                     31

Figure 29          Kaikorai Stream, and Coal and Christies Creek floodplain area: Sunnyvale to
                   the Brighton Road Bridge.
32 Flood Hazard of Dunedin’s urban streams
Appendix 2. Water of Leith floodplain maps
Figure 30 Mapped floodplain areas in the upper Water of Leith catchment. The
approximate direction and location of the photo in Figure 11 is also shown.Flood Hazard of Dunedin’s urban streams 33 Figure 31 Mapped floodplain area in the mid Water of Leith catchment
34                                                   Flood Hazard of Dunedin’s urban streams

Figure 32   Water of Leith – CBD reach floodplain area. The approximate direction and
            location of the photo in Figure 10 is also shown. The topography of the area
            to the south of Jetty Street is shown in Appendix 5.
Flood Hazard of Dunedin’s urban streams 35 Appendix 3. Lindsay Creek floodplain maps Figure 33 Lindsay Creek floodplain area - upper reach
36                                                         Flood Hazard of Dunedin’s urban streams

Figure 34   Lindsay Creek floodplain area – middle reach
Flood Hazard of Dunedin’s urban streams                          37

Figure 35          Lindsay Creek floodplain area - lower reach
38                                                  Flood Hazard of Dunedin’s urban streams

Appendix 4. Previous flood hazard maps

Figure 36   Previously mapped flood hazard area in the Water of Leith and Lindsay Creek
            catchments.
Flood Hazard of Dunedin’s urban streams 39 Appendix 5. Topography of the area south of Jetty Street Figure 37 Topography of the area between Jetty Street and the South City area
40                                                        Flood Hazard of Dunedin’s urban streams

References
Christina, R., 1992: Hutt River Floodplain Management Plan, Phase 1- Hutt River Flood
Control Scheme Review, Topic No. 4, River Channel Capacity, Wellington Regional Council.

Coffey Geotechnics, 2010: Lindsay Creek Value Engineering Study Geotechnical Appraisal.
Report prepared for Otago Regional Council.

Dunedin City Council, 2011. Integrated Catchment Management Plan documents. Accessed
online at http://www.dunedin.govt.nz/your-council/council-projects/3waters/icmpdocuments

GNS Science, 2014a. The hazard significance of landslides in and around Dunedin City.
Report prepared for Otago Regional Council.

GNS Science, 2014b. Assessment of liquefaction hazards in the Dunedin City District.
Report prepared for Otago Regional Council.

MacLean, F. W., McGregor Wilkie, J., Alexander, J. G. 1931: Water of Leith and Lindsay's
Creek, Report prepared for Dunedin City Council and Otago Harbour Board, Dunedin.

Ministry for the Environment, 2008. Climate Change effects and impacts assessment, A
Guidance Manual for Local Government

Opus, 2004a: Water of Leith from Botanic Gardens to Otago Harbour Hydraulic Modelling
Report. Client Report, prepared for Otago Regional Council, October 2004

Opus, 2004b: Water of Leith from Pine Hill Creek Confluence to George Street Hydraulic
Modelling Report. Client Report, prepared for Otago Regional Council, September 2004.

Opus, 2004c: Water of Leith and Lindsay Creek Design Philosophy for Achieving Minimum
Design Flood Standard, Report prepared for the Otago Regional Council.

Opus, 2005: Seismic Risk in the Otago Region. Report prepared for the Otago Regional
Council, March 2005.

Opus and GNS Science, 2009: Otago Alluvial Fans Project, Prepared for the Otago Regional
Council.

Otago Daily Times, 2011. Reflecting on 150 years. Accessed online May 2014 at
http://www.odt.co.nz/tags/reflecting-150-years/174454/1939-dunedin-cut-after-three-day-
snowstorm.

Otago Regional Council, 2014a. Review of Dunedin City District Plan – Natural Hazards:
Project Overview.

Otago Regional Council, 2014b. Coastal Hazards of the Dunedin City District.

Otago Regional Council, 2014c. Flood Hazard of the Taieri Plain and Strath Taieri.

Otago Regional Council, 2012. Community vulnerability to elevated sea level and coastal
tsunami events in Otago. ISNB 978-0-478-37630-2

Otago Regional Council, 2001a. Kaikorai Stream Flood Hazard Report. ISBN 1-877265-26-8
Flood Hazard of Dunedin’s urban streams                                                41

Otago Regional Council, 2001b. Lindsay Creek Flood Hazard Report.

Otago Regional Council, 1999: Water of Leith Flood Hazard Report, Otago Regional Council.
ISBN 0-908-922-61-2
You can also read