Urban Morphological Developments of a Post-Apartheid City
←
→
Page content transcription
If your browser does not render page correctly, please read the page content below
Gambill, Vendela                 Morphological Developments of CT    54th ISOCARP Congress 2018

        Urban Morphological Developments of a Post-Apartheid City
                   Vendela GAMBILL, University College London, United Kingdom
Abstract

This paper provides an analysis of the historic development of Cape Town’s spatial
configuration utilizing Space Syntax methodology. It recognizes how the topology of its
mountainous and coastal forms, in succession with its historic spatial planning legislation,
has cumulated to create barriers for cohesive growth between communities across the
region. The result of segregated development of the historic centre and Central business
district (CBD) to accommodate increased pressures on population growth, is arguably being
reiterated in present time to perpetuate segregation for certain marginalised communities.
This paper begins with a comparison of the historic, morphological change in Cape Town’s
urban street network from the period of pre-apartheid 1940’s Cape Town, through to a 1980
map of implemented apartheid policy and finally a post-apartheid 2016 map. These three
maps provide evidence-based recognition into the disparity between land-use pattern, which
has remained relatively stagnant through the rapid population expansion of the city, and its
impact of causing restrictive economic coherency for the subcentres within the spatial
structure. The reiteration of poverty in certain areas remain racially-bound, regardless of
efforts to decouple spatial segregation with race and a theoretical standpoint is taken which
suggests urban morphology has an intrinsic impact on the socio-spatial development of the
region. This paper aims to uncover the urban morphological trends, which could be
contributing to perpetuating spatial patterns naturally emerging from consistent population
growth in order to inform policy-decisions for the municipality moving forward. The main
argument suggests that undesirable socio-economic conditions may be arising due to
geographical and spatial contingencies causing the urban development of Cape Town to be
polycentric in nature and with weak localised centralities.

1. Introduction

Cape Town is an urban system entrenched in deep complexities from a variety of political,
historical, social, economic and environmental factors. Through the use of Space Syntax
methodology, this paper will systematically tackle some of the layers that add to this
complexity, to better understand the persistence of societal outcomes particularly related to
employment and race. Firstly, the historic transformation of the urban network will be
assessed based on the notion of centrality within the urban system, which provides insight
into the morphological dimension of the spatial structure (Hillier 1999; Hillier and Penn 2004).
Secondly, choropleth maps defining racial groups and employment split across the various
wards based on census data will be analysed to define the functional dimension of the spatial
structure, addressing the significance of the interrelationship between sub-centres in the city
that emerge across various localities (Burger and Meijers 2012). To conclude, the paper will
look outward to evaluate potential risks, impacts and adaptive strategies of this spatial
structure scenario in order to identify the local government may be interested to consider in
their development planning framework moving forward.

A configurational approach towards understanding growth and development of structural
patterns of Cape Town’s urban morphology has its strengths in disassociating traditionally
politicised planning metrics, to understand through evidence the transformation of urban form
that has manifested as a result of historical political power. From this perspective, Space
Syntax provides the analytical toolkit by which the street network layout, analysed through
graph theory and network analysis, are associated to various social and behavioural
outcomes (Turner 2007; Karimi 2012). Uncovering the process of production of space and
patterns to which urban forms are reproduced to influence socio-economic outcomes

                                                1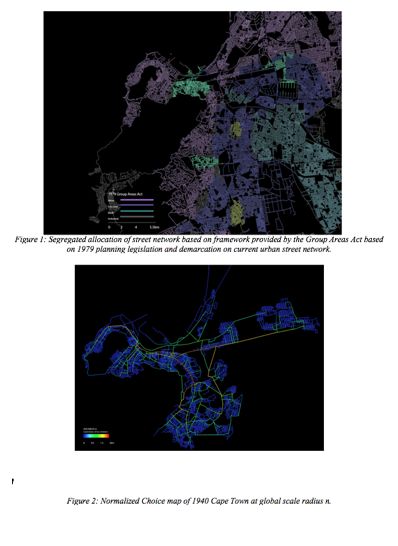
Gambill, Vendela               Morphological Developments of CT       54th ISOCARP Congress 2018

provides empirical validation defining the political role in shaping future urban form. Space
Syntax theory proposes that spatial urban structure shapes movement pattern and
movement pattern shapes urban structure, with this paradigm providing explanatory power
for spatial descriptions of social phenomena (Hillier 1996).

2. Cape Town: The Context

Cape Town is an urban region located in the Southern-most tip of South Africa, which
experienced most of its urban expansion during the period of enforced apartheid. Apartheid
government ensured the formal segregation of races as appropriating their own rights. Two
significant pieces of legislature impacting the course of spatial planning includes the Group
Areas Act of 1955 (renamed the Community Development Act in 1966) which divided group
areas for the exclusive ownership and occupation of designated racial groups. In this
tradition Black African’s were allocated land the farthest distance from the Central Business
District (CBD) where the government used buffer strips of rivers, open land or mountainous
topography to ensure physical spatial barriers between allocated racial groups. These
divisions were to ensure that social contact between communities would be reduced to a
minimum in order to eliminate competition for urban space in the historic core, ultimately
privileging opportunities for the, then superior, white population (Christopher 1994:103).

To ensure the displacement of these inferior racial groups, The Natives Resettlement Act of
1954 provided mechanisms to remove Africans from inner freehold areas. These inner
suburbs were demolished and urban growth of the Black African and coloured population
was to be restricted to the allocated perimeters of the city. Outward displacement of these
racial groups caused by this division, lead arguably to spatial urban patterns and economic
impoverishment that has perpetuated through spatial form in the present day. Furthermore,
the urban population tripled to 5.3 million people in 1951 representing 42% of the total
population (Christopher 1994). This suggests that the majority of Cape Town’s current
population are subject to living in suburbs developed on the basis of spatial apartheid
planning and divisionary legislation.

As current planning legislation functions with the attempt to “desegregate” the currently
marginalized communities, who perpetuate socio-economic disempowerment in light of the
apartheid regime, a critical evaluation on the current targets for change within the city council
must be understood (City of Cape Town 2011; City of Cape Town 2017). There is a literature
critiquing South African politics overall, which argues the ‘neo-liberal turn’ prioritizes the
importance of gaining global traction and marketing as a competitive world city, above the
needs of its poorest cities (Harrison 2003; Todes 2003). With an arena of deep social
inequality, critical issues in Cape Town are vastly different across the spectrum of its citizens
and their income groups, and arguably the recent restructuring of government and mayoral
electoral board, has not yet adjusted to advocate the needed position of focusing on
problems for their lower income citizens. This is evident where Harrison (2003) describes the
observation by David Smith, that “despite improvement of service infrastructure in poor parts
of the city, the apartheid legacy has been carried largely intact into the new era and that
major structural reforms that were required to alter the trajectory of urban change did not
occur [with the formalized end of apartheid legislation in 1994]” (ibid:2).

3. Historic Apartheid Transformations and Development of Urban Form

To understand whether new forms of fragmentation and segregation are indeed emerging in
response to South Africa’s changing position within the global economy, the case for a
configurational, urban analysis has already been justified and will be developed in this paper.
Firstly, this paper will present a normalized choice measure of the network segment analysis
for the 1940 map of Cape Town (Fig. 2). The choice measure, counts the times a space is

                                               2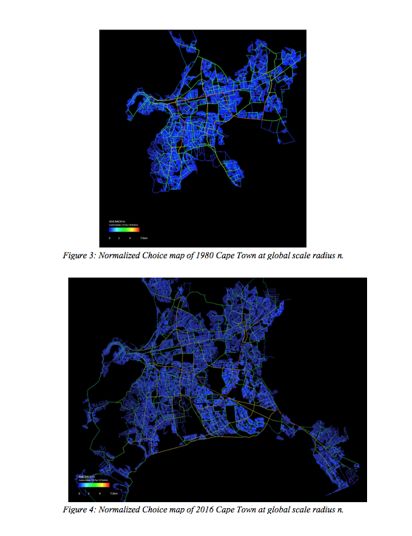
Gambill, Vendela   Morphological Developments of CT   54th ISOCARP Congress 2018

                                  3
Gambill, Vendela               Morphological Developments of CT       54th ISOCARP Congress 2018

passed, reflects the probability that a space is a chosen as a mid-point for movement for
from one trip to one point in the system to another. This is also known as the through-
movement potential. Figure 2 above shows choice measure at a global radius of Rn
suggesting all topological steps are taken into consideration. The angular segment analysis
drawn at this radius highlights the most significant routes within the network to be the routes
demarcated in red. That is starting from the CBD and continuing in a north easterly direction
and another parallel route moving to the south easterly direction. Interestingly, these two
routes meet at an intersection which was the cosmopolitan community of District Six at the
time. This was an area which was one of the most vibrant and ethnically mixed quarters of
Cape Town pre-1940s and was demolished as part of the Natives Resettlement Act in 1964.
These mixed communities were forcefully evicted to the townships allocated to them as part
of the Group Areas Act (Fig.1) in the Cape Flats and other peripheral locations.

The demolition of District Six, located at the most narrow point of these two main arteries,
would have caused extreme disruption in the flow of natural movement for people travelling
from east to west (Hillier et al 1993). This spatial planning logic exemplifies a misalignment
between spatial and functional logic that Space Syntax reveals, creating an inefficient use of
urban space and lack of integrative planning measures. Coherency between the subcenters
to arise as part of population growth would be vastly divisive from the existing CBD as a
consequence of this inner-city demolition.

3.1 Outward Displacement of Marginalized Racial Groups

Disparity in planning measures was exemplified as early as the District Six demolition, which
following a drastic up rise in migrants moving into the city, the majority of populations were
located at a distance from the CBD on basis of their ethnic classification. Before 1948 Cape
Town was the most racially integrated city, yet post-apartheid was classified as the least
ethnically integrated. By 1987 more than 1,300 group areas had been proclaimed, mapped
on Figure 1, and forceful removals of 126,000 families, mainly Colored and Indian, with 1
million Black African being resettled within allocated urban areas from 1950 to 1990 (Fig.1).
By proclaiming the inner cities and suburbs as white, other groups were pushed to the
outskirts and resultingly experienced separate education, health, social services and even
local authorities, leading to drastic living standards for these racially segregated areas
(Christopher 1994). This would have large effects on the coherency of global urban form.

In terms of urban morphological form, social patterned use of space was not following the
urban network as followed by normal functioning cities (Hillier and Hansen 1984). Instead
movement of people and agglomeration of housing, infrastructure, centrality, land-use, were
artificially-induced based on racial Group Areas Act. How this has created perpetuating
cycles of decline for certain areas of the city is yet to be exposed. Figure 3 shows the
normalized choice measure of an angular segment analysis of a 1980 map of Cape Town, by
which apartheid policy was deeply entrenched in the further spatial growth of the city from
the 1940 map (Fig. 2). What emerges in this map is a urban structure that does not follow the
‘spiky potato’ term coined by Hillier (1999) to describe the compact convexity in the live core
of the city. Instead an extremely irregular shape is recognized in Figure 3.

The centre of the settlement usually has the highest concentration and mix of activities,
creating ‘live centrality’ (Batty et al. 1997) where high levels of movement benefit land-use
and diversity of mixing. The ‘movement economy’ theory (Hillier 1996) was developed
following the notion of ‘natural movement’ (Hillier et al. 1993) to describe spatial organization
that follows movement patterns influence land-use choices and then generate multiplier
effects on movement to continue the more intensive development in the centre of the

                                               4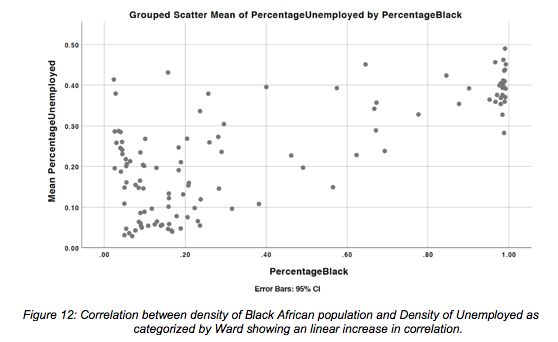
Gambill, Vendela   Morphological Developments of CT   54th ISOCARP Congress 2018

                                  5
Gambill, Vendela Morphological Developments of CT 54th ISOCARP Congress 2018
settlement (Hillier 1999). Disfigured centrality as revealed in Figure 3 therefore suggests that
the intensifying of the historic core is not occurring with use of the ‘multiplier effect’. Thereby,
the movement economy is not fulfilling its potential to create the diversity in the city-centre.
The impacts this could have on social functioning, land-use patterning and economic
dispersal throughout the city are potentially detrimental to the city.
3.2 Disfigured Centrality
Hillier (1999) argues that it is the movement economy that characterizes cities as it provides
the agglomerative potential of the virtual community by configuring the web of higher and
lower intensity areas. Cape Town’s urban network is not seamlessly integrated, but instead
fractured based on the growth shown in the 1980 map (Fig. 3) and 2016 map (Fig. 4). Here
the lack of a single centre suggests disparity between the network connecting all
substructures within the city. Rather than providing a highly compact and land-use diverse
global-centre, land-use adaption is not occurring as movement potentials provided by the
urban network are restricted and fractured.
Centrality is understood across scalar levels ranging from global to local level centrality.
Globally, the centre acts as the main attributive point for the region as a whole and single
system. Locally, however communities within the local boundaries will be adhering to certain
individual, local grid conditions. As settlements grow, spatial pressure inherently shifts the
focus of centrality, allowing natural grid intensification and smaller block size to create
greater ease of movement within the centre, also known as the ‘Siksna process’ (Hillier
199:108). Centrality happens as a natural relationship between configuration of urban forms
and attraction of urban movement, however Cape Town has been historically planned to
follow an artificially different centre, that of the historic CBD. The centre in this case has not
been a natural attractor but artificially imposed to a different area based on rigorous continual
treatment of most intensive central point for the white population and maintaining its land-use
hierarchical structure. Rather than diversifying with growth, this imposed centre, marked as
the historic centre in the 1940 map (Fig. 2), has maintained a homogenous reputation,
therefore not diversifying or attributing different specialisms throughout the sub-areas of the
city (ibid). Urban growth in a city of Cape Town’s topography would naturally have a shifting
centrality towards the centre of the system to where suburbs have developed, which has not
occurred due to various enforced policies.
The centrality marked red on the 1980 map (Fig. 3) was once an ‘edge city’ and has
continued to follow in this domain based on artificially enforced centrality remaining in the
historic CBD. In this regard, suburbs have consequently become farther and more remote
from the determined centre of Cape Town, causing administrative and employment
opportunity problems. Not only is distance for marginalized communities to the enforced CBD
a problem in terms of methods of commuting and accessibility, but the lack of follow-up of
land-use to subcentres in Cape Town are unnaturally occurring. The main functional centre
of Cape Town is restricted to the remote location of the historic CBD, which causes a number
of problems in terms of preventing agglomerative potentials and multiplier effects associated
with ‘natural movement’ and the ‘movement economy’ (ibid; Hillier 1996).
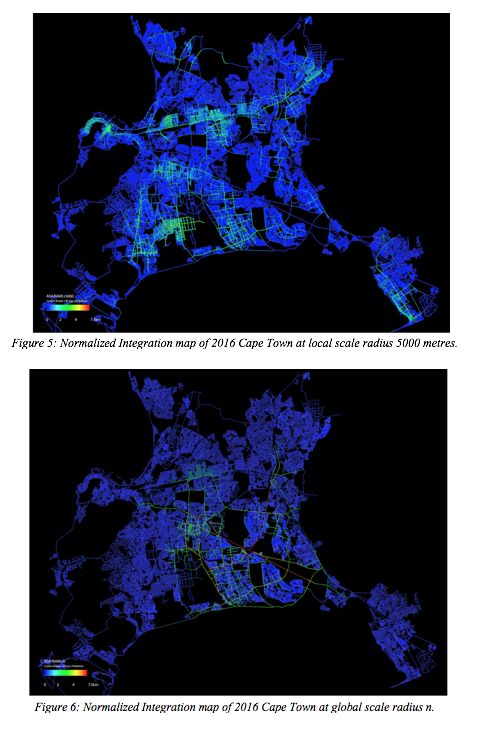
3.3 An Imposed Artificial Attractor of the Historic Centre and CBD
The imposed artificial centre reduces the natural hierarchy of centres and subcenters that
pervade a typical urban system to be reduced to unrivalled urban development. There are
weak levels of competition and connectivity between subcentres contributing to the lack of
production of a coherent centrality. To understand the impacts of an unused global centrality,
normalized integration of segment angular analysis was analysed at both local scale radius
of 5000m (Fig. 5) and global scale radius of n (Fig. 6). Integration measure maps the to-
movement potential, suggesting the likelihood that certain places are a chosen destination.
6Gambill, Vendela Morphological Developments of CT 54th ISOCARP Congress 2018
7Gambill, Vendela Morphological Developments of CT 54th ISOCARP Congress 2018
There is a problem as the warm coloured structure that is revealed on both the local scale
map (Fig.5) and global scale map (Fig.6) do not correspond with how the urban street
network is actually used. Again, this suggests the divergence between natural movement
pattern of the network due to artificial barriers to movement. Furthermore, these barriers are
due to repeatedly reproduce to create continued fractured urban street network.
Divergence between hierarchy of centres and subcentres is revealed at local scale (Fig.5),
where heated localities are separated further away from each other, without maintaining the
global core as heated in Figure 6. This reveals the polycentric nature of the city, however
suggests its failure to comply with actual movement economy patterns. At a global scale, the
normal ‘spiky potato’ form does not exist (Fig. 3) and (Fig. 6) and at a local scale, global
centrality does not appear and local centrality are moving towards opposite ends of the urban
structure. This discontinuity reflects the result of a long-term effect of lacking rules of ‘natural
movement’ and following the integrative process of the ‘movement economy’ (Hillier 1999).
Understanding the spatio-functional production of centrality is essential to identify linkages
between policy and urban form, then providing the insight to conserve or change
reproductive patterns based on what is spatially observed (Batty et al 1997:22). That
configuration generates attraction does not hold if the socio-political system does not allow it
to (Hillier 1999). Instead configuration is being bound to historic policy which is causing
attraction inequalities within the urban centre and tactical spatial restructuring policies must
be introduced to actively reintegrate communities. Allowing the spatial form to naturally follow
its current spatial patterning will create further inequalities (Harrison 2003; Todes 2003).
The findings of this section have included an understanding of greater economic disparity
than need be based on conservative spatial processes reiterating centrality as the artificial
historic centre. Furthermore, centrality is not naturally shifting as response to the ‘movement
economy’ that comes with population growth, leading to a great proportion of the population
economically segregated. The spatial economy of the region follows the pattern of an ‘edge
city’ for the large proportion of citizens, not integrating with the pre-existing urban form as
seen in the shift in centrality from Figure 3 to Figure 6, therefore cutting off spread of
economic prosperity. Communities with the highest income, are geographically located
farthest from the artificially-imposed CBD and are able to add to the micro-economy, but all
remaining subcentres of the settlement (Fig. 5) continue to be cut-off from this economic
centre, perpetuating the cycle of racially-induced poverty who live disconnected. Buffer strips
imposed by historic apartheid planning, remain in-tact between communities causing lack of
appropriate cohesion and network connectivity for the entire urban region to function with its
micro-economies. It is essential for post-apartheid planning take the network configuration of
its spatial system into consideration. The responsibility remains for policy to reanimate the
natural occurring centrality of the system and integrate opportunity for the currently cut-off
masses, unlocking economic growth (Hillier and Vaughan 2007; Karimi 2012).
4. Socio-economic Outcomes of Post-apartheid Planning
The syntactic analysis and its limitations have been diagnosed in representing the urban
structure of Cape Town, it is essential to evaluate the possible outcomes as fed through the
census report of social coherency and employment opportunity for communities most
effected by spatial structure. Ultimately, those least economically privileged are most effected
by the centrality or lack of, within the urban structure. It is evident in Figures 7-9 that group
population census is following the same permutations as was enforced by the Group Areas
Act of 1955. That is, black populations restricted to very small allocated areas (Fig.8) and
living in detrimentally high population densities at the peripheries of the urban agglomeration,
and the colored populations living in slightly lower densities also mainly at the urban
periphery (Fig.7). In contrast the white population lives closes to the CBD and core of
economic activity. Arguably this impacts the effects of employment and unemployment
8Gambill, Vendela Morphological Developments of CT 54th ISOCARP Congress 2018
9Gambill, Vendela Morphological Developments of CT 54th ISOCARP Congress 2018
10Gambill, Vendela Morphological Developments of CT 54th ISOCARP Congress 2018
(Fig.10-11). The spatial pattern of unemployment (Fig.11) follows precisely the pattern of
highest density of black population. In this sense there seems to be a correlation between
proximity of Black African populations, which needs to be held for density, as a result of
distance from the CBD, leading to higher rates of unemployment (Fig.12).
Holding for other variables, there is a direct correlation between the two, which through the
research presented in this paper is likely to be linked with spatial and functional factors.
Further research includes the need to correlate with proximity for societies located from the
CBD and research the opportunity for transit-oriented development, a currently enthused
spatial planning mechanisms, in re-appropriating apartheid fractions (City of Cape Town
2016).
5. Conclusions
This paper has presented an evaluative strategy and analytical tool for understanding the
socio-economic impacts of apartheid planning and post-apartheid urbanism, through a
spatial configurational lens. This is to provide greater insight for policymakers to understand
the importance of spatial conditions on reiterating the opportunities for marginalized
communities within the apartheid context, and encourage reflection over why current
planning regimes may not be sufficient in reversing the problematic disassociation from
natural centrality process with growth to the region. Further research into regional urbanism
and worlding could be combined to create an even more powerful argument, to understand
the disparity between land-use pattern and centrality as a process in this apartheid urbanism
agglomeration (Roy 2011). The economic potential of the region is yet to be unlocked and
could be manifested with reanimation of natural urban global centres and subcenters, which
arguably needs to be the focus of planning discourse for South African planners.
11Gambill, Vendela Morphological Developments of CT 54th ISOCARP Congress 2018
References
Batty, M., Couclelis, H. and Eichen, M. (1997) ‘Urban systems as cellular automata’, Environment and
Planning B: Planning and Design, 24(2), pp. 159–164.
Burger, M. and Meijers, E. (2011) ‘Form Follows Function? Linking Morphological and Functional
Polycentricity’, Urban Studies. SAGE Publications Ltd, 49(5), pp. 1127–1149. doi:
10.1177/0042098011407095.
Carvalho, R. and Penn, A. (2004) ‘Scaling and universality in the micro-structure of urban space’,
Physica A: Statistical Mechanics and its Applications, 332(1–4), pp. 539–547. doi:
10.1016/j.physa.2003.10.024.
Christopher, A. J. (1994) The Atlas of Changing South Africa. London: Routledge.City of Cape Town
(2012) ‘2011 Census – Cape Town Trends and Change - 10 years: 2001-2011’, pp. 1–16.
City of Cape Town (2017) ‘Cape Town Municipal Spatial Development Framework ( MSDF ) 2017 -
2022. Review 2017 Draft.’, 2000(32), pp. 2017–2022.
City of Cape Town (2016) ‘City of Cape Town Transit Oriented Development Strategic’. Available at:
http://www.tct.gov.za/docs/categories/2404/TCT_TOD_Framework.pdf.
Harrison, P. (2003) ‘Fragmentation and Globalisation as the New Meta-Narrative’, in Harrison, P.,
Huchzermeyer, M., and Mayekiso, M. (eds) Confronting Fragmentation: Housing and Urban
Development in a Democratising Society. Cape Town: University of Cape Town Press.
Hillier, B. (2001) ‘A theory of the city as object’, Space Syntax Third International Symposium.
Hillier, B., Penn, A., Hanson, J., Grahewski, T. and Xu, J. (1993) ‘Natural movement: Or configuration
and attraction in urban pedestrian movement’, Environment and Planning B: Planning and Design, 20,
pp. 2029–2066.
Hillier, B. and Penn, A. (1996) ‘Cities as movement economies’, Urban Design International, 1(1), pp.
49–60.
Hillier, B. (1999) ‘Centrality as a process: accounting for attraction inequalities in deformed grids’,
Urban Design International, 4(3), pp. 107–127.
Hillier, B. and Hanson, J. (1984) The Social Logic of Space. Cambridge, UK: Cambridge University
Press.
Hillier, B. and Penn, A. (2004) ‘Rejoinder to Carlo Ratti’, Environment and Planning B: Planning and
Design, 31(4), pp. 501–511. doi: 10.1068/b3019a.
Hillier, B. and Vaughan, L. (2007) ‘The City as one thing’, Progress in Planning, 3(67), pp. 205–230.
Karimi, K. (2012) ‘A configurational approach to analytical urban design: “Space syntax” methodology’,
Urban Design International, 17(4).
Roy, A. (2011) ‘Urbanisms, worlding practices and the theory of planning’, Planning Theory, 10(1), pp.
6–15.
Todes, A. (2003) ‘Housing, Integrated Urban Development and the Compact City Debate’, in
Confronting Fragmentation: Housing and Urban Development in a Democratising Society. Cape Town:
University of Cape Town Press.
Turner, A. (2007) ‘From axial to road-centre lines: A new representation for space syntax and a new
model of route choice for transport network analysis’, Environment and Planning B: Planning and
Design, 34(3), pp. 539–555. doi: 10.1068/b32067.
12You can also read