Rock River Flood Monitoring and Evaluation - Summary Presentation February 5, 2021 Nick Hayden, PE & Rob Montgomery, PE (MARS-EOR) - Town of Ixonia
←
→
Page content transcription
If your browser does not render page correctly, please read the page content below
Rock River Flood Monitoring and Evaluation

                  Summary Presentation
                    February 5, 2021
    Nick Hayden, PE & Rob Montgomery, PE (MARS-EOR)

        water I ecology I community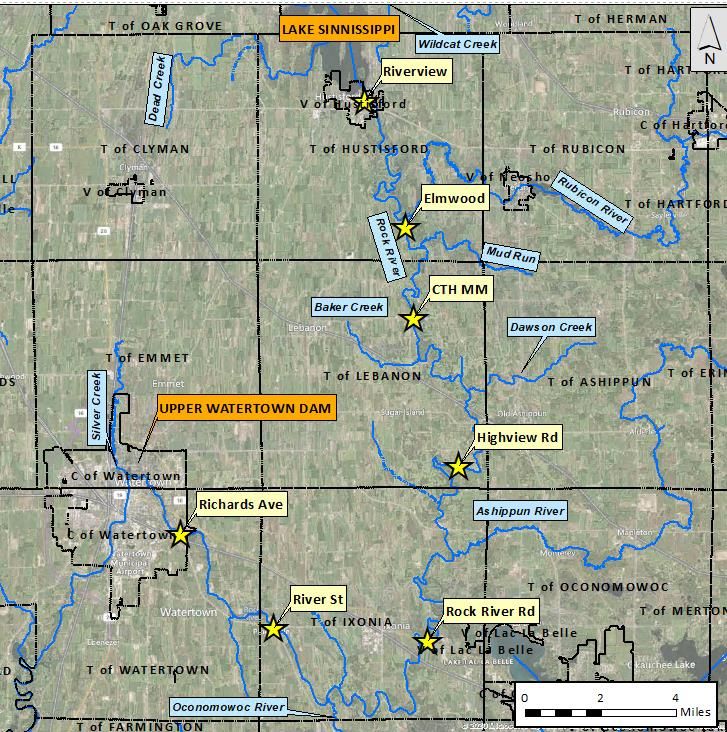
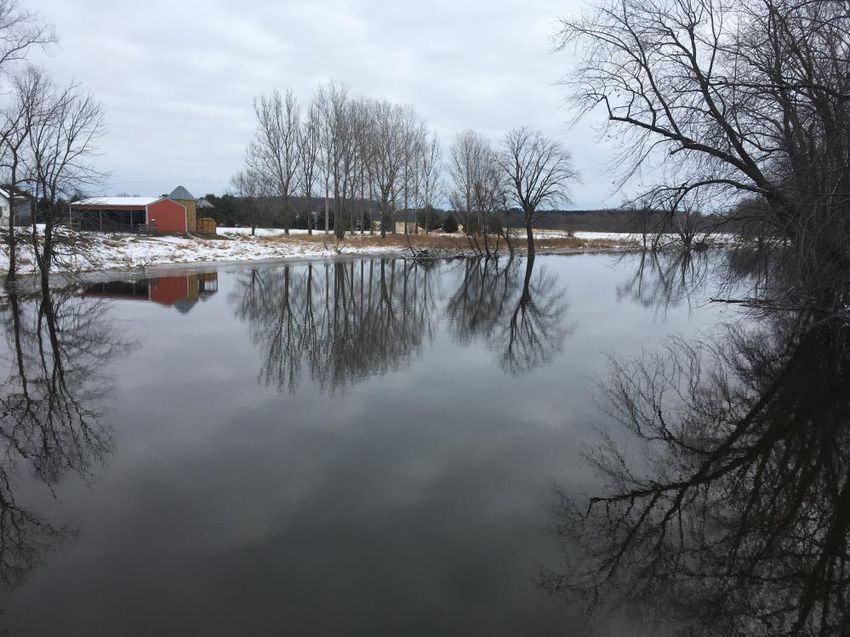
Summary of the Issue

   We conducted this monitoring and analysis project for Steve Folkman and Tim Cargill, both
   of whom own land on the Rock River in the Town of Lebanon. They, and many other
   property owners in this reach of the Rock River, have been negatively impacted by high,
   extended water levels on the Rock River. Since the early 80’s they have seen a steady
   increase in flooding in both water levels and duration. Flooding has gone from being
   associated with spring thaws and rainstorms to being persistent for as long as 11 months a
   year, particularly in the last several years (since 2018).

   For example, Steve Folkman has lost the use of over 20% of his land due to flooding, with
   over 50 acres of crop, pasture, and woods affected with major tree and crops loss. Existing
   drainage ditches and berms have become ineffective due to the volume and levels of water
   backed up due to Rock River flooding. Waterfowl hunters traversing their lands when
   flooded has increased due to the increased duration and height of flooding from the Rock
   River, which is a concern due to the value of the livestock they own that are kept in proximity
   to the hunters and potential injury from stray shots.
Summary of the Issue (cont.)

    The issues our clients are experiencing are not unique to them – this has become an issue for
    riparian landowners adjacent to the Rock River along its path through the Town of Lebanon
    as wells as riparians upstream (Town of Hustisford) and downstream (Town of Ixonia) who
    live along this very flat section of the Rock River. Property devaluation, loss of usable land
    (agriculture and recreational) and land access, loss of mature trees and floodplain forest
    wetland habitat, are all impacts of sustained high water to landowners. We also recognize
    that there are downstream water quality concerns due to frequent flooding of agricultural
    operations (feed lots, fertilized lands, etc.), and that high water becomes a public safety issue
    when flooded roadways restrict emergency vehicle access.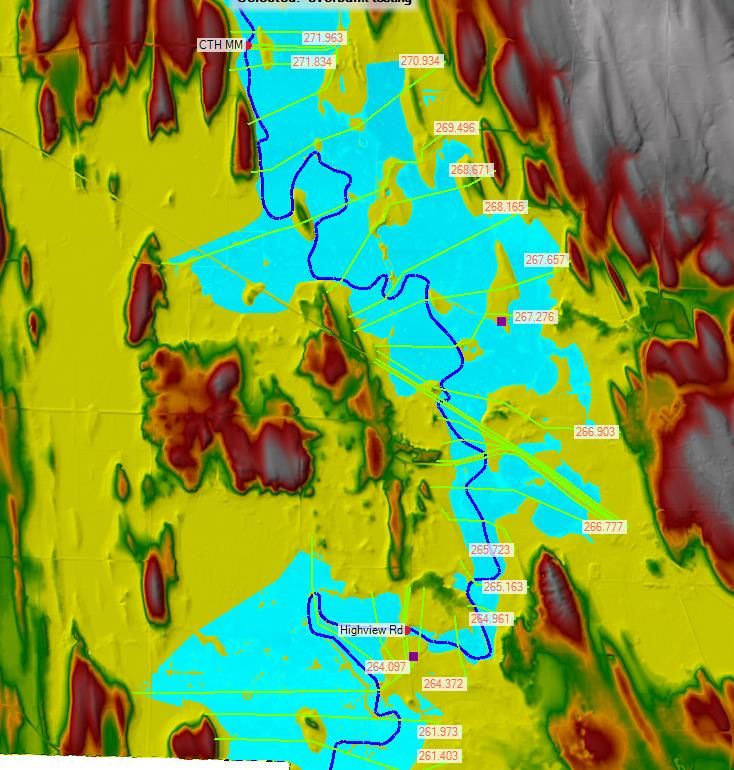
Summary of the Issue (cont.)

    In addition to public safety concerns, road closures due to flooding have also been a burden
    on municipalities. The specific cases we know of are in the Town of Lebanon including
    Monroe, Upham, and LaFollette Roads. The town sends an employee out weekly, or more
    frequently during high water, to determine if they need to physically close Monroe Road.

    The objective of this study has been to analyze the increased flood durations and to identify
    potential causes and effects. Part of this project included a water level monitoring study
    which was conducted from August 2020 to December 2020. This report summarizes our data
    collection study, analysis, possible remedies, and action plan to resolve these issues.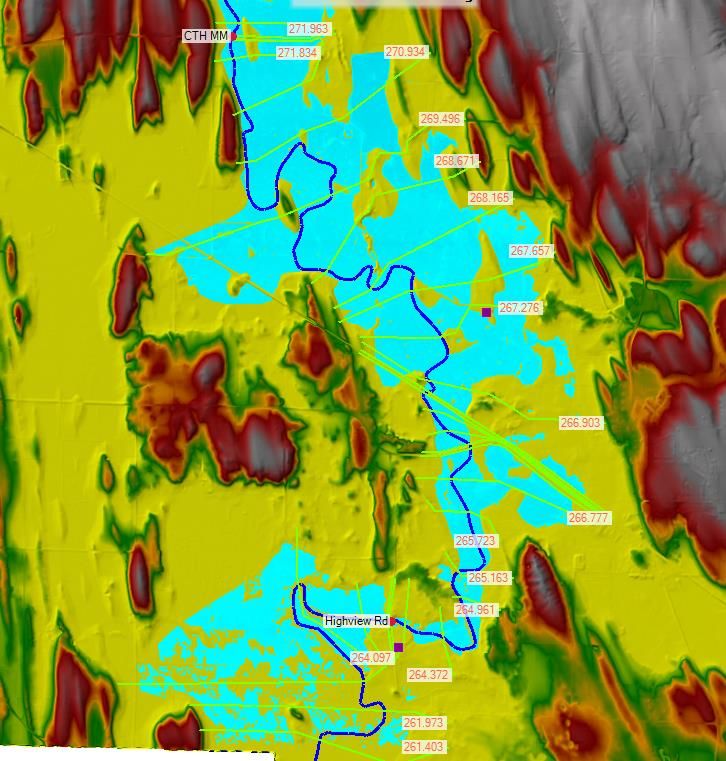
The graphics on this and the next slides quantify
the extent of the flooding in this area of the Rock
River that has occurred in the last several years.
This graph shows the discharge of the Rock River
measured at the US Geological Survey gage at
Watertown over the past five years- in blue. The
long-term average discharge rate is shown in
orange. This graph illustrates that flooding since
2016 has had far higher flow rates and longer
duration than flows that typically occurred over
the past 85 years.

Note the discharge has substantially exceeded
1000 CFS for a large percentage of the year after
2016. In 2018 and 2019 flows exceeded 1000
CFS for all but a few months of the year.

Summary of the Issue (cont.)

    The Rock River in the Town of Lebanon is very flat, with an average slope of only 0.25 ft /
    mile (0.005%) including sections of adverse slope (the riverbed actually rises moving
    downstream). This slope causes the river to drain slowly, and when there is more flow in the
    river than the main channel can convey water spreads out across the broad, flat floodplains
    and recedes very slowly. The images below, from the DNR’s steady flow HEC-RAS model of
    the river, illustrate the extent of out-of-channel water (cyan) as flows increase.

                                                                                              >7,500’

                                                                                         >7,500’
 500 cfs - river between banks      750 cfs – pockets of water in    1,000 cfs   1,250 cfs – extensive water in
                                 floodplain, some wider inundation                  floodplain, >1 mile wide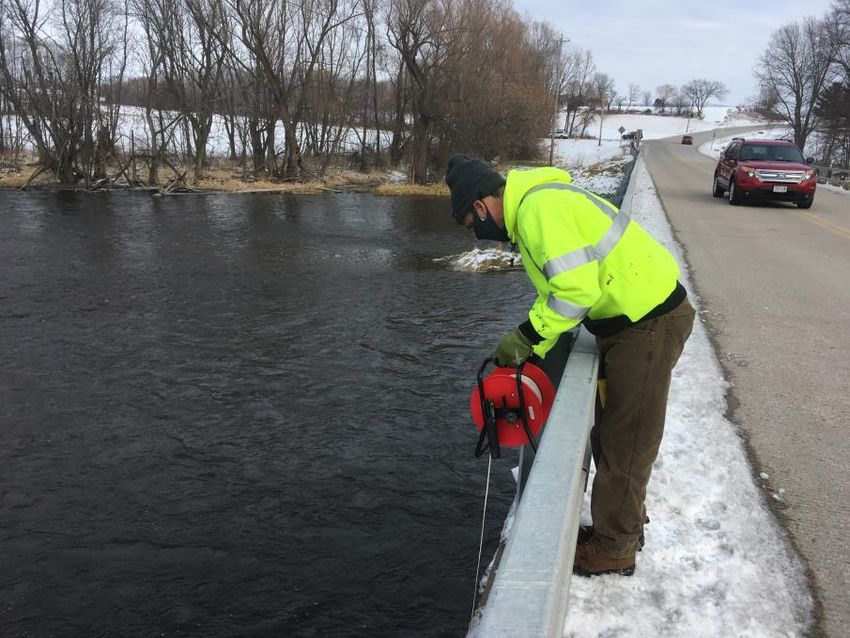
Summary of the Issue (cont.)

    Using the HEC-RAS model, we determined the total out-of-channel flooded area for each
    flow rate. The table below shows this relationship between flow and out-of-channel flooding
    area from downstream of Hustisford Dam to CTH P near Ixonia.
                   Flow Rate     Out-of-channel wet area      Area increase (compared to 500 cfs)
                    500 cfs            15,500 acres                            -
                    750 cfs            18,400 acres                         + 19%
                   1000 cfs            23,350 acres                         + 51%
                   1250 cfs            25,400 acres                         + 64 %

    These data illustrate two points:
    1.   Impacts from out-channel flooding is not unique to our clients, or for only a small portion along the Rock
         River in the Town of Lebanon. The out-of-channel wet areas at 500 cfs are likely wetlands or other
         naturally wet areas, but when flows increase from 500 cfs to 1250 cfs it causes 9,900 additional acres
         (15.5 square miles) of land to be flooded and water depths to increase by over 2’. This wide, deep
         inundation is what impacts residents of the Town of Lebanon, and these high flow rates have been seen
         frequently, and for extended periods, over the last several years.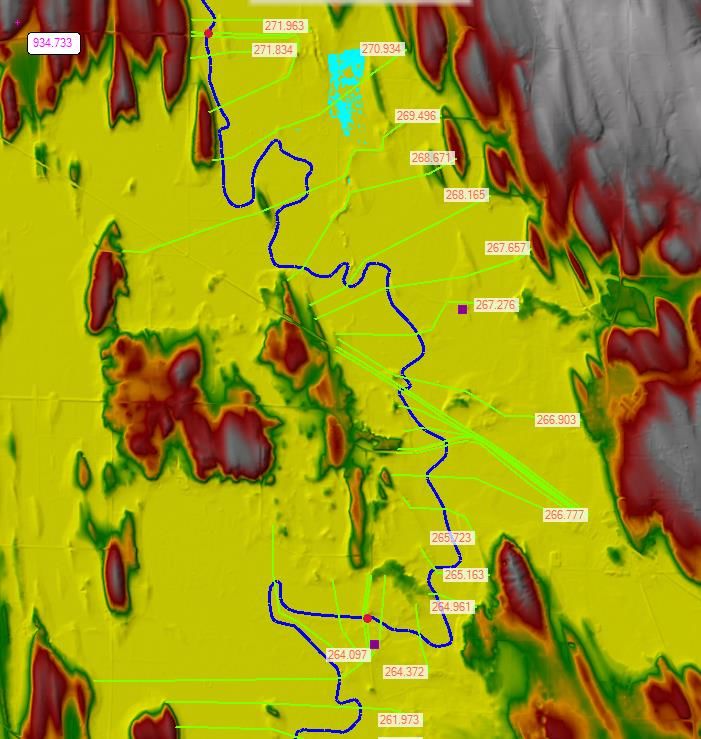
Summary of the Issue (cont.)

    Using the HEC-RAS model, we determined the total out-of-channel flooded area for each
    flow rate. The table below shows this relationship between flow and out-of-channel flooding
    area from downstream of Hustisford Dam to CTH P near Ixonia.
                  Flow Rate      Out-of-channel wet area     Area increase (compared to 500 cfs)
                   500 cfs            15,500 acres                            -
                   750 cfs            18,400 acres                         + 19%
                   1000 cfs           23,350 acres                         + 51%
                   1250 cfs           25,400 acres                         + 64 %

    These data illustrate two points:

    2.   There seems to be a threshold, between 750 cfs and 1000 cfs, where flood extents increase rapidly in
         response to increased flows. In the analysis above, 50% (~5,000 acres) of the total flooded area increase
         occurred between 750 and 1000 cfs.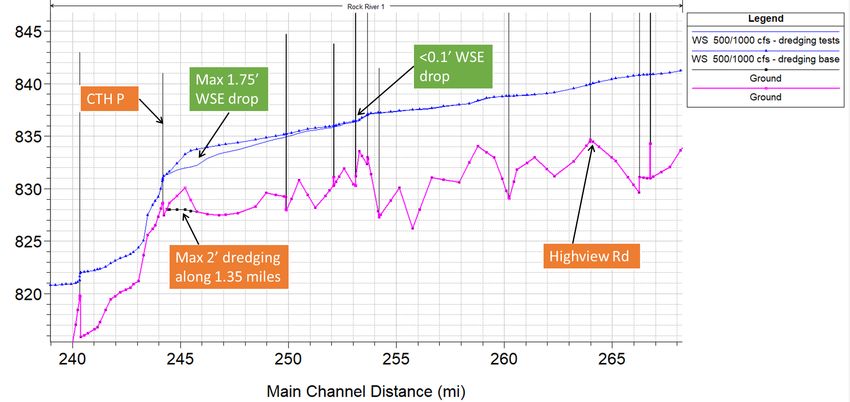
Summary of the Issue (cont.)

 One obvious source of recent
 flooding is that higher rainfall
 amounts that have been
 observed across Wisconsin, and
 particularly during the last
 several years. This plot shows
 annual precipitation in recent
 years at Watertown, the nearest
 rain gage with the longest period
 of record. 2018 was by far the
 wettest year on record – annual
 precipitation was 24” above the
 long-term average – and was
 followed by a wet 2019 (10.5”
 above average).
Summary of the Issue (cont.)
 This increased precipitation has led to year-round high base flows in many river systems across
 Wisconsin over the past few years. Additionally, an increase in average streamflow across the
 upper Midwest over the past decades has been well-researched and documented, with many
 rivers seeing a sharp increase (often doubling) of average flow when comparing the period after
 the 1980s to the previous conditions. The increase in discharge has been attributed to a
 combination of increased precipitation and land use changes (agricultural drainage, urban
 development, etc.).

 Discharge leaving Horicon Marsh shows this
 trend in the Rock River. Annual flows have
 generally increased over the gage record and
 have been particularly high recently, with
 average daily flow in 2019 exceeding that seen
 during the last major regional flood event (2008).
Summary of the Issue (cont.)

The same streamflow increase is evident at the USGS gage on the Rock River in Watertown. The
flow data show a steady increase over the period of record, to nearly triple the average flow
observed in the 1940s.
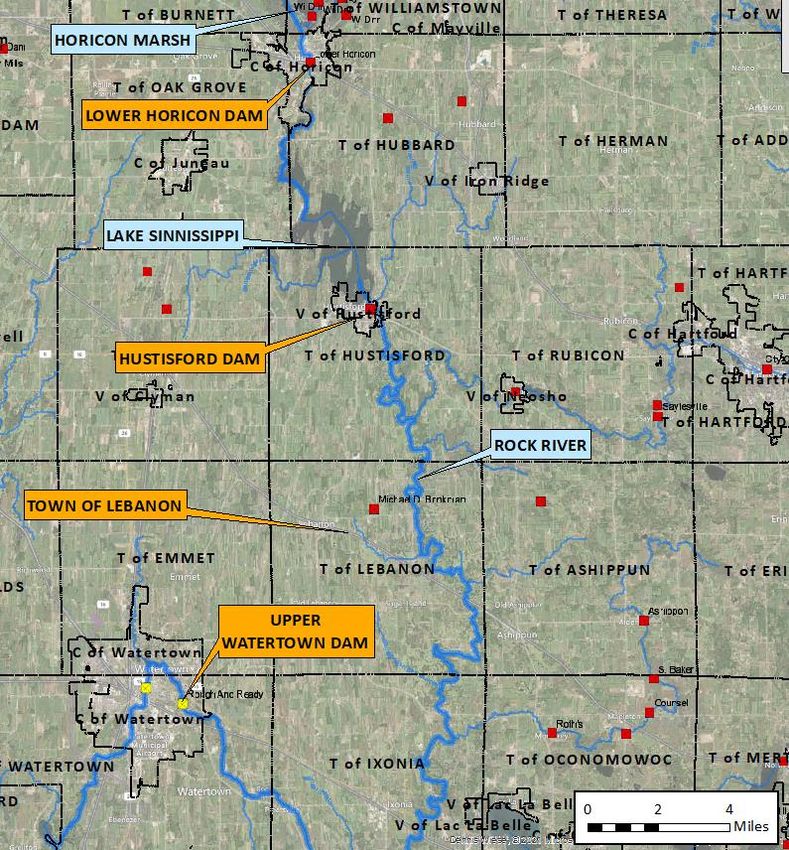
Summary of the Issue (cont.)

 There are many dams on the Rock River upstream
 and downstream of the Town of Lebanon, with the
 nearest upstream dams being Lower Horicon and
 Hustisford, which are connected by Lake
 Sinnissippi. Upper Watertown is the next dam
 downstream.

 Part of the objective of this study was to better
 understand how dam operation impacts Rock
 River flow and timing, and to learn if there are any
 management strategies that could provide relief to
 the many riparian landowners in this stretch. We
 are also evaluating if there are any physical
 restrictions contributing to high water levels in this
 area.
Monitoring and analysis activities

    We developed a water level monitoring program, in cooperation with the dam operators at
    upper Watertown, Hustisford and Lower Horicon to collect data that will help understand
    the hydraulics of the system. We established water level monitoring locations at 7 sites along
    the Rock River between Hustisford and the Upper Watertown Dam. These locations were
    based on previous watershed and RAS model analysis and access opportunities. At 6 sites we
    installed edge-of-river wells using fence posts and PVC pipe, and at the “Riverview” site in
    Hustisford we re-established a former USGS gage site. Well locations are shown on the
    following slide.

    HOBO or Solinst water level loggers reading at 15-minute increments were placed at each
    site. Loggers were installed on August 13, 2020 and removed on December 17, 2020. We
    established local benchmarks and surveyed the top of PVC with a level and took periodic
    depth-to-water measurements from nearby bridges to translate water level readings to
    estimated river stage elevations.
Monitoring and analysis activities
7 monitoring locations (upriver to downriver):
• Riverview (old USGS Hustisford site)
• Elmwood
• CTH MM
• Highview Rd
• Rock River Rd
• River St
• Richards Ave
Other data sources:
• USGS gages (lower Horicon, Watertown)
• Hustisford Dam operations data
• NOAA weather stationsMonitoring and analysis activities
We used spreadsheet tools to process and analyze the water level, flow, and rainfall data. We
conducted more detailed hydraulic analysis using the Rock River HEC-RAS model (WDNR,
2013). Key analyses included:
• Evaluated rainfall and flow records
• Assessed dam operations during monitoring period
• Compared HEC-RAS model predicted water levels to previous WDNR measurements and our
data
• Identified flow rates that cause out-of-bank flow in the Town of Lebanon
• Modeled impacts of dam operations on water levels (steady flow model)
• Modeled impacts of downstream constrictions on water levels (steady flow model)
• Summarized and analyzed key events during monitoring program (large rainfalls, dam
operation manipulations)
• Converted the HEC-RAS model to unsteady flow to investigate selected eventsObservations
• Rainfall
• River flow and stage
• Streamflow
• Stage data
• Gate manipulations
• Prolonged high flows
• Effects of upstream & downstream controlsRainfall during monitoring period The upper watershed (Horicon and Beaver Dam stations) received ~ 14” of rain during the monitoring period, while the lower watershed (Watertown station) received ~10.5”. The average August through December rainfall for Dodge County is ~14.2” based on the last 50 years of data at the Horicon wastewater treatment plant, meaning that overall watershed rainfall during our monitoring period was slightly below the long-term average.
Rainfall events during monitoring period

 • The period leading up to the test
   through late August was relatively dry

 • Horicon measured 4.8” of rain from
   August 25 – Sep 2, with an additional
   1.5” from Sep 8 – Sep 13. The 10-day,
   2-yr rainfall for Horicon is 4.8”.

 • The other significant runoff producing
   event was the 2.2” of rain in a single
   day on October 23. The NOAA Atlas 14
   24-hour, 1-yr rainfall for Horicon is
   2.3”.

 • The southern part of the watershed
   received less rain on Oct 23 (1.33” in
   Watertown)
River flow during monitoring period – Horicon vs. Hustisford

• At the start of monitoring the lower
  Horicon dam was closed to try and raise
  their water levels

• The multi-day rainfall in late Aug – early
  Sep increased flows up to 750 cfs, and
  flows stayed high for several weeks

• Note that the rainfalls were not
  unusually large – the largest series of
  storms at the end of August had a return
  period of approximately 2-years

• We coordinated a 1-day test of 1,000 cfs
  release from Hustisford on Sep 30 – Oct 1

• The heavy rains on Oct 23 raised flows
  from 200 cfs to 1,000 cfs, and these high
  flows persisted for nearly six weeks up to
  the very end of our monitoring period
River flow during monitoring period – Horicon vs. Watertown

 • The downstream peaks occur over a
   week later than at Horicon.

 • Discharge at Watertown is typically
   50-100% higher than at Horicon.

 • This increased discharge is
   consistent with the increasing
   watershed area from 456 square
   miles at Horicon to 969 square miles
   at Watertown, meaning that the
   river is gaining both storm runoff
   flow and groundwater baseflow
   between these locations.
River stages during monitoring period

• The Riverview (old USGS site)
  location reflects flow from Hustisford
  Dam and changes abruptly based on
  gate operations. The levels don’t
  change too much because the river
  channel is steep.

• The 4 middle loggers (Elmwod, CTH
  MM, Highview and Rock River Rd.)
  are in the very flat portion of the
  Rock River which includes the Town
  of Lebanon. These gages will be
  referred to as the "Town of Lebanon
  gages".

• The 2 downstream loggers are at
  locations with lower riverbed
  elevations and are closer to
  Watertown. The Richards logger is in
  the pool behind the Upper
  Watertown dam.
River stages during monitoring period

With the map again for reference.
Very little elevation drop over 35
river miles in middle section.
Early portion of monitoring period

 There was no rainfall in the first
 two weeks of monitoring and
 lower Horicon dam was mostly
 closed to raise the pool to their
 target level.

 Downstream water levels in the
 Town of Lebanon fell
 approximately 1 foot during this
 dry period when flows leaving
 the Horicon gage were below 200
 cfs.
Large, extended rainfall late Aug – early Sep
 Lower Horicon and Hustisford
 increased discharge following the
 4.8” of rain over 9 days (Aug 25 –
 Sep 2).

 Following the rains, the water
 level in lower Horicon marsh
 stabilized near the target of ~7.2’
 on September 6th.

 River levels in the Town of
 Lebanon rose upwards of 5 feet
 and remained high for over a
 month (until our test Sep 30).

 The downstream gages showed a
 much smaller water level change.
 The Upper Watertown pool was
 very steady during this time.
Large, extended rainfall late Aug – early Sep (cont.)
 OBSERVATIONS:

 •   The downstream peak at River St
     occurred ~ 10 days after the peak
     at Elmwood.

 •   The magnitude of change was
     MUCH greater in the Town of
     Lebanon than elsewhere. This
     reach is very sensitive to higher
     flows and very slow to drain.
     Some of these higher flows are
     due to tributary watersheds
     downstream of Hustisford.

 •   Levels at the Upper Watertown
     dam remained steady, and the
     water surface is 15-20 ft lower at
     the dam than in the Town of
     Lebanon.
Hustisford 1000 cfs pulse test We coordinated a 24-hour, 1,000 cfs pulse from Hustisford to study PULSE river behavior at the flow rate downstream, including the timing and magnitude of river level changes. Leading up to the test Hustisford closed their gates, and water levels fell downstream ~ 1.5 ft over 3 days. The test raised levels at Elmwood over 2 feet but had less impact downstream, and levels subsided fairly quickly - within a few days - after the 1-day test.
Hustisford 1000 cfs pulse test (cont.)

                                         PULSE
 During this same time, the Upper
 Watertown dam gates were
 briefly opened, as seen in the
 Richards logger. The River Street
 logger, 4 miles upstream from
 Richards, doesn’t show any
 impact from this opening. This
 brief lowering of the Upper
 Watertown pool provided useful
 data on the hydraulics of the
 steeper downstream portion of
 the study reach – discussed
 further below.
Hustisford 1000 cfs pulse test (cont.)
OBSERVATIONS:
PULSE
• Despite the slow timing of
flood flow peaks moving
downriver, the Town of
Lebanon gages were fairly
quick to respond to decreases
in flow coming from Horicon
and Hustisford.
• When the river isn’t already
high, there seems to be
enough storage in this section
of river to handle this higher
flow (1,000 cfs) for a limited
duration.Heavy rain and long duration high water The 2.2” of rain (an approximately 1- year storm) measured at Horicon on October 23 (possibly more in the upper watershed) had a significant impact on water levels for the remainder of the monitoring period. Water levels increased by ~3 feet at Elmwood and remained high until the very end of the monitoring period when Horicon outflow dropped from 600-800 cfs down to ~200 cfs and the river dropped quickly. We recorded ~1.5 feet of drop before pulling loggers due to ice, but our clients reported the river continued to drop down to about 3 ft lower than it had been.
Heavy rain and long duration high water (cont.)
 On the day of heavy rain (Oct 23),
 Upper Watertown opened gates
 based on locally high runoff.
 Instead, the river upstream of the
 dam dropped enough to expose
 mud flats and the pool fell almost
 2 feet below the minimum
 elevation. The operator received
 many complaints from the City
 during this event regarding low
 water levels upstream, and
 promptly closed the gates to
 restore water levels.

 Despite this sudden lowering, no
 water level change is seen
 upstream at River St – instead
 levels there continue to slowly
 rise, similar to upstream.
Heavy rain and long duration high water (cont.)
 OBSERVATIONS:

 • The sustained flow of 600-800
   cfs was too high to allow flood
   waters to recede in the Town
   of Lebanon. Once the river is
   out-of-bank, it seems that
   inflow needs to be ~400 cfs or
   lower to allow water to drain
   from the floodplain and for
   the water levels to drop.

 • The Upper Watertown dam
   does not impact river levels
   very far upstream of its pool.
   Opening gates doesn’t provide
   storage for upstream flow or
   drop water levels in the Town
   of Lebanon.
Monitoring observations summary
 •   We recorded data during one targeted Hustisford pulse test (9/30) and two occasions of sudden lowering of the Upper
     Watertown dam pool (9/30 and 10/23). These events helped capture river behaviors relating to upstream flow and the
     downstream control of the Upper Watertown dam.

 •   We also observed two periods of long, extended flows that continued long after precipitation events. These are the types
     of flow situations that have frustrated residents in the Town of Lebanon and elsewhere along the Rock River, which is
     likely confounded by lack of information about what is going on upstream at the many dams and reservoirs, and lack of
     information on inflow to the river from the watershed downstream of Hustisford. The long timing lag, and the potential
     for rainfall totals to vary widely over a watershed this large, add to this disconnect.

 •   The sustained high water levels in the Town of Lebanon appear to be caused by inflows from upstream, and not by the
     operations of the Upper Watertown dam. This confirms steady-state HEC-RAS modeling of the Upper Watertown dam.
     While the flow coming from Horicon and Sinnissippi seems to be control behavior in the river here, there is certainly
     inflow from the Rubicon River and other tributaries that fills up floodplain storage during high flows and may also
     contribute to long, sustained high flows.

 •   There is limited storage volume and hydraulic capacity in the flat middle section, and once a certain flow rate is exceeded
     for a duration of time there are problems for residents and communities in this section. Based on October and November
     records, it seems that flows in excess of 400-600 cfs coming from Horicon/Hustisford are near the threshold of flows that
     cause flooding issues.
Operating Orders During the monitoring work we also requested information on operating orders for dams upstream and downstream of the Town of Lebanon. WDNR provided the following: • Upper Horicon / Pool 1 (Federal): normal pool level of 77.0 local datum; no minimum or maximum. The conversion of the local datum to vertical datums referenced to sea level is not known. According to the DNR operator downstream, there is some storage in the side pools, and the main pool sometimes does drawdowns in late summer (to encourage macroinvertebrates, reptiles and amphibians to burrow) • Lower Horicon dam (DNR): Ordered max is 75.3 local, which according to the field file can be converted to NGVD29 by adding 781.06 to get 856.36 (NGVD29). The standard Dodge County shift from NGVD29 to NAVD88 is -0.2 ft, so the NAVD88 max is approximately 856.16. The DNR operator said that the target water level is 7.20 on the USGS gage, and this does not vary seasonally. There is no winter drawdown because they don’t want to freeze out burrowed animals (food supply for waterfowl production area).
Operating Orders (cont.)

 • Hustisford dam: The ordered maximum is 99.5 local, which transcribes to “855.77” in a
   datum described in records only as “USGS” that is usually interpreted as NGVD29, but may
   not precisely match. There are two minimums, based on season – for most of the year, the
   minimum is 98.28 (854.55 USGS); starting February 15 they are authorized to lower
   another 6” to 97.78 local (854.05 USGS) through the spring melt. If the “USGS” datum is
   truly NGVD29, then the NAVD88 max is ~855.57 and the min is ~ 854.35 (853.85 late
   winter)

 • Upper Watertown dam: The normal pool target is 820.58 NAVD88, with a min of 820.48
   and a max of 821.28. There is no seasonal drawdown that we are aware of.
Modeling analyses

   Prior to monitoring, we conducted several HEC-RAS based analyses to better characterize
   the system. We have also done some analysis of the monitoring data using the model. We
   expect to use the HEC-RAS model to further evaluate management solutions as the project
   proceeds. The following slides illustrate some of the work to date, including:

    • Lower Watertown dam impacts

    • Model “validation”

    • Unsteady modeling

    • Downstream channel obstructions
Upper Watertown dam impacts - modeled
Rock Riv er - Wisconsin Plan: ngh test f lows 9/18/2019
With a steady flow
Upper Watertown Dam
Rock River 1
Legend
set at 1,500 cfs,
RR bridge
WS 1500cfs @ dam
CTH P
drastically changing WS 1500cfs @ dam ga
Ground
840
the gate operations
at Upper Watertown
Cargill
Hwy 16
Folkman
to be wide open
820
lowers the upstream
pool drastically but
Elevation (ft)
impacts dissipate
above the railroad 800
bridge and are All gates closed
imperceptible above
CTH P. 780
230 240 250 260
Main Channel Distance (mi)
All gates open
Same water surface with
gates all closed, all openUpper Watertown dam impacts - modeled
The steeper
downstream river slope
and separation between
downstream (Upper
Watertown dam) and CTH P bridge
upstream (above CTH P)
hydraulics can be
Higher velocity,
observed in-person at surface ripples
CTH P, the RR bridge,
and near the River St
logger. The velocity in
those locations is much
higher here than
Slack water
upstream of the CTH P upstream of
bridge and throughout CTH P bridge
the Town of Lebanon.Model validation We used available data to evaluate whether the HEC-RAS model is sufficiently accurate to be useful in analyzing management alternatives in the reach of the Rock River. The DNR provided water surface measurements from 2 separate dates in spring 2020. We ran the estimated flows on those days in the model and compared the water surface elevations predicted to those measured. The difference between model and measurements were generally well under 1 foot and weren’t consistently biased.
Model validation (cont.)
 The HEC-RAS seemed to
 represent water surface
 levels well and this
 confirmed its utility as
 an analysis tool.
Model validation (conclusion)
 We also ran the model in unsteady mode with some of the monitoring data. Unsteady flow requires more
 assumptions about dam operations and tributary inflow. We compared observed and modeled river stage at
 Elmwood and Highview in the Town of Lebanon. The model results indicate that the model reasonably
 replicates observed data and will be useful in evaluating management alternatives.

                             Modeled

                                    Measured

                                                                                                      Measured

                                                                                     Modeled

        Timing and magnitude of changes track together close   Further downstream, the timing of modeled peaks and recession
                to Hustisford (the “known” flow data)             is less accurate. Missing more inflow from tributaries here.
Initial concepts for POSSIBLE Remedies 1. Moderation of gate operations upstream. As demonstrated by the dam operation data and monitoring data, the areas along the river controlled by dams maintain a relatively stable (within 1 foot) water surface even during large rainfalls. During these same events, the river in the Town of Lebanon can rise by 5 ft or more and these high water levels persist for many weeks to months and impact residents and adjacent landowners. We understand that Horicon and Sinnissippi are providing some peak flood attenuation, that they have their own management and public safety objectives, and that there is a large upstream watershed (including other storage areas) that flows into these dams. Nevertheless, we would like to discuss any potential ways to moderate the flows entering the river downstream of Hustisford with the cooperation of the operators at these facilities. 2. Channel improvements downstream The downstream area, particularly at bridge crossings, should continue to be monitored / assessed for obvious channel obstructions. Increasing flow capacity through bridges should also be considered as bridges along this stretch need replacement. The Rock River Road bridge is an example that visually seems to constrict the channel and appears to be old.
Initial Evaluation on POSSIBLE actions: Downstream channel
obstruction removal
 There is an island of sediment and logs upstream of CTH P that appears to be blocking flow through the bridge.
 There are also many “high points” seen in the model’s channel profile along the river sections within the Town
 of Lebanon that likely slow flow and raise water levels. We briefly analyzed the potential for improving drainage
 by removing obstructions or otherwise enhancing channel capacity. The purpose of this analysis is not
 necessarily to say these are feasible or permanent solutions – it is to assess if increasing channel capacity by
 some means (dredging, bridge widening, blasting rock ledges, etc.) would have an impact, and how far upstream
 the impact would extend.

  Removing the high point
  upstream of CTH P
  dropped local upstream
  water levels
  considerably (1.75 ft),
  but the impacts tapered
  off upstream
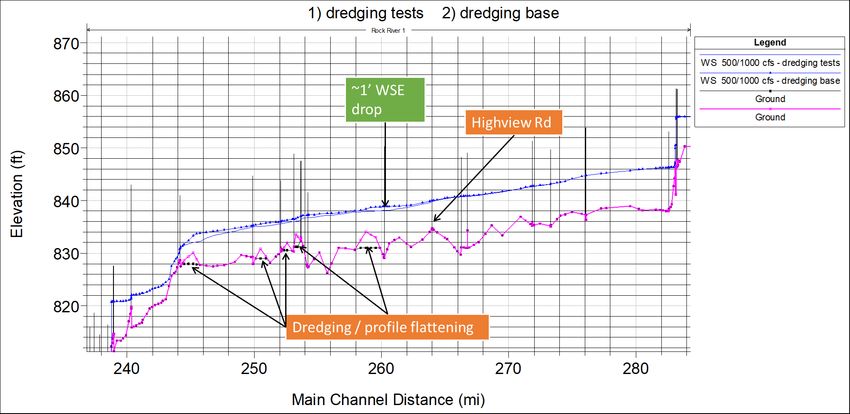
Initial Evaluation on POSSIBLE actions: Channel obstruction
removal (cont.)
 We removed more channel high points upstream, but impacts were still usually local and did not result in a
 substantial cumulative lowering throughout the river section.
 It doesn’t seem that
 identifying a single bridge
 constriction or channel
 obstruction will solve the
 problem, since the channel
 overall will still have a very
 low slope.

 But there may be
 opportunities, like removing
 obstructions near bridges or
 designing any bridge
 replacement projects to have
 more low-flow capacity, that
 could start to provide
 cumulative improvements.
Study and Analysis Conclusions

1. Upstream and local tributary watershed flows are causing the long duration flooding in the
   Town of Lebanon, not downstream management of the Upper Watertown dam.
2. Although a substantial area of local tributary watershed drains directly into the Rock River
   downstream of Hustisford, we believe that runoff from the upper watershed, flowing through
   Horicon Marsh and Lake Sinnissippi, is the primary source of these high, sustained flows. We
   conclude this because our Town of Lebanon gages include flow from tributaries (including the
   Rubicon River) but their patterns during periods with no rainfall are remarkably consistent
   with each other and the upstream-most logger, and when the gates at Sinnissippi close the
   entire system downstream starts to drop.
3. If flows from Horicon and Sinnissippi could be moderated, with a maximum target for these
   long, sustained releases being somewhere in the 500 cfs range, water in the Town of Lebanon
   could likely recede following rain events rather than stay flooded for 2 months following a 2”
   rain as we saw this fall.
Study and Analysis Conclusions

4. A way to moderate these upstream flows could be to operate the upstream storage areas
   (marshes and lakes) differently. One strategy is lowering water levels to provide available
   storage. Another would be to draw down more slowly following runoff events (once there’s
   no immediate flood risk on the lake / marsh). Both have tradeoffs including wildlife
   production, recreational use, upstream flood risk, etc. Slower draw-downs in particular may
   be risky since available storage volume would take longer to recover following storms, which
   might cause problems both locally and downstream if another large storm hits the watershed.
5. Based on initial draft calculations, changing the upstream operation strategies could
   incrementally help the situation by lowering flow rates or shortening the long periods of
   higher flow, but there is not nearly enough available storage volume in Lake Sinnissippi,
   Horicon Marsh, or other surface water bodies in the upper watershed to truly control flows
   and drastically reduce flooding in the Town of Lebanon.
6. Likewise, channel improvements downstream could improve the situation incrementally in
   local areas.
Study and Analysis Conclusions

 7. We think some relief from the flooding problems is possible with these strategies, but the
    dramatic increase in watershed runoff volume that started decades ago and has been
    particularly extreme in the last several years is an enormous challenge. A realistic objective
    would be to reduce – but probably not eliminate – the flood duration problem.
 8. We recommend an action plan that includes both near-term and long-term strategies. These
    action plan items are detailed on the following pages.
Action Plan
1. Establish forum for coordination of dam operations.
We would like to meet with the DNR and dam operators to share study results and to discuss possible
means of moderating the flows entering the river at Hustisford.
We also think that creating an easily-accessed information website providing current water level, flow and
dam operations data would help residents in the Town of Lebanon understand current river conditions.
This might help to alleviate some of the frustrations that arise over persistent high water level conditions
in the Town of Lebanon when it hasn’t rained locally for several weeks. Integrating this resource with
rainfall measurements and creating an easy way to access this information (web site, app) should be
pursued.Action Plan
2. Install additional monitoring stations.
We propose seeking funding for one or more additional permanent monitoring stations. A water level gage
in the Town of Lebanon would inform locals as well as provide upstream operators with a real-time status
of river conditions. This would also provide data for additional model and study of river behavior.
The USGS provided the following estimate for a river gage station:
• Flow and water level - $12k to install, $12k / year O&M
• Water level only - $12k to install, $6k / year O&M
There may be grants available and municipalities interested in contributing to a permanent gage in this
section, especially since it would inform road closures due to high water in the area.
Additionally, it may be helpful to have stage recorders in Horicon Marsh to provide data for studies and to
approximate storage available in the marsh.Action Plan
3. Discussion with municipalities and stakeholders about a comprehensive analysis of
alternatives.
After initial discussions with the DNR and dam operators, we suggest meeting with municipalities and other
stakeholders to further discuss potential management alternatives, as well as seeking funding for a more
comprehensive analysis of these issues. The Corps of Engineers or the Wisconsin DNR – via several
programs – could possibly support this effort. Note that to date, this study has been entirely funded by two
landowners on the Rock River. Additional parties providing constructive solutions and funding will help
make commissioning of additional stream monitoring and alternative analysis possible.You can also read