Modelling and Optimisation of Multi-Stage Flash Distillation and Reverse Osmosis for Desalination of Saline Process Wastewater Sources - MDPI
←
→
Page content transcription
If your browser does not render page correctly, please read the page content below
membranes
Article
Modelling and Optimisation of Multi-Stage Flash
Distillation and Reverse Osmosis for Desalination of
Saline Process Wastewater Sources
Andras Jozsef Toth 1,2
 1   Environmental and Process Engineering Research Group, Department of Chemical and Environmental
     Process Engineering, Budapest University of Technology and Economics, Műegyetem rkp. 3,
     H-1111 Budapest, Hungary; andrasjozseftoth@edu.bme.hu; Tel.: +36-1-463-1490
 2   Institute of Chemistry, University of Miskolc, Egyetemváros C/1 108, H-3515 Miskolc, Hungary

 Received: 9 August 2020; Accepted: 27 September 2020; Published: 28 September 2020

 Abstract: Nowadays, there is increasing interest in advanced simulation methods for desalination.
 The two most common desalination methods are multi-stage flash distillation (MSF) and reverse
 osmosis (RO). Numerous research works have been published on these separations, however their
 simulation appears to be difficult due to their complexity, therefore continuous improvement is
 required. The RO, in particular, is difficult to model, because the liquids to be separated also depend
 specifically on the membrane material. The aim of this study is to model steady-state desalination
 opportunities of saline process wastewater in flowsheet environment. Commercial flowsheet simulator
 programs were investigated: ChemCAD for thermal desalination and WAVE program for membrane
 separation. The calculation of the developed MSF model was verified based on industrial data. It can
 be stated that both simulators are capable of reducing saline content from 4.5 V/V% to 0.05 V/V%.
 The simulation results are in accordance with the expectations: MSF has higher yield, but reverse
 osmosis is simpler process with lower energy demand. The main additional value of the research lies
 in the comparison of desalination modelling in widely commercially available computer programs.
 Furthermore, complex functions are established between the optimized operating parameters of
 multi-stage flash distillation allowing to review trends in flash steps for complete desalination plants.

 Keywords: modelling; multi-stage flash distillation; reverse osmosis; desalination

1. Introduction
      In the year 2016, the total capacity of desalination plants was as much as 88.6 million m3 /day on
a global scale, providing daily supply of fresh water to about 300 million people [1]. For the most
part, desalination processes are based on reverse osmosis (RO), multi-stage flash distillation (MSF),
and multiple effect distillation (MED) [2–4]. Specifically, RO is present in 65% of the technologies
within the total installed capacity worldwide. Thermal desalination operations account for 28% of the
total capacity, 21% of which is MSF process and 7% is MED process [5]. The remaining capacity consists
of nanofiltration, electrodialysis and other operations [5]. The distribution is also shown in Figure 1.

Membranes 2020, 10, 265; doi:10.3390/membranes10100265                    www.mdpi.com/journal/membranes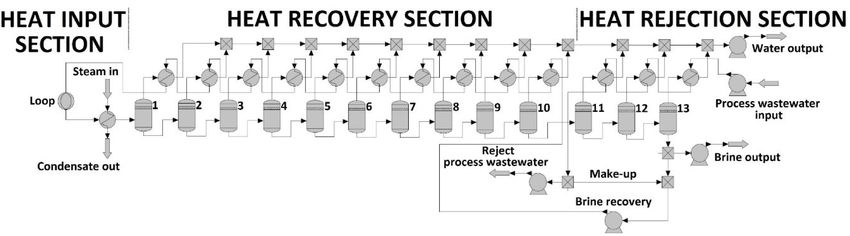
Membranes 2020, 10, 265                                                                                        2 of 18

                                   Figure 1. Distribution of desalination technologies.

      Although MED is thermodynamically more efficient than MSF, it is a less common method.
MED units typically have a capacity of 600 to 91,000 m3 /day, but involve high investment costs and
energy consumption. The energy requirements of the MED process are 2–3 times higher than the
energy needs of the RO process. One of the largest MED plants is Al Jubail in Saudi Arabia, with a
total capacity of 800,000 m3 /day (27 units with a capacity of 30,000 m3 /day per unit) [5].
      The typical energy requirements, investment costs, and cost of drinking water produced in relation
to the 3 main desalination technologies described above are shown in Table 1 [6,7]. The energy demand
of saline water RO (SWRO) is about 3–4 times less than that of MSF and 2–3 times less than that of
MED, since models based on evaporation require not only electricity but also thermal energy, while RO
uses only electrical energy to operate [8,9].

                               Table 1. Main features of desalination technologies [6].

                   Thermal Energy         Electrical Energy    Total Energy     Investment Cost    Total Water
      Process
                     [kWh/m3 ]               [kWh/m3 ]          [kWh/m3 ]         [USD/m3 /d]     Cost [USD/m3 ]
       MSF                7.5–12                2.5–4             10–16            1200–2500         0.8–1.5
       MED                  4–7                 1.5–2             5.5–9             900–2500         0.7–1.2
       RO                    –                   3–4               3–4             900–2500          0.5–1.2

      The historical turning point in the history of desalination was the appearance of multi-stage flash
desalination (MSF), in Kuwait, dating back to 1957 [10]. The MSF system comprises three major parts:
Heat Input Section, intermediate Heat Recovery Stages, and Heat Rejection Stage(s) where waste heat
is discharged into the environment [11]. Figure 2 shows the flowsheet of the MSF method.

                          Figure 2. Schematic flowsheet of multi-stage flash distillation [11].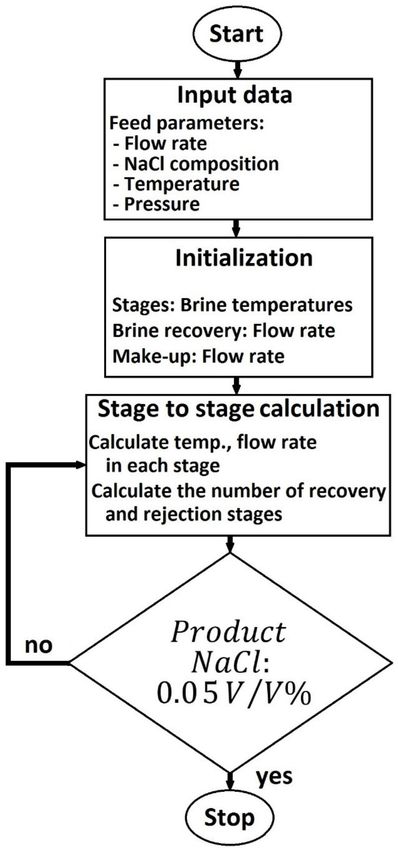
Membranes 2020, 10, 265                                                                               3 of 18

     Saline water blended with recycled brine, preheated within the middle stages, is brought to
working temperature (usually between 90–110 ◦ C) with steam, in the Heat Input Section. At this
point, it is transferred to the first stage, which is kept at a lower pressure than the heated saline water
equilibrium pressure. Consequently, the saline water becomes partially vaporized. Steam generation
removes energy from the mass of saline water, therefore cooling it to a certain extent. Furthermore,
steam extraction results in higher salinity and higher boiling point in the case of the remaining saline
water. The steam is transmitted to demisters, where transported droplets are eliminated, then it flows
into a heat exchanger at the top of the stage. Consequently, the heat of the steam is passed over to the
incoming saline water, whereby the steam cools down and condenses. By this process, the heat can be
recovered with high efficiency.
     Following condensation, water vapour is accumulated in the form of product water. The remaining
saline water from the first stage is passed on to the subsequent step. In the second stage, there should be
a lower pressure compared to that of the first stage, in order to facilitate further steam generation, as it
compensates for lower temperature and higher salinity. The process is carried on, up to the last stage.
The remaining saline solution is eventually cooled in the Heat Rejection Stage, thereby allowing it to
be drained into the ocean. The incoming saline water is utilized for cooling in this final stage [11–14].
     Although MSF is viewed as an advanced technology, further progress and improvements are
underway. The long tubular distiller, which is equipped with an axially positioned saline flow system,
may enhance unit capacity, reduce pressure drop, and increase overall performance, in contrast with
the latest cross-flow solutions [15].
     It has been stated by Rosso [16] that the performance of the plant is affected by the temperature
of the heating steam and the temperature of the saline water, which can be described by the plant
performance ratio (PR) or gained output ratio (GOR) as it can be seen in Equation (1) [17]. For MSF
plants, a typical PR value is about 8 [18]:

                                             Distillate product [kg/h]
                                      PR =                             [−]                               (1)
                                             Consumed steam [kg/h]

     The production capacity of some currently operating RO water desalination plants and the price
of produced drinking water are summarized in Table 2 [19]:

                    Table 2. Productivity and unit water cost of some large SWRO plants [19].

                   SWRO Plant              Productivity [m3 /day]       Unit Water Cost [USD/m3 ]
                Ashkelon (Israel)                  320,000                          0.52
               Palmachim (Israel)                   83,000                          0.78
                Perth (Australia)                  144,000                          0.75
              Carlsbad (California)                189,000                          0.76
                Skikda (Algeria)                   100,000                          0.73
               Hamma (Algeria)                     200,000                          0.82
                 Hadera (Israel)                   348,000                          0.63

    The opposite process, RO is one of the most important membrane technology operations.
The membrane ideal for RO should correspond to the following requirements:

•    relatively low cost,
•    long-lasting and reliable structure,
•    resistance to creep deformation,
•    chemical and thermal stability in saline water,
•    resistance to all kinds of fouling (inorganic, organic, colloidal and microbiological),
•    resistance to oxidizing agents, especially chlorine,
•    resistance to high temperature,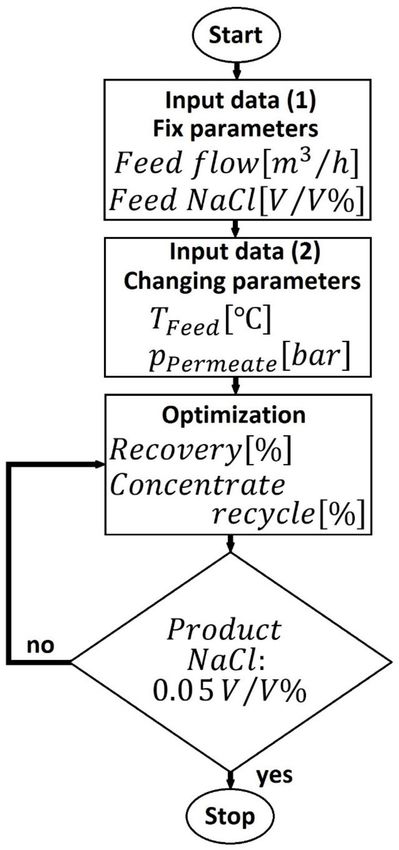
Membranes 2020, 10, 265                                                                            4 of 18

•    high permeability to water,
•    high salt rejection [10].

     The original RO membranes were made from cellular acetate material. Since then, RO plants
apply a variety of blends or derivatives of polyamides and cellular acetate. Plate, tubular, spiral-wound
and hollow fiber membranes are the most popular RO modules [10,20]. Figure 3 shows the general
structure of an RO plant.

                          Figure 3. Schematic flowsheet of reverse osmosis plant [10].

     The mentioned desalination processes, MSF and RO, were mathematically modelled and their
transport phenomenon was described by several authors [9,21–23]. Ettouney and El-Dessouky [22]
developed a computer package for the design and simulation of thermal desalination processes,
MSF and evaporation. gPROMS software is used for effective design of the RO based desalination
process, considering a wide range of salinity and seawater temperature, by Sassi and Mujtaba [24].
Skiborowski et al. [25] used also mixed-integer non-linear programming (MINLP) problem to rigorously
optimize MED and RO. Lv et al. [26] investigated MSF with numerical simulation, CFD method and
the flash chamber for multi-stage flash seawater desalination was optimized. Filippini et al. [27]
introduced a mathematical model of hybrid RO and MED process. Detailed mathematical model of
MSF was described by Rosso [16], Rao [28] and Helal et al. [29].
     There were several attempts to run desalination processes in commercial software programs.
SEEPUP package with FORTRAN addition was investigated for calculation of MSF by Husain et al. [30].
Aspen PLUS software was already used to simulate MED [31] and MSF [10] as well. Altaee [32] applied
a computational model for estimating RO system design and performance: commercial software ROSA
(Reverse Osmosis System Analysis) was investigated [32].
     Not all simulator programs have built MSF calculation into their toolbars, which is also true
for one of the most common chemical process simulators: ChemCAD does not have comprehensive
desalination reference for complete plants. RO modelling is a membrane-specific process that requires
complex computation, using calculations which are always valid for a given type of membrane.
     The aim of this research is to investigate the desalination of saline process wastewater with MSF
in ChemCAD professional flowsheet simulator, and compare the results with those of RO separation
in WAVE design software from DuPont Company. Yields, operational properties, energetic factors,
and complex functions between operating parameters were the basis for examination and comparison,
which is considered as novelty in the case of mentioned computer programs.

2. Materials and Methods
     The target of this work is to evaluate desalination methods of saline process wastewater
(PWW). The initial concentration of the sample is motivated by an industrial separation problem:
process wastewater from fine chemical industry with 4.5 V/V% or 45,000 ppm NaCl content.
The desalination requirement is 0.05 V/V% or 500 ppm in both cases. 1000 kg/ feed stream
was investigated.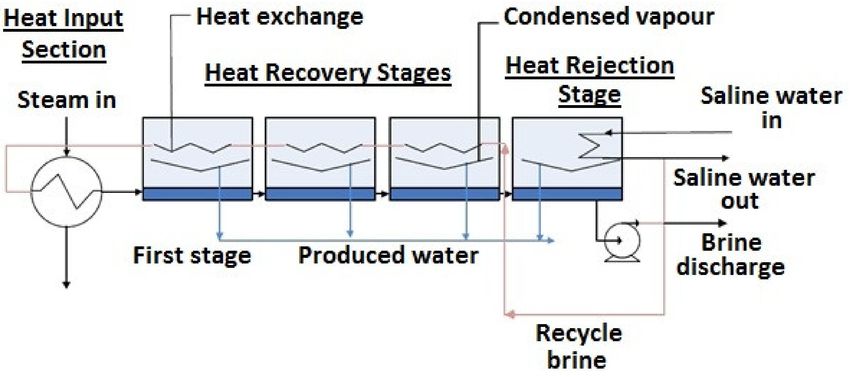
Membranes 2020, 10, 265                                                                             5 of 18

     For the evaluation of desalination processes, Yield [33] and Brine reduction are defined with the
following equations:                                h      i
                                            Product m3 /h
                                    Yield =                  ·100 [%]                               (2)
                                             Feed [m3 /h]
                                                                       !
                                                   ProductNaCl [V/V%]
                            Brine reduction = 1 −                        [−]                        (3)
                                                    FeedNaCl [V/V%]
     If the product emission limit was met, during the optimization of the process, the subsequent goal
was to maximize yield and minimize energy.

2.1. Multi-Stage Flash Distillation
      The MSF method is similar to multicomponent distillation, but there is no exchange of material
between the counter-current flows. Actually, the MSF method is a flash evaporation method in vacuum,
where the vacuum changes from one stage to the next and the evaporation temperature decreases from
the first to the last stage [10]. MSF can be considered a non-linear recycling process with a closed-loop
information flow in the simulator environment. ChemCAD is an advanced commercial software that
allows the user to build and run steady-state and dynamic simulation models of chemical processes.
MSF was rigorously steady-state modelled in flowsheet environment and optimized with dynamic
programming optimization method [34–36] in ChemCAD 7.1.5 program environment.
      The development of the MSF model in simulator environment involves the following steps:

(1)   Defining the flowsheet configuration by specifying:

      (a)     Unit operations and
      (b)     Process streams flowing between unit operations.
(2)   Specifying chemical compositions to be separated.
(3)   Choosing the thermodynamic model to represent the physical properties of the components and
      mixture in the method.
(4)   Specifying flow rates and thermodynamic conditions of the feed streams: i.e., pressure,
      temperature and phase conditions.
(5)   Optimizing operating conditions of unit operations in order to reduce NaCl content under
      500 ppm of outlet water.

     The thermodynamic model applied for the saline water is based on the NRTL equation but takes
into account interactions of the electrolytic type effects. Thermodynamic calculations in the gas phase
were carried out applying the Soave-Redlich-Kwong (SRK) equation [31]. The developed MSF model
was verified with industrial reference before calculation. The operating parameters of AZ-ZOUR South
MSF desalination plant from the work of Al-Shayji [10] were examined.
     Figure 4 shows the structure of ChemCAD flowsheet of the MSF plant. As it is seen, the method
can be divided into three part. The Heat Input (or Briner Heater) Section consists of a heat exchanger
and loop modules. The Loop module regulated the order of feed flows [37]: at first steam was flown
and then PWW was pumped into the MSF plant. This part consists of two input streams and two
output streams. The first input flow is the ‘Brine recovery’ stream, which is used to heat to the required
temperature. The second output flow is the steam with the conditions of 101.5 ◦ C and 1.09 bar.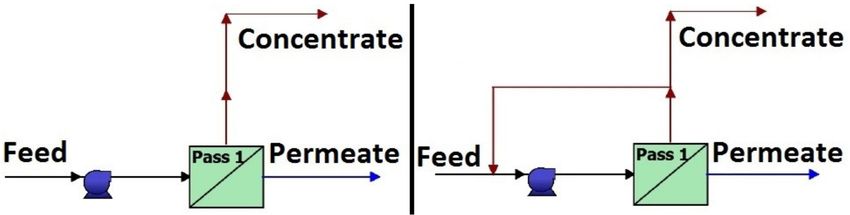
Membranes 2020, 10, 265                                                                                                6 of 18

                          Figure 4. Flowsheet of multi-stage flash distillation method in ChemCAD simulator program.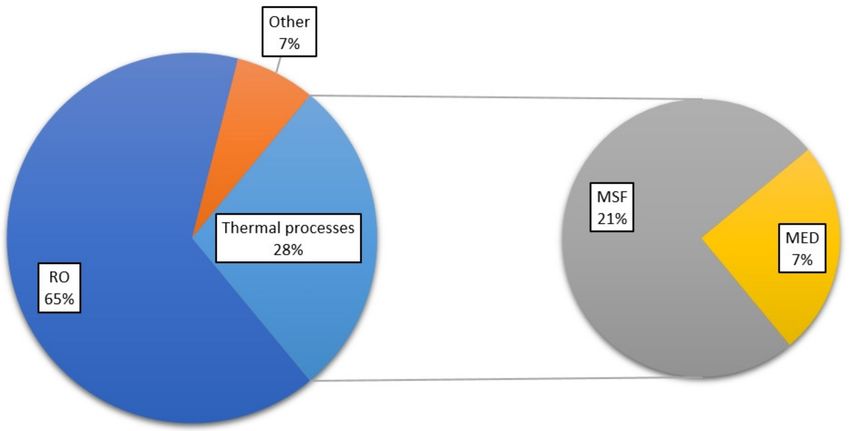
Membranes 2020, 10, 265                                                                             7 of 18

     The Heat Recovery Section consists of interconnected liquid-liquid-vapour flash units (LLVFs),
heat exchangers and mixer modules. The vapour inlet of LLVFs was condensed by heat exchanger
modules. After the tenth recovery step, the plant follows with the heat rejection section, which consist
of three stages. There are two addition flows: Make-up stream input and brine recovery output in
the last LLVF stage. It must be mentioned, PWW is the cooling water in the case of the heat rejection
section. The brine mass after the 13rd stage and the make-up stream were mixed together to give Brine
recovery stream. It was recycled through the tubes of the heat recovery section. As a results of this
procedure, desalted water can become available, which stream is called ‘water output’ in the flowsheet
(see Figure 4). Figure 5 shows the optimization process of MSF simulation. At first, the initial data
must be determined. This is followed by an extremely important part. Make-up and brine recovery
flow rates and brine temperatures of stages have to be initialized. After that, the limit value can be
reached using the method of ‘stage to stage calculation’. Flow rate and temperature are calculated
in each stage and a sufficient number of recovery and rejection stages is determined to achieve an
appropriate desalination effect.

                   Figure 5. Flowchart of optimization process of multi-stage flash distillation.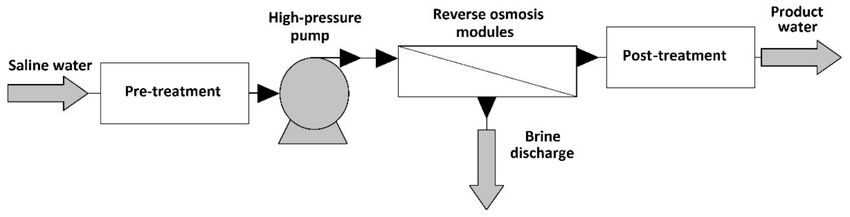
Membranes 2020, 10, 265                                                                                   8 of 18

2.2. Reverse Osmosis
      Water Application Value Engine (WAVE 1.77a software was used for the calculation of RO.
WAVE is a modelling software program that integrates three of the leading technologies (ultrafiltration,
reverse osmosis and ion exchange resin) into one comprehensive platform [38]. The calculation method
of WAVE is not public. However, Altaee [32] presented in detail the calculation of its Reverse Osmosis
(RO) System Analysis module with 95% accuracy, which is based on experimental and practical
contexts. The equations are discussed in detail in the paper of Altaee [32]. Thus, program calculations
can be considered verified. With the method, salt retention, yield, permeate concentration, and flow
rate can be estimated per membrane module. The calculation is based on Van’t Hoff equation,
average concentration factor, and it also takes into account the pressure drop of the concentrate side,
salt diffusion coefficient and concentration polarization [32].
      The main steps of the calculation method are the following:
(1)   Estimation of feed pressure based on the feed osmotic pressure of the initial solution and the
      desired recovery rate of the system.
(2)   From the estimated feed pressure, estimation of the initial flow rate.
(3)   Calculation of initial recovery rate, permeate concentration and rejection rate for the module.
(4)   Next, estimation of the average salt concentration and water permeability to calculate an
      approximate flow rate for the membrane module.
(5)   The feeding of the concentrate from the first module to the second module.
(6)   In accordance with the previous steps, calculation of the flow rate and recovery for the second
      module, and then proceeding from module to module.
     Figure 6 shows the flowsheets of RO modules in WAVE simulator. As it can be seen, the recycling
of the concentrate stream was also investigated.

       Figure 6. Flowsheets of reverse osmosis methods in WAVE program (right side: recycling version).

      The main properties of applied RO membranes can be found in Table 3.

                      Table 3. Properties of examined reverse osmosis membrane modules.

          Membrane Module                SW30XHR-440i         SW30HRLE-440i            SW30XLE-440i
                                       Polyamide Thin-Film   Polyamide Thin-Film    Polyamide Thin-Film
             Membrane type
                                            Composite             Composite              Composite
             Active area [m2 ]                 41                    41                     41
      Max. operating pressure [bar]            83                    83                     83
       Permeate flow rate [m3 /d]              25                    31                    37.5
         Min. salt rejection [%]              99.70                 99.65                  99.60
       Stabilized salt rejection [%]          99.82                 99.80                  99.70
       Max. operating temp. [◦ C]              45                    45                     45

     Figure 7 summarizes the calculation process of RO. The feed temperature was changed between
10 and 25 ◦ C. The permeate pressure was taken to 10, 20 and 30 bars. The recovery represents the
amount of permeate in the program.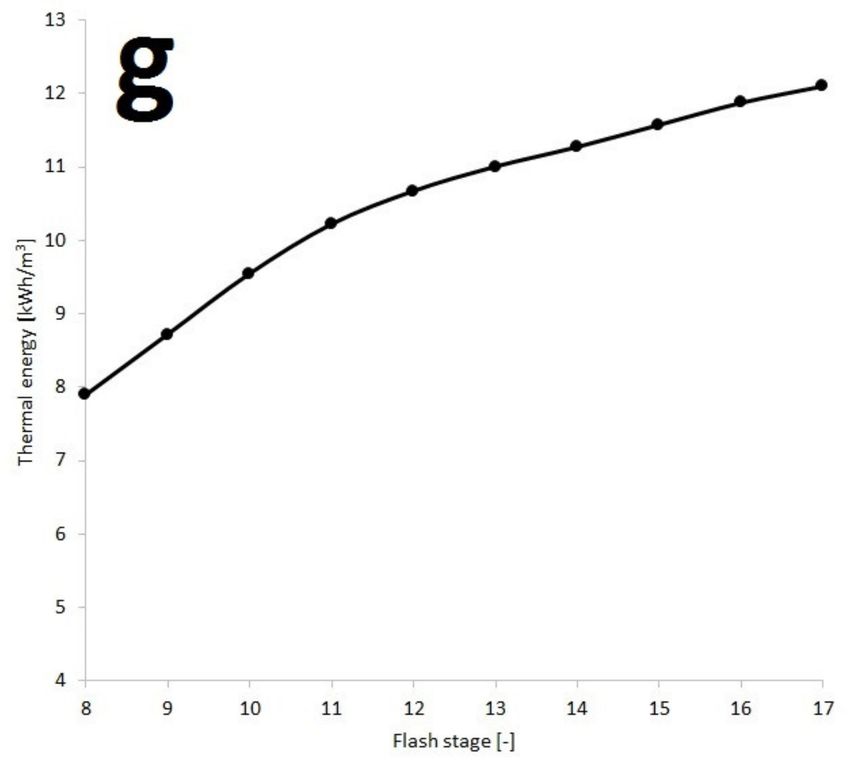
Membranes 2020, 10, 265                                                                            9 of 18

                          Figure 7. Flowchart of optimization process of reverse osmosis.

3. Results and Discussion

3.1. Multi-Stage Flash Distillation
     Table 4 shows the reference calculations of ChemCAD simulator. It can be seen that there is proper
match between the results of industrial plant and ChemCAD simulations. Further parameters were
also compared, which can be found in the Supplementary Part. Table S1 shows the temperature of
recirculating brine entering each LLVF stage. Distillate produced from each stage in Ton/min can be
found in Table S2. Finally, Table S3 shows the outlet pressure from each stage. There is minor difference
between industrial and simulated data, in all cases. Thus, it can be established that the developed
model is verified and capable of the calculation of MSF.
Membranes 2020, 10, 265 10 of 18
Table 4. Comparison of AZ-ZOUR South MSF desalination plant results and ChemCAD calculations.
Parameters Industrial Data [10] Simulated Data Error [%]
Top brine temperature [◦ C] 90.6 89.9 −0.7
Recycled brine flow rate [Ton/min] 238.10 238.12 0.01
Distillate produced [Ton/min] 18.80 18.82 0.09
Following the procedure of Figure 6, optimization of the MSF method was achieved. Seven different
parameters were investigated in the function of flash stages:
(1) Water output NaCl [V/V%]
(2) Water output temperature [◦ C]
(3) Water output pressure [bar]
(4) Water output flow rate [m3 /h]
(5) Consumed steam [m3 /h]
(6) Performance ratio: PR [–]
(7) Thermal energy [kWh/m3 ]
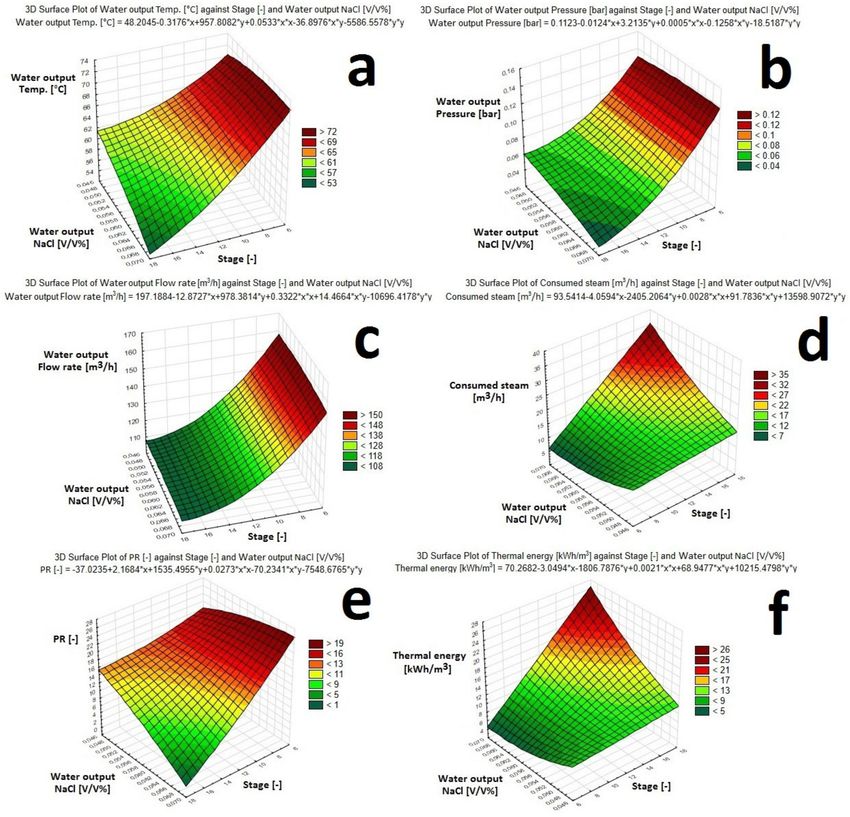
Figure 8 shows a two dimensional representation of tendencies. Figure 9 depicts complex functions
between the mentioned parameters in three dimensional visualization, supplemented by the equation
describing the plane.
It can be observed that the limit can be reached at the 13rd flash stage, therefore the optimum point
can be found here. The 11 kWh/m3 value in the case of the 13-step-plant fits into the literature tendency,
as it can be seen in Table 1. NaCl composition, temperature, pressure, flow rate and PR of Water
output are almost on the same declining trend. The performance ratio was above 8 at the optimum
location. In contrast, consumed steam and required Thermal energy are following the opposite trend,
which represent the cumulative heat effect of the system. These tendencies are in line with experience
in the literature [18,30]. The course of temperature and pressure are interrelated. In a binary system,
one can be counted from the other. Furthermore, the values on the diagrams in Figure 8 can be traced
back to the NaCl-water phase diagram.
Table 5 introduces the optimized results of the MSF method. The steam flow was 15 m3 /h.
The brine reduction was 0.99 and 11.7% can be reached in yield value. Figure 10 shows the pressure
and temperature values of flash inputs and distillate products of the stages between the 1st and the
13rd. It can be seen that the curves are flattening close to the optimum region.
Table 5. Optimized results of multi-stage flash distillation method.
Flow Rate
Flow Rate Temp. [◦ C] Pressure [bar] Water [V/V%] NaCl [V/V%]
[m3 /h]
PWW input 20.0 3.00 1000 95.50 4.50
Flash 1 input 89.9 0.70 1484 93.25 6.75
Flash 10 input 45.7 0.10 1378 92.67 7.26
Flash 13 output 40.0 0.07 1366 92.67 7.33
Make-up 36.5 2.50 304 95.49 4.51
Brine recovery 40.5 4.60 1484 93.26 6.75
Brine output 40.0 0.07 186 92.70 7.35
Reject PWW 36.5 0.07 696 95.51 4.51
Water output 63.0 0.07 117 99.95 0.05Membranes 2020, 10, 265 11 of 18
Figure 8. Cont.Membranes 2020, 10, 265 12 of 18
Figure 8. Influence of the number of stages on the water output NaCl (a), water output temperature
(b), water output pressure (c), water output flow rate (d), consumed steam (e), performance ratio (f)
and thermal energy (g).
Figure 9. Influence of the number of Stages and Water output NaCl [V/V%] on the Water output
Temperature (a), Water output Pressure (b), Water output Flow rate (c), Consumed steam (d),
Performance ratio (e), and Thermal energy (f).Membranes 2020, 10, 265 13 of 18
Figure 10. Flash input and distillation product parameters in the function of flash stage. (a): pressure,
(b): temperature.
3.2. Reverse Osmosis
Tables 6–8 show the optimized results of SW30XHR-440i membrane. Tables 9–11 introduce the
simulated data of SW30HRLE-440i membrane, and the results of SW30XLE-440i type RO membrane
can be seen in Tables 12–14.
Table 6. Optimized results of SW30XHR-440i membrane at 10 ◦ C.
Feed Temp. Concentrate Permeate Total Energy Brine-Reduction
Yield [%]
[◦ C] Recycled [%] Pressure [bar] [kWh/m3 ] [–]
10 0 10 0.7 4.3 0.99
10 0 20 0.8 4.4 0.99
10 0 30 1.0 4.5 0.99
10 30 10 4.4 3.0 0.99
10 30 20 5.2 3.2 0.99
10 30 30 5.9 3.3 0.99
Table 7. Optimized results of SW30XHR-440i membrane at 20 ◦ C.
Feed Concentrate Total
Permeate Brine-Reduction
Temp. Recycled Energy Yield [%]
Pressure [bar] [–]
[◦ C] [%] [kWh/m3 ]
20 0 10 0.9 6.4 0.99
20 0 20 1.0 6.5 0.99
20 0 30 1.2 6.6 0.99
20 60 10 4.5 5.2 0.99
20 60 20 5.0 5.3 0.99
20 60 30 5.6 5.4 0.99
Table 8. Optimized results of SW30XHR-440i membrane at 25 ◦ C.
Feed Concentrate Permeate Total Brine-
Yield
temp. recycled pressure Energy Reduction
[%]
[◦ C] [%] [bar] [kWh/m3 ] [–]
25 0 10 1.4 8.4 0.99
25 0 20 1.6 8.5 0.99
25 0 30 1.9 8.6 0.99
25 70 10 5.1 6.7 0.99
25 70 20 5.9 6.8 0.99
25 70 30 6.7 6.9 0.99Membranes 2020, 10, 265 14 of 18
Table 9. Optimized results of SW30HRLE-440i membrane at 10◦ C.
Feed Concentrate Permeate Total Brine-
Yield
Temp. Recycled Pressure Energy Reduction
[%]
[◦ C] [%] [bar] [kWh/m3 ] [–]
10 0 10 0.9 5.3 0.99
10 0 20 1.0 5.4 0.99
10 0 30 1.2 5.5 0.99
10 45 10 4.3 3.8 0.99
10 45 20 5.0 3.9 0.99
10 45 30 5.8 4.0 0.99
Table 10. Optimized results of SW30HRLE-440i membrane at 20 ◦ C.
Feed Concentrate Permeate Total Brine-
Yield
Temp. Recycled Pressure Energy Reduction
[%]
[◦ C] [%] [bar] [kWh/m3 ] [–]
20 0 10 1.1 8.3 0.99
20 0 20 1.3 8.4 0.99
20 0 30 1.4 8.6 0.99
20 70 10 5.0 6.7 0.99
20 70 20 5.7 6.8 0.99
20 70 30 6.5 6.9 0.99
Table 11. Optimized results of SW30HRLE-440i membrane at 25 ◦ C.
Feed Concentrate Permeate Total Brine-
Yield
temp. Recycled Pressure Energy Reduction
[%]
[◦ C] [%] [bar] [kWh/m3 ] [–]
25 0 10 2.0 10.4 0.99
25 0 20 2.4 10.5 0.99
25 0 30 2.8 10.6 0.99
25 75 10 5.2 7.9 0.99
25 75 20 6.0 8.0 0.99
25 75 30 6.7 8.1 0.99
Table 12. Optimized results of SW30XLE-440i membrane at 10 ◦ C.
Feed Concentrate Permeate Total Brine-
Yield
Temp. Recycled Pressure Energy Reduction
[%]
[◦ C] [%] [bar] [kWh/m3 ] [–]
10 0 10 1.1 6.2 0.99
10 0 20 1.3 6.4 0.99
10 0 30 1.5 6.5 0.99
10 55 10 4.1 4.6 0.99
10 55 20 4.9 4.7 0.99
10 55 30 5.7 4.8 0.99Membranes 2020, 10, 265 15 of 18
Table 13. Optimized results of SW30XLE-440i membrane at 20 ◦ C.
Feed Concentrate Permeate Total Brine-
Yield
Temp. Recycled Pressure Energy Reduction
[%]
[◦ C] [%] [bar] [kWh/m3 ] [–]
20 0 10 1.4 10.4 0.99
20 0 20 1.6 10.5 0.99
20 0 30 1.9 10.5 0.99
20 75 10 4.6 7.9 0.99
20 75 20 5.4 8.0 0.99
20 75 30 6.2 8.1 0.99
Table 14. Optimized results of SW30XLE-440i membrane at 25 ◦ C.
Feed Concentrate Permeate Total Brine-
Yield
Temp. Recycled Pressure Energy Reduction
[%]
[◦ C] [%] [bar] [kWh/m3 ] [–]
25 0 10 2.0 12.4 0.99
25 0 20 2.4 12.5 0.99
25 0 30 2.8 12.6 0.99
25 80 10 5.0 11.4 0.99
25 80 20 5.8 11.6 0.99
25 80 30 6.6 11.8 0.99
It can be affirmed that all three membranes met the limit value. As high as 0.99 brine reduction
value can be reached in every case, which corresponds to 0.05 V/V% NaCl in permeate product.
Studying the tables, low yield values are conspicuous. It means a characteristic result, which is the
main disadvantage of RO compared to MSF. There is accordance between literature and simulated
permeate flow rates or yields. SW30XHR-440i membrane has the lowest literature permeate flow rates
and lowest simulated yields too. This is also the case for several other membranes, as it can be seen in
Table 3.
The highest yield was obtained at the highest permeate pressure (30 bar) and 25 ◦ C. In the case
of SW30XHR-440i membrane yield of 8.6% can be achieved. 10.6% was the maximum yield with
SW30HRLE-440i membrane and 12.6% was in the case of SW30XLE-440i. In two cases, 6.7 kWh/m3 was
achieved, as the highest total energy value (see Tables 8 and 11) and the lowest values was 0.7 kWh/m3 .
It can also be observed that the yield increases with increasing feed temperature and permeate
pressure. Although, the increase of feed temperature also poses extra energy demand. Increasing flow
rate of recycled concentrate decreases yield for one module case. SW30XLE-440i has the highest yield,
but it has the highest energy demand too, because the most materials are moved by this membrane.
It can be concluded that selecting the right membrane for appropriate desalination work is
a difficult and complex task. Based on the present study, if the goal is to maximize the yield,
SW30XLE-440i is recommended, while if the aim is to minimize the energy demand, the application of
SW30XHR-440i membrane type is offered.
4. Conclusions
The software programs applied in the present study have not yet been compared in terms
of desalination. The main advantages of these programs are the user-friendly panel manageability,
furthermore that commercially available membranes can be modelled in the WAVE program, which sets
it apart from other programs. To sum up, it can be deduced that the developed ChemCAD model and
WAVE simulator are both suitable for desalination of 1000 m3 /h initial process wastewater. The emission
limit value, which is 0.05 V/V% NaCl, can be reached with optimized methods. The yield of MSF was
11.7% and in the case of RO it was between 3.0% and 12.6%.Membranes 2020, 10, 265 16 of 18
The optimized multi-stage flash plant consists of three parts. 15 m3 /h steam flow rate is required
for optimal operation of the heat input section. The heat recovery section contains 10 flash stages
and the heat rejection section includes three stages. It can be stated that the results connected to MSF
can be generalized and can serve as a basis for later design of more complex and larger desalination
plants. Three different reverse osmosis membrane modules were investigated: SW30XHR-440i,
SW30HRLE-440i and SW30XLE-440i types. The choice between these membranes requires further
consideration, since the membrane with the best yield also presented the highest energy demand.
In this case, greater role is gaining ground in cost factors.
Supplementary Materials: The following are available online at http://www.mdpi.com/2077-0375/10/10/265/s1,
Table S1: Comparison of industrial and simulated data: Temperature of recirculating brine entering each flash
stage, Table S2: Comparison of industrial and simulated data: Distillate produced from each stage, Table S3:
Comparison of industrial and simulated data: Outlet pressure from each stage.
Author Contributions: Conceptualization, A.J.T.; methodology, A.J.T.; writing—review and editing A.J.T.
All authors have read and agreed to the published version of the manuscript.
Funding: This publication was supported by the János Bolyai Research Scholarship of the Hungarian Academy of
Sciences, ÚNKP-19-4-BME-416 New National Excellence Program of the Ministry for Innovation and Technology,
NTP-NFTÖ-20-B-0095 National Talent Program of the Ministry of Human Capacities, OTKA 128543 and 131586.
This research was supported by the European Union and the Hungarian State, co-financed by the European
Regional Development Fund in the framework of the GINOP-2.3.4-15-2016-00004 project, aimed to promote the
cooperation between the higher education and the industry. The research reported in this paper and carried out at
the Budapest University of Technology and Economics was supported by the “TKP2020, National Challenges
Program” of the National Research Development and Innovation Office (BME NC TKP2020).
Conflicts of Interest: The author declares no conflict of interest.
Nomenclature
CFD Computational Fluid Dynamics
GOR Gained Output Ratio
LLVF Liquid-Liquid-Vapour Flash
MED Multiple Effect Distillation
MSF Multi-Stage Flash Distillation
NaCl Sodium chloride
PR Performance Ratio
PWW Process Wastewater
RO Reverse Osmosis
ROSA Reverse Osmosis System Analysis
SRK Soave-Redlich-Kwong
SWRO Saline Water Reverse Osmosis
WAVE Water Application Value Engine
References
1. Gude, G. Emerging Technologies for Sustainable Desalination Handbook, 1st ed.; Elsevier Science:
Starkwell, MS, USA, 2018; pp. 1–110.
2. Camacho, L.M.; Dumée, L.; Zhang, J.; Li, J.-D.; Duke, M.; Gomez, J.; Gray, S. Advances in Membrane
Distillation for Water Desalination and Purification Applications. Water 2013, 5, 94–196. [CrossRef]
3. Piacentino, A. Application of advanced thermodynamics, thermoeconomics and exergy costing to a Multiple
Effect Distillation plant: In-depth analysis of cost formation process. Desalination 2015, 371, 88–103. [CrossRef]
4. Kouhikamali, R. Thermodynamic analysis of feed water pre-heaters in multiple effect distillation systems.
Appl. Therm. Eng. 2013, 50, 1157–1163. [CrossRef]
5. Catrini, P.; Cipollina, A.; Giacalone, F.; Micale, G.; Piacentino, A.; Tamburini, A. Chapter 12—Thermodynamic,
Exergy, and Thermoeconomic analysis of Multiple Effect Distillation Processes. In Renewable Energy Powered
Desalination Handbook, 1st ed.; Gude, V.G., Ed.; Butterworth-Heinemann: Starkwell, MS, USA, 2018;
pp. 445–489. [CrossRef]Membranes 2020, 10, 265 17 of 18
6. Ghaffour, N.; Missimer, T.M.; Amy, G.L. Technical review and evaluation of the economics of water
desalination: Current and future challenges for better water supply sustainability. Desalination 2013, 309,
197–207. [CrossRef]
7. Al-Obaidi, M.A.; Filippini, G.; Manenti, F.; Mujtaba, I.M. Cost evaluation and optimisation of hybrid
multi effect distillation and reverse osmosis system for seawater desalination. Desalination 2019, 456,
136–149. [CrossRef]
8. Ismail, A.F.; Khulbe, K.C.; Matsuura, T. Chapter 7—RO Economics. In Reverse Osmosis, 1st ed.; Ismail, A.F.,
Khulbe, K.C., Matsuura, T., Eds.; Elsevier: Ottawa, ON, Canada, 2019; pp. 163–187. [CrossRef]
9. Al-Sahali, M.; Ettouney, H. Developments in thermal desalination processes: Design, energy, and costing
aspects. Desalination 2007, 214, 227–240. [CrossRef]
10. Al-Shayji, K.A. Modeling, Simulation, and Optimization of Large-Scale Commercial Desalination Plants.
Ph.D. Thesis, Faculty of the Virginia Polytechnic Institute and State University, Blacksburg, VA, USA, 1998.
11. Namboodiri, V.; Rajagopalan, N. 2.6-Desalination. In Comprehensive Water Quality and Purification, 1st ed.;
Ahuja, S., Ed.; Elsevier: Waltham, MA, USA, 2014; Volume 2, pp. 98–119. [CrossRef]
12. Morris, R.M. The development of the multi-stage flash distillation process: A designer’s viewpoint.
Desalination 1993, 93, 57–68. [CrossRef]
13. Tokui, Y.; Moriguchi, H.; Nishi, Y. Comprehensive environmental assessment of seawater desalination plants:
Multistage flash distillation and reverse osmosis membrane types in Saudi Arabia. Desalination 2014, 351,
145–150. [CrossRef]
14. Hanshik, C.; Jeong, H.; Jeong, K.-W.; Choi, S.-H. Improved productivity of the MSF (multi-stage flashing)
desalination plant by increasing the TBT (top brine temperature). Energy 2016, 107, 683–692. [CrossRef]
15. Kotb, O.A. Optimum numerical approach of a MSF desalination plant to be supplied by a new specific
650MW power plant located on the Red Sea in Egypt. Ain Shams Eng. J. 2015, 6, 257–265. [CrossRef]
16. Rosso, M.; Beltramini, A.; Mazzotti, M.; Morbidelli, M. Modeling multistage flash desalination plants.
Desalination 1997, 108, 365–374. [CrossRef]
17. Al-Hengari, S.; El-Bousiffi, M.; El-Mudir, W. Performance analysis of a MSF desalination unit. Desalination 2005,
182, 73–85. [CrossRef]
18. El-Ghonemy, A.M.K. Performance test of a sea water multi-stage flash distillation plant: Case study.
Alex. Eng. J. 2018, 57, 2401–2413. [CrossRef]
19. Curcio, E.; Profio, G.D.; Fontananova, E.; Drioli, E. 13-Membrane technologies for seawater desalination
and brackish water treatment. In Advances in Membrane Technologies for Water Treatment, 1st ed.; Basile, A.,
Cassano, A., Rastogi, N.K., Eds.; Woodhead Publishing: Oxford, UK, 2015; pp. 411–441. [CrossRef]
20. Thabit, M.S.; Hawari, A.H.; Ammar, M.H.; Zaidi, S.; Zaragoza, G.; Altaee, A. Evaluation of forward osmosis
as a pretreatment process for multi stage flash seawater desalination. Desalination 2019, 461, 22–29. [CrossRef]
21. Ahmed, F.E.; Hashaikeh, R.; Diabat, A.; Hilal, N. Mathematical and optimization modelling in desalination:
State-of-the-art and future direction. Desalination 2019, 469, 114092. [CrossRef]
22. Ettouney, H.M.; El-Dessouky, H. A simulator for thermal desalination processes. Desalination 1999, 125,
277–291. [CrossRef]
23. Ang, W.L.; Mohammad, A.W. 12-Mathematical modeling of membrane operations for water treatment.
In Advances in Membrane Technologies for Water Treatment, 1st ed.; Basile, A., Cassano, A., Rastogi, N.K., Eds.;
Woodhead Publishing: Oxford, UK, 2015; pp. 379–407. [CrossRef]
24. Sassi, K.M.; Mujtaba, I.M. Effective design of reverse osmosis based desalination process considering wide
range of salinity and seawater temperature. Desalination 2012, 306, 8–16. [CrossRef]
25. Skiborowski, M.; Mhamdi, A.; Kraemer, K.; Marquardt, W. Model-based structural optimization of seawater
desalination plants. Desalination 2012, 292, 30–44. [CrossRef]
26. Lv, H.; Wang, Y.; Wu, L.; Hu, Y. Numerical simulation and optimization of the flash chamber for multi-stage
flash seawater desalination. Desalination 2019, 465, 69–78. [CrossRef]
27. Filippini, G.; Al-Obaidi, M.A.; Manenti, F.; Mujtaba, I.M. Performance analysis of hybrid system of multi effect
distillation and reverse osmosis for seawater desalination via modelling and simulation. Desalination 2018,
448, 21–35. [CrossRef]
28. Rao, G.P. Unity of control and identification in multistage flash desalination processes. Desalination 1993, 92,
103–124. [CrossRef]Membranes 2020, 10, 265 18 of 18
29. Helal, A.M.; Medani, M.S.; Soliman, M.A.; Flower, J.R. A tridiagonal matrix model for multistage flash
desalination plants. Comput. Chem. Eng. 1986, 10, 327–342. [CrossRef]
30. Husain, A.; Woldai, A.; Ai-Radif, A.; Kesou, A.; Borsani, R.; Sultan, H.; Deshpandey, P.B. Modelling and
simulation of a multistage flash (MSF) desalination plant. Desalination 1994, 97, 555–586. [CrossRef]
31. Belghaieb, J.; Aboussaoud, W.; Abdo, M.-I.; Hajji, N. Simulation and Optimization of a Triple-Effect Distillation
Unit. In Proceedings of the 14th Conference on Process Integration, Modelling and Optimisation for Energy
Saving and Pollution Reduction, Florence, Italy, 8–11 May 2011; Klemes, J.J., Pierucci, S., Eds.; AIDIC:
Milano, Italy, 2011.
32. Altaee, A. Computational model for estimating reverse osmosis system design and performance:
Part-one binary feed solution. Desalination 2012, 291, 101–105. [CrossRef]
33. Haaz, E.; Fozer, D.; Nagy, T.; Valentinyi, N.; Andre, A.; Matyasi, J.; Balla, J.; Mizsey, P.; Toth, A.J.
Vacuum evaporation and reverse osmosis treatment of process wastewaters containing surfactant material:
COD reduction and water reuse. Clean Technol. Environ. Policy 2019, 21, 861–870. [CrossRef]
34. Haaz, E.; Toth, A.J. Methanol dehydration with pervaporation: Experiments and modelling. Sep. Purif. Technol.
2018, 205, 121–129. [CrossRef]
35. Toth, A.J. Comprehensive evaluation and comparison of advanced separation methods on the separation of
ethyl acetate-ethanol-water highly non-ideal mixture. Sep. Purif. Technol. 2019, 224, 490–508. [CrossRef]
36. Edgar, T.F.; Himmelblau, D.M.; Lasdon, L.S. Optimization of Chemical Processes, 2nd ed.; McGraw-Hill:
Michigan, CA, USA, 2001.
37. Nagy, J.; Kaljunen, J.; Toth, A.J. Nitrogen recovery from wastewater and human urine with hydrophobic gas
separation membrane: Experiments and modelling. Chem. Pap. 2019, 73, 1903–1915. [CrossRef]
38. DuPont, WAVE Manual. 2020. Available online: https://www.dupont.com/Wave/Default.htm (accessed on
7 August 2020).
© 2020 by the author. Licensee MDPI, Basel, Switzerland. This article is an open access
article distributed under the terms and conditions of the Creative Commons Attribution
(CC BY) license (http://creativecommons.org/licenses/by/4.0/).You can also read


