Green Solutions for Telecom Towers: Part II - Solar Photovoltaic Applications
←
→
Page content transcription
If your browser does not render page correctly, please read the page content below
Green Solutions for Telecom Towers: Part II
        Solar Photovoltaic Applications

        Essential Energy India Pvt Limited

        July 2013

© 2013 Essential Energy India Private Limited
Contents
1 INTRODUCTION 3
2 SOLAR PHOTOVOLTAIC TECHNOLOGY (SPV) OVERVIEW 3
2.1 Solar photovoltaic applications 4
2.2 Components of solar photovoltaic systems 4
2.3 Efficiency of solar photovoltaic panels 5
2.4 Geographic considerations for photovoltaic applications 6
2.5 Advantages and challenges of solar photovoltaic technology 7
3 SOLAR PHOTOVOLTAIC SOLUTIONS FOR TELECOM TOWERS 7
3.1 Solution design considerations 9
3.2 Opportunities and challenges of moving to solar technology in the India telecom industry 9
3.3 Government initiatives 11
3.4 Green energy mandate for telecom towers 12
4 CASE STUDIES 12
4.1 Case study 1 13
4.1.1 Site location 13
4.1.2 Site description 13
4.1.3 Site economics 15
4.2 Case study 2 17
4.2.1 Site location 17
4.2.2 Site description 17
4.2.3 Site economics 19
4.3 Challenges on the ground 20
5 FUTURE OF SOLAR PHOTOVOLTAIC TECHNOLOGY FOR TELECOM 21
© 2013 Essential Energy India Private Limited
21 Introduction
Energy saving is a key sustainability focus for the Indian telecom industry today. This is especially true in
1
rural areas where energy consumption contributes to 70% of the total network operating cost . In urban
2
areas, the energy cost for network operation ranges between 15-30% . This expenditure on energy as a
result of the lack of grid availability highlights a potential barrier to telecom industry growth, especially
regarding the expansion of rural teledensity which sits at 40.81% compared to teledensity in urban areas of
3
146.15% .
It is estimated that in India almost 70% of telecom towers are located in areas with more than eight hours of
4
grid outage and almost 20% are located in off-grid areas . This uncertainty in power availability has
compelled infrastructure providers to use diesel generators to ensure a continuous supply of power. Annually
more than 2.6 billion litres of diesel are consumed to operate telecom towers, resulting in the emission of 7
5
million metric tonnes of CO2 . Given the deregulation of diesel prices and the need to reduce carbon
emissions, it has become imperative for the industry to evaluate all alternative options in order to improve
network operation and to reduce energy costs. Several efforts have been made to optimise energy costs,
such as converting indoor base transceiver stations (BTS) to outdoor ones in order to eliminate air
conditioning on site, installing energy-efficient equipment and also using clean energy sources to power the
sites. Among them, using clean energy sources for power has the potential to resolve the three key needs of
the telecom industry, namely: reduction in diesel usage; expansion of telecom infrastructure to off-grid areas;
and reduction in carbon emissions. Clean-energy technologies are well supported by the Indian
6
Government’s subsidy policy . While clean energy technologies such as solar photovoltaic, wind turbines,
biomass power and fuel cells have undergone trials at telecom sites, the majority of these trials have been
with solar photovoltaic technology.
This white paper discusses two real-time telecom tower sites using solar photovoltaic technology. The
discussion includes an overview of the solution configuration and the economic case which includes OPEX
comparisons before and after the deployment of the solar photovoltaic solution. The challenges for large-
scale, on ground adoption are also evaluated.
2 Solar Photovoltaic Technology (SPV) Overview
Solar photovoltaic technology uses the light (photons) from the sun to produce DC electricity. As shown in
figure 1, a photovoltaic cell is a light-sensitive semiconductor device which, when exposed to sunlight,
releases electrons to produce DC current.
1
Adoption of Green Technology and Safety of Wireless Network by Milan Jain (Sr. Research Eng. – Converged
Network, TRAI)
2
Adoption of Green Technology and Safety of Wireless Network by Milan Jain (Sr. Research Eng. – Converged
Network, TRAI)
3
http://www.indiatelecomonline.com/topics/telecom-statistics/
4
http://www.gsma.com/mobilefordevelopment/wp-content/uploads/2012/05/Energy-for-the-Telecom-Towers-India-Market-Sizing-and-
Forecasting-September-2010.pdf
5
Assumption – 2.1 litres. Diesel usage per hour and 8 hours of outage per day for 4,25,000 towers
6
http://www.solar-apps.com/Revised-Capital-Subsidy-and-Benchmark-cost-of-the-SPV-system.pdf
© 2013 Essential Energy India Private Limited
3Figure 1: Electricity generation in a solar photovoltaic cell
nSilicon
Electron flow
Sunlight
Hole Flow
Solar Photovoltaic Panel
pSilicon
2.1 Solar photovoltaic applications
Solar photovoltaic technology can be used as either a stand-alone, grid-connected or hybrid solution. The
table below summarises the description of each type of application.
Table 1: Three types of solar photovoltaic applications
Solar photovoltaic applications Description
Stand-alone This type of application requires the equivalent level of backup energy
storage to ensure power supply when sunshine is unavailable.
Grid-connected In this application, energy is fed back from the photovoltaic module to
the grid.
Hybrid This is a combination of photovoltaic arrays and other energy sources
such as hybrids with wind turbines, biomass power, fuel cells and
diesel generators.
2.2 Components of solar photovoltaic systems
Solar photovoltaic cells, modules, panels, strings and arrays
Solar photovoltaic cells are the building blocks of a solar photovoltaic system. Each photovoltaic cell circuit
is packaged in a protective laminate to avoid moisture and corrosion.
Solar photovoltaic modules consist of photovoltaic cell circuits and are connected in series and/or parallel
to produce the required currents.
Solar photovoltaic panels are the assembly of modules and are wired in series to form an installable unit.
A number of panels are connected in series and are termed as a solar photovoltaic string.
© 2013 Essential Energy India Private Limited
4Solar photovoltaic arrays are a group of strings which form the complete power generation unit. Figure 2
illustrates a solar cell, module, array and string structure.
7
Figure 2: Structure of a photovoltaic system
Solar Cell
Solar Module
Solar Panel
Solar String
Solar Array
Solar Photovoltaic Fuses
Charge controller
A charge controller regulates the voltage and current output from the solar panels as required by the battery
and the load. It also keeps the batteries protected from overcharging and discharging.
Battery bank
The battery bank is used as storage providing the source of power during non-sunshine hours. Battery
capacity is measured in Ampere-hours (Ah) at a constant discharge rate. A wide range of batteries can be
used in solar photovoltaic configurations. Lead-acid and valve-regulated lead-acid (VRLA) gel batteries are
most commonly used across telecom sites in India.
2.3 Efficiency of solar photovoltaic panels
The efficiency of a solar photovoltaic system varies and depends on the grade of the photovoltaic material
used. The table below summarises the various types of solar photovoltaic materials and their respective
efficiencies.
8
Table 2: Current range of efficiencies for different solar photovoltaic technologies
Wafer-based c-Si Thin films
Single Multi Amorphous Silicon (a- Cadmium-Telluride Copper-Indium-Diselenide
Crystalline Crystalline Si); Micro-morph (CdTe) (CIS) / Copper-Indium-
(sc-Si) (mc-Si) Silicon (a-Si/μc-Si) Gallium- Diselenide
(CIGS)
14-20% 13-15% 6-9% 9-11% 10-12%
7
http://www1.cooperbussmann.com/pdf/9df1f7ec-8c62-4210-8cf8-9504927394f0.pdf
8
http://www.iea.org/publications/freepublications/publication/pv_roadmap.pdf
© 2013 Essential Energy India Private Limited
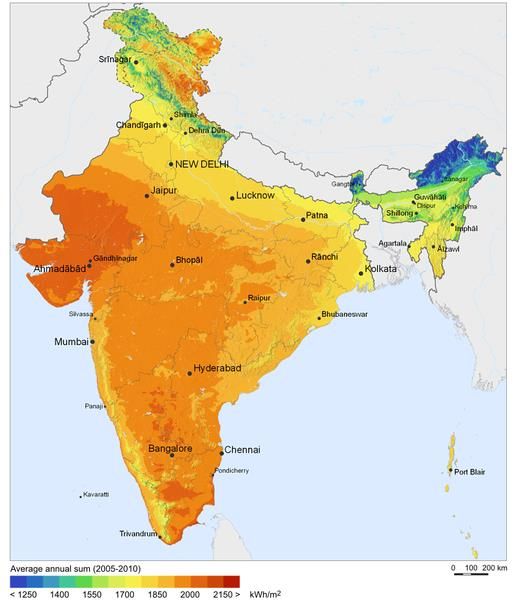
52.4 Geographic considerations for photovoltaic applications
Geographic parameters including daily average energy incidents, the duration and availability of sunshine
and also solar power density across different geographic locations, influence the scope of solar photovoltaic
deployment. Table 3 provides facts on solar radiation in India.
9
Table 3: Geographic considerations of solar photovoltaic applications in India
Parameters Availabilities
Daily average energy incidents 4-7kWhr/m2
Solar power density across India See solar map of India (figure 3)
Duration of quality sunshine per day Approximately 5 hours
Number of days with quality sunshine 300
The figure below shows the solar power density across India which maps the performance and deployment
feasibility of solar photovoltaic solution
10,11
Figure 3: Solar power density in India
9
http://en.wikipedia.org/wiki/Solar_power_in_India
10
http://en.wikipedia.org/wiki/File:Solar_Resource_Map_of_India.png
11
Map presents annual average of solar power density
© 2013 Essential Energy India Private Limited
62.5 Advantages and challenges of solar photovoltaic technology
Solar photovoltaic technology has some limitations which make its mass adoption challenging. These include
high initial levels of capital investment, the requirement for large deployment areas, dependency on sunshine
availability and configuration of storage capacity. Table 4 provides a broad overview of some of the basic
advantages and challenges of solar photovoltaic applications.
Table 4: Advantages and challenges of solar photovoltaic technology
Parameters Advantages Challenges
Emissions Zero None
Space requirement None Footprint requirement @10 square
meter/kW.
CAPEX Recent drop in panel price Requires high storage capacity, hence
due to mass manufacturing and the additional battery cost increases
technology innovation the CAPEX.
OPEX No fuel required Regular panel cleaning is required to
maintain optimum efficiency.
Sunshine availability Average 300 days annually Some geographic locations in India
have a prolonged monsoon season
and hence less availability of
sunshine.
Solution configuration Easily integrated into Intermittent sunshine availability
hybrid solution requires equipment automation to
optimise solar photovoltaic usage. A
higher capacity solution leads to a
higher CAPEX investment.
Storage Enough sunshine to charge the High battery capacity is required in
battery in high solar density (4- areas with less solar power density
2 2
7kWh/m ) areas (less than 4 kWh/m ).
3 Solar Photovoltaic Solutions for Telecom Towers
Enabling distributed power generation and emission-free operation makes solar photovoltaic technology a
desired option for backup power. However, the dependency on sunshine and the average space requirement
12
of 10 square metres for a 1kWp panel limits the scope of deployment.
In recent trials, the two types of applications deployed at telecom tower sites are stand-alone and hybrid
solar photovoltaic. The application types were chosen based on the site load profile, grid outage scenarios,
12
Solar Opportunities in Telecom by Sai Ram Prasad, CTO, Bharti Infratel, Solar Directory 2012
© 2013 Essential Energy India Private Limited
7space availability at the site and other configuration aspects including average sunshine availability
throughout the trial and the power storage configuration for non-sunshine hours.
The illustration in figure 4 describes the stand-alone system and figure 5 details the hybrid application using
solar photovoltaic technology. Hybrid applications can be developed by combining solar photovoltaic
technology with various energy sources such as wind turbines, biomass gasifiers, fuel cells and diesel
generators. Using an augmented battery bank is not considered to be a hybrid solution; instead it is a part of
the solar photovoltaic solution.
Figure 4: Stand-alone solar photovoltaic application
Charge Controller Battery Bank DC Load
Solar Panel
Inverter AC Load
Figure 5: Hybrid solar photovoltaic application
Charge Controller Battery Bank DC Load
Solar Panel
Inverter AC Load
Electrical Grid
© 2013 Essential Energy India Private Limited
83.1 Solution design considerations
The solution design is based on the availability of sunshine in a particular geographic region. Table 5
provides a theoretical approach to solution design and describes the parameters for solution design
consideration.
Table 5: Factors influencing solar photovoltaic solution design
Parameters Description
Load A detailed site load profile is required to design the total panel
capacity.
Efficiency losses Efficiency losses of the various tower site equipment influence solar
panel capacity. Solar photovoltaic technology as an energy source
needs the capacity to support the BTS load after considering the
losses of the battery, charge controller and other auxiliary loads.
Energy incident The availability of daily average energy incidents of 4-6 hours
duration largely impacts the energy output per panel. This
determines the panel capacity at the site.
Efficiency of solar photovoltaic The efficiency of different panel sizes influences the total solution
panels footprint. Also the number of panels required to meet the energy
Panel capacity demand is determined by panel efficiency.
Panel size
Battery configuration The charging current limitation of a given battery is fixed and based
Charging current limitation on its specification. Battery capacity is designed according to the
Battery output voltage duration and availability of sunshine and charging current limitation,
required (Ah) especially when solar is the only source of battery charging.
3.2 Opportunities and challenges of solar photovoltaic technology adoption in the
Indian telecom industry
Solar photovoltaic technology has come to be economically viable for different applications over the last few
years as a result of technology maturity, the scale of adoption, mass manufacturing and innovation. Solar
photovoltaic prices have reduced by 65% since 2001 and 73% since 200713. The trend in price fall is
represented in figure 6 below.
13
http://thisisxy.com/blog/the-rise-of-green-mobile-telecom-towers
© 2013 Essential Energy India Private Limited
914
Figure 6: Price trend of solar photovoltaic modules, 2001 to 2012
4
3.5 -73%
3
-65%
2.5
2
1.5
1
0.5
0
2001 2007 Q32012
This significant price reduction has redefined the economic viability of solar photovoltaic solutions for telecom
applications and could accelerate the speed of adoption. According to the Telecom Regulatory Authority of
India (TRAI), switching to solar will save $1.4 billion in operating expenses for telecom tower companies
15
compared to the current diesel solution .
The table below shows solar photovoltaic deployment statistics by different telecom operators and
16
infrastructure providers as of May 2013 . A few recent examples/initiatives of solar photovoltaic adoption
include Bharti Airtel’s plan for deploying 3000 solar photovoltaic sites, Idea Cellular’s intention for 200 solar
hybrid installations and Vodafone’s target of deploying 150 solar photovoltaic sites (in addition to the 390
17
sites currently deployed by Vodafone) .
Table 6: Adoption of solar photovoltaic applications for telecom towers18 (as per GSMA’s Green Deployment Tracker)
Company Solar towers
Bharti Infratel Ltd 1350
Vodafone Essar 390
Idea Cellular 100
Indus Towers 650
GTL Infrastructure 80
Total 2570
Though government subsidies, lower interest rates on loans and the significant reduction in solar panel
prices are encouraging, there are more challenges that need to be addressed including optimal solution
design for various energy management scenarios, seamless integration with other renewable energy
14
GTM Research, X&Y Partners analysis
15
http://www.ccaoi.in/UI/links/fwresearch/conceltation%20paper%203.pdf
16
http://www.gsma.com/mobilefordevelopment/programmes/green-power-for-mobile/tracker
17
http://www.gsma.com/mobilefordevelopment/wp-content/uploads/2013/01/GPM-Bi-Annual-Report-January-2013.pdf
18
http://www.gsma.com/mobilefordevelopment/programmes/green-power-for-mobile/tracker
© 2013 Essential Energy India Private Limited
10technology (RET) solutions and optimal configuration of solar photovoltaic panels as well as appropriate
storage and space requirements.
3.3 Government initiatives
The Indian government is taking a multifaceted approach to accelerate energy security and to reduce the
country’s dependency on fossil fuels. A few of the solar initiatives by various government bodies are outlined
below:
Jawaharlal Nehru National Solar Mission (JNNSM):
This programme provides a comprehensive framework of solar power development in India. The Mission
envisions 200 MW capacity of off-grid solar applications by the end of Phase-I (2013) and an overall
installation of 2,200 MW by 2022. Under this scheme, systems of up to 100 kWp will receive funding support
from the government.
Ministry of New and Renewable Energy (MNRE):
To encourage the usage of alternative and renewable energy sources, the MNRE provides the following
support under the JNNSM scheme:
19
The MNRE announced its support for 400 telecom towers using solar photovoltaic technology
Operator and infrastructure provides wide distribution of 400 MNRE-supported towers across India
The MNRE provides up to INR 81.00/Wp to offset the project cost
In April 2011, the MNRE revised the capital subsidy and benchmarked the cost of solar photovoltaic
20
systems to account for solar panel cost reduction in recent years
Table 7: Statistics of 400 solar powered towers supported by the MNRE in India
Operators States Number of solar-powered towers
Airtel Bihar 100
Indus Andhra Pradesh 100
GTL Infrastructure Uttar Pradesh 100
BSNL Across 12 states of India 100
Total 400
Universal Service Obligation Fund (USOF):
To evaluate the viability of using renewable energy sources in the USO Fund projects, the USO Fund has
collaborated with The Energy and Resources Institute (TERI) for the latter’s “Lighting a Billion Lives”
19
http://panchabuta.com/2011/08/22/400-telecom-towers-supported-in-pilot-project-for-use-of-solar-photovoltaic-power-systems-by-
mnre-for-fy11-in-india/
20
http://www.solar-apps.com/Revised-Capital-Subsidy-and-Benchmark-cost-of-the-SPV-system.pdf
© 2013 Essential Energy India Private Limited
11initiative. The aim is to provide additional mobile charging facilities for rural areas. The project will cover
21
5,000 villages across India over two years .
3.4 Green energy mandate for telecom towers
TRAI’s mandate requires that telecom companies should use renewable sources of energy to power at least
50% of rural telecom towers and 20% of urban telecom towers by 2015. By 2020, the telecom companies
22
have to convert 75% of rural towers and 33% of urban towers to run on hybrid power . The MNRE’s recent
23
mandate to convert a minimum of 50,000 towers to solar photovoltaic technology immediately is another
step towards ensuring compliance for the adoption of clean energy. Several proposals from the government
have been rolled out for solar powered telecom sites such as Bharat Sanchar Nigam Limited’s (BSNL’s)
tender for 15 telecom towers in Bihar24 and the Department of Telecommunications’ proposal for 2,200
25
telecom towers for security networks .
The Tower and Infrastructure Providers’ Association’s (TAIPA) initiative of forming Renewable Energy
Service Companies (RESCOs) provides a simplified ecosystem of energy management for telecom towers,
whereby infrastructure providers have to pay a fee based on the actual usage of power with no upfront
investment in capital. Thus far, high levels of capital investment and inability of a single renewable energy
technology to provide a full range of solutions across all geographies in India make it a challenge for
26
RESCOs to be successful .
Due to these varied energy management scenarios, the Indian telecom industry is yet to benchmark the cost
of operation for telecom towers.
4 Case Studies
The two case studies below provide an insight into the practicalities and economics of solar photovoltaic
technology implementation by providing actual data at the live sites. The discussion includes details of the
solution configuration and economic comparisons of the “before and after” solar hybrid solution installation at
both sites.
21
http://www.tele.net.in/telefocus/item/11111-telecom-outreach-key-role-of-the-uso-fund
22
http://www.igovernment.in/site/telecom-towers-be-powered-renewable-energy
23
http://www.energynext.in/at-least-50000-mobile-towers-should-switch-to-solar-mnre/
24
Tender No.-25068/MS-O&M/CSPS/Non BSNL sites/12-13/06
25
http://www.ciol.com/ciol/news/187289/dot-seek-cabinet-approval-200-green-towers
26
Intelligent Energy Ltd, Green Solutions for Telecom Towers: Part I, March 2013
© 2013 Essential Energy India Private Limited
124.1 Case study 1
4.1.1 Site location
Table 8: Site description of case study 1
Site location
Geographic location District: Kolar
State: Karnataka
Distance from Bangalore 72 km
Average daily temperature 35°C
4.1.2 Site description
Table 9: Site description of case study 1
Site description Units Values
Site type - Outdoor
Base transceiver station (BTS) - Outdoor
Number of BTS - 1
BTS load kW 1
Grid electricity panel kVA 15
Grid power availability hrs/day 9
Battery bank Ah 300
Diesel generator kVA 15
Energy management before the solar photovoltaic hybrid installation
Before the installation of the solar photovoltaic solution, the 15 hours of grid deficit was backed up by running
a 15kVA diesel generator for 12 hours and the remaining 3 hours using a 300Ah battery. Figure 7 illustrates
the power supply schematic at the site.
© 2013 Essential Energy India Private Limited
13Figure 7: Power supply schematic of backup power with diesel generator prior to solar hybrid installation of
case study 1
15kVA EB PIU 1kW
SMPS
Panel BTS
300Ah Battery
Bank
15kVA Diesel
Generator
Energy management after the solar photovoltaic hybrid installation
In February 2012, a solar photovoltaic solution was installed at the site. The solution includes 3kW solar
panels, a central controlling unit (CCU) and a 600Ah VRLA battery bank that supports the (on average) 14
hours of grid power outage per day. The static power conditioning unit (PCU) which replaces the earlier
power interface unit (PIU) provides the additional hour of grid utilisation by managing grid voltage fluctuation.
This turnkey solution is provided by ALTA Energy, India.
The central controlling unit controls and monitors solar power utilisation, grid power utilisation and battery
utilisation, as well as battery charging and discharging. The central controlling unit is programmed to
prioritise the solar photovoltaic technology as a primary power source over all the other power sources.
Hence, solar power is used when sunshine is available even if the grid power is available. The solution has
an inbuilt data transfer unit (DTU) to store and transmit data for remote monitoring and sends SMS alerts
through GPRS when service is required.
Since installation, the diesel generator has not been in use. Figure 8 below illustrates the power supply
schematic at the site.
© 2013 Essential Energy India Private Limited
14Figure 8: Power supply schematic, with solar photovoltaic installation for case study 1
ALL DC BOX
CCU
3kW Solar Panel
MPPT
15kVA EB
PCU
Panel
1kW
SMPS
BTS
600Ah Battery
Bank
Table 10: Solution configuration of case study 1
Components Units Value
Solar panel capacity kWp 3
PCU kVA 15
Solar maximum power point kW 5
tracker controller (MPPT)
SMPS kW 6
Battery capacity Ah 600
4.1.3 Site economics
OPEX comparison
Table 11 shows the monthly savings over the traditional diesel solution for backup power for the telecom
tower after the solar photovoltaic solution was installed. Evaluated in the comparison are cost of the grid,
cost of fuel for the diesel generator and operation and maintenance of the hybrid solution.
27
Table 11: OPEX comparison of the “before and after” solar photovoltaic hybrid installation for case study 1
Components Units Before solar hybrid After solar hybrid
Cost of grid consumption INR/day 99 69
Diesel cost INR/day 1186 0
Maintenance cost INR/day 159 37
Total OPEX INR/day 1444 116
Per unit OPEX INR/kWh 60 5
Savings per kWh is calculated to INR 55.00
27
All numbers are presented as actuals from site
© 2013 Essential Energy India Private Limited
15Payback period calculations
The solution costs INR 13,60,000. If the solution is financed for 120 months at 14% rate of interest, the
monthly pay out for CAPEX is INR 21,116 which adds INR 5 per kWh.
The graph in figure 9 compares the cost of energy of the solar photovoltaic solution with the diesel solution,
considering an annual expenditure for diesel at various price points, installed capacity and operation and
maintenance.
Figure 9: Cash-flow projections in case study 1
Payback period analysis for case study 1
Diesel @70.00 INR/ltr
Diesel @60.00 INR/ltr
Diesel @52.25 INR/ltr
Solar Photovoltaic
Year 0 Year 1 Year 2 Year 3 Year 4 Year 5 Year 6 Year 7 Year 8 Year 9
The graph summarises the time frame of the realised return on investment for the installed solar photovoltaic
solution in comparison with the yearly expenditure for the diesel solution. Considering the plausible price
points of diesel at INR 52.25 per litre28, INR 60 per litre and INR 70 per litre, the respective payback periods,
including CAPEX investment, are plotted. The chart demonstrates that, at INR 52.25 per litre of diesel, the
return on investment on solar photovoltaic can be realised after approximately 2.5 years of deployment.
When the price is at INR 60 or 70 per litre, the return on investment of solar photovoltaic technology will be
much faster, that is between 1 and 2 years. In this case, for every INR 10 increase in diesel price the time
frame of the return on investment for the solar photovoltaic solution is reduced by approximately 6 months.
The savings resulting from the deployment of the solar photovoltaic system will result in an increase in free
cash flow of INR 4,81,737 on an annual basis. In other words, the investment in the system will yield an IRR
of 33% which is significantly higher than cost of capital (14%) and implies viability of the solution.
This site has not received any capital subsidies for solar photovoltaic systems and hence such subsidies
have not been used in the calculation.
28
Delhi diesel price in June 2013 INR 50.25 per litre, plus INR 2.00 logistic cost
© 2013 Essential Energy India Private Limited
164.2 Case study 2
4.2.1 Site location
Table 12: Site location of case study 2
Site location
Geographic location District: Tumkur
State: Karnataka
Distance from Bangalore 150 km
Average daily temperature Minimum 18°C
Maximum 35°C
4.2.2 Site description
Table 13: Site description of case study 2
Site description Units Value
Site type - Outdoor
BTS - Outdoor
Number of BTS - 3
BTS load kW 3
Grid power availability hrs/day 6
Energy management before the solar photovoltaic hybrid installation
Before the installation of the hybrid solution, the site’s backup power requirement of 18 hours a day on
average was fulfilled by a 20kVA diesel generator running for a minimum of 10 hours per day and the
remaining 8 hours by three batteries each of 400Ah capacity, with one for each of the service providers’
BTSs. The diagram below represents the diesel generator power supply schematic at the site.
Figure 10: Power supply schematic of backup power with diesel generator prior to solar hybrid installation in case study 2
BTS 1
SMPS Bharti Airtel
Low Tension
(LT) Panel for
EB Panel Energy Meter 400Ah Battery
Power
Distribution Bank
20kVA Diesel
Generator
BTS 2
SMPS
Vodafone
400Ah Battery
Bank
BTS 3
SMPS
BSNL
400Ah Battery
Bank
© 2013 Essential Energy India Private Limited
17Energy management after the solar photovoltaic hybrid installation
In May 2009, a solar hybrid solution was installed to meet the 18 hours of outage. The solar hybrid solution
includes a 10kW solar photovoltaic panel, a 5kW wind turbine, a 22kW SMPS and a 2500Ah battery. The
400Ah battery bank also remains at each BTS. The battery was designed to ensure maximum energy
storage and utilisation of solar hybrid power at the site. Figure 11 illustrates the power supply schematic at
the site.
Figure 11: Power supply schematic after the solar hybrid solution installation in case study 2
BTS 1
EB Panel Energy Meter LT Panel
Diesel Generator
BTS 2
22kW SMPS
BTS 3
Solar Photovoltaic Charge
Control Unit
Wind 2500Ah Battery
Bank
As depicted in the diagram, both solar and wind power generators are connected to their respective charge
controller units (CCUs) for optimal power transfer. The following table provides configuration details of the
solar hybrid solution.
Table 14: Solar photovoltaic hybrid configuration in case study 2
Components Units Value
Solar panel capacity kWp 10
Solar charge controller and kW 10
maximum power point
tracker
Wind turbine and charge kWp 5
controller
Switch mode power supply kW 22
Battery capacity Ah 2500
© 2013 Essential Energy India Private Limited
18On certain days, due to prolonged grid failure, lack of sunshine or total absence of wind, the diesel generator
supports the backup power need. According to the site records, of the 18 hours of daily outage, on average
almost 16 hours of backup power is provided by the solar hybrid solution and the remaining 2 hours by the
29
diesel generator .
In comparison with case study 1, since the load is higher here, the possibility of using the solar hybrid
solution as a stand-alone option reduces.
4.2.3 Site economics
OPEX comparison
Table 15 shows the monthly savings after the solar hybrid solution was installed. Evaluated in the
comparison are the cost of grid consumption, cost of fuel for the diesel generator and the operation and
maintenance of the hybrid solution.
Table 15: Comparison of OPEX for the “before and after” solar photovoltaic hybrid installation for case study 230
Components Units Before solar hybrid After solar hybrid
Cost of grid consumption INR/day 263 269
Diesel cost INR/day 1138 354
Maintenance cost INR/day 379 441
Total OPEX INR/day 1781 1064
Per unit OPEX INR/kWh 25 15
Savings per kWh is calculated to INR 10
Payback period calculation
The solution which includes solar panels, wind turbine, battery bank, two charge controller units and SMPS
of capacities described in table 13 costs a total of approximately INR 27,00,000. If the solution is financed for
31
120 months at the rate of 14% interest , the monthly pay out for CAPEX is INR 42,200 which adds INR 25
per kWh. It should be noted that the solar solution design has not been optimised at this site. With
optimisation, there is an opportunity to reduce the CAPEX investment.
The graph below compares the cost of providing backup power using the solar photovoltaic solution in
comparison with a diesel-only solution at the various points of diesel price projection.
29
Based on site average actual data
30
All numbers are presented as actuals (March 2013) from site
31
60 months contract duration already completed and contract duration of 60 months likely to be extended as per discussions with
BSNL
© 2013 Essential Energy India Private Limited
19Figure 12: Cash-flow projection in case study 2
Pay back period analysis for case study 2
Diesel @ 70.00INR/ltr
Diesel @ 60.00INR/ltr
Diesel @ 52.25.00INR/ltr
Solar photovoltaic with around 80%
subsidies
Year 0 Year 1 Year 2 Year 3 Year 4 Year 5 Year 6 Year 7 Year 8 Year 9
The graph summarises the time frame of the realised return on investment for the installed solar photovoltaic
solution against the yearly expenditure of the diesel solution. At the time of this evaluation, the price of diesel
32
is INR 52.25 per litre . Given that the deregulation of diesel prices is expected at any time, diesel at INR 60
per litre and INR 70.00 per litre is used in this analysis chart. From the chart it can be determined that with an
increase of every INR 10 per litre in the price of diesel, the solar photovoltaic payback period reduces by
approximately 2.5 years. However, for this 3kW site, at the current price of INR 52.25 per litre and without
any subsidy from the government, the time frame of solar photovoltaic payback period is approximately 9
years.
The savings resulting from the deployment of the solar photovoltaic system will result in an increase in free
cash flow of INR 2,61,456 on an annual basis. In other words, the investment in the system will yield an IRR
of -1% which is significantly lowers than cost of capital (14%) and implies non-viability of the solution over the
contract duration of 10 years.
As a proof-of-concept site, this deployment received around 80% subsidy from the government, making the
solution economically viable from the date of installation as shown in figure 12.
4.3 Challenges on the ground
Due to the diversity of energy management scenarios, viability of the technology and maturity of the solution,
adoption of renewable energy technology has multiple challenges before it can be adopted at large scale
across the country. Table 16 captures a few of the major challenges encountered by both test case sites.
32
Delhi diesel price in June 2013 INR 50.25 per litre, plus INR 2.00 logistic cost
© 2013 Essential Energy India Private Limited
20Table 16: List of challenges faced by telecom infrastructure providers and RESCOs in deploying RET solutions at large
scale
Parameters Challenges
Technology Seamless integration with other energy sources such as wind turbines, biomass
challenges and fuel cells
Configuration of off-grid applications
Complex system integration (configuration is not optimised for consumption)
Design and Prioritisation of solar photovoltaic technology among other available energy
configuration sources for frequent outages
challenges Optimisation of solution configuration in terms capacity installed
Deployment Higher foot print requirement
challenges
Optimum exposure to sunshine for the solar panel
Poor operation and maintenance services
Scalability Capital intensive
challenges
Geographical limitation
Variety of energy management scenarios and flexibility of solution integration
Economic High CAPEX
challenges
Replacement of batteries further increases the capital investment
Not enough encouragement by government to overcome the tipping point in the
adoption of the technology at large scale
5 Future of Solar Photovoltaic Technology for Telecom
In telecom, solar photovoltaic technology has experienced a better rate of adoption to date in comparison
with other RETs. Achieving optimal configuration is still a barrier for large-scale adoption of the solution. As
shown in the case studies, telecom sites with lower load profiles benefit from solar photovoltaic technology
installations from day one whereas for telecom sites with higher load profiles, it is difficult to justify the cost of
capital investment required. The growing cost of diesel and relevant subsidies may tip the balance in favour
of solar investment in some of these cases. For higher load profile sites, battery capacity is high thereby
increasing capital investment and maintenance requirements. At times, these sites have to fall back on diesel
generators to supplement the gap left by the solar solution.
With innovative business models like the OPEX model solution where the initial capital investment is
financed and the telecom tower owner pays only for the usage, the solar adoption rate can increase
significantly.
While solar offers a good solution for many telecom towers with lower load profiles, the deployment
constraints at other towers make it necessary to evaluate the capabilities of alternative renewable energy
technologies aside from solar, such as biomass power and fuel cells. The next edition of this whitepaper will
discuss the practical and economic viabilities of these alternative technologies.
© 2013 Essential Energy India Private Limited
21Intelligent Energy acknowledges the contribution of ALTA Energy India and all others, for sharing information and conducting primary
research used in the development of this white paper.
A special thanks to Mr P.K. Panigrahi, Sr. Dy. Director General (BW), DOT and Mr V.K. Hirna, Dy. Director General (Electrical), DOT for
their support.
About Intelligent Energy
Intelligent Energy delivers efficient and clean energy technology for the global consumer electronics, automotive and stationary power
markets – from compact energy packs for mobile devices, to power-trains for zero-emission vehicles, and stationary power units for the
always-on infrastructure.
Our unique technology architecture is used by global blue chip companies to create differentiated, cost-efficient fuel cell power systems
for mass market applications. It enables Intelligent Energy and our industry partners to solve the challenges of continuous power and
productivity, by creating convenient everyday energy solutions to power your life.
Intelligent Energy operates globally, with offices in the Americas, Europe and Asia.
www.intelligent-energy.com
About Essential Energy
Essential Energy is a wholly owned subsidiary of Intelligent Energy Holdings, plc.
Essential Energy was formed to address the growing gap between supply and demand in countries like India. The large number of new
innovative technologies and novel methods for delivery of energy from these technologies has created confusion among customers.
Essential Energy was created to partner with such customers allowing them to meet their energy requirements in a responsible and
economical manner.
We work with our customers to deliver efficient solutions and educate them to adopt energy modest loads while not compromising on
their requirements.
We are based out of Bangalore, India and have a team of experienced professionals with illustrious backgrounds in energy, finance and
power systems engineering
www.e2-india.com
© 2013 Essential Energy India Private Limited
22*****
Guideline:-
Title (Bold –EE Blue) – Arial 24 PT
Sub Title (Regular- EE Blue) – Arial 18 PT
First Heading (Bold- EE Blue) – Arial 14 PT
nd
2 Heading (Bold – EE Grey) – Arial 12 PT
rd
3 Heading (Bold – EE Blue) - Arial 10 PT
Body (Regular Text- EE Grey) - Arial 10 PT
Image, Table, Figure: Arial 9Pt
Footnote: Arial 8PT
Text Spacing : 1.5
(BLUE) Text Color - R 68 G 123 B 190
(Grey) Text Color - R 39 G 40 B 39
© 2013 Essential Energy India Private Limited
23You can also read


