IMPROVED KINETICS AND WATER RECOVERY WITH PROPANE AS CO-GUEST GAS ON THE HYDRATE-BASED DESALINATION (HYDESAL) PROCESS - MDPI
←
→
Page content transcription
If your browser does not render page correctly, please read the page content below
chemengineering

Article
Improved Kinetics and Water Recovery with Propane
as Co-Guest Gas on the Hydrate-Based Desalination
(HyDesal) Process
Abhishek Nambiar, Ponnivalavan Babu *                and Praveen Linga *
 Department of Chemical and Biomolecular Engineering, National University of Singapore, Engineering Drive 4,
 Singapore 117585, Singapore; abhishekpnambiar@yahoo.co.in
 * Correspondence: a0013254@u.nus.edu (P.B.); chepl@nus.edu.sg (P.L.)

 Received: 9 December 2018; Accepted: 6 March 2019; Published: 12 March 2019

 Abstract: Water is a key resource for sustainable development and plays a crucial role in human
 development. Desalination is one of the most promising technologies to mitigate the emerging water
 crisis. Thermal desalination and reverse osmosis are two of the most widely employed desalination
 technologies in the world. However, these technologies are energy intensive. Clathrate-hydrate-based
 desalination (HyDesal) is a potential energy-efficient desalination technology to strengthen the
 energy–water nexus. In our previous study, we proposed a ColdEn-HyDesal process utilizing waste
 Liquefied Natural Gas (LNG) cold energy based on a fixed-bed reactor configuration. In this study, we
 evaluated the effect of 10% propane in three different gas mixtures, namely, nitrogen (G1), argon (G2),
 and carbon dioxide (G3), as hydrate formers for the HyDesal process. The achieved water recovery
 was very low (~2%) in the presence of NaCl in the solution for gas mixtures G1 and G2. However,
 high water recovery and faster kinetics were achieved with the G3 mixture. To improve the water
 recovery and kinetics of hydrate formation for the G2 gas mixture, the effect of sodium dodecyl sulfate
 (SDS) was evaluated. The addition of SDS did improve the kinetics and water recovery significantly.

 Keywords: gas hydrates; desalination; clathrate process; seawater

1. Introduction
     Water is one of the key resources for sustainable development and plays a crucial role in human
development. Due to the increasing global population, extensive urbanization, and a changing climate,
access to freshwater will be a challenge. Even today, close to 1.2 billion people have no access to safe
drinking water [1–3]. Freshwater accounts for only 2.5% of all the water on the planet and less than 1% is
actually available, while the remaining is in the form of ice and snow cover in mountainous regions, the
Antarctic, and Arctic regions [4]. By 2050, the demand for fresh water is expected to increase by 55% [5].
Hence, the water industry has become increasingly reliant upon desalinating brackish water and seawater.
     Desalination is the process of removing salts and minerals from seawater or brackish water.
Desalination processes are broadly categorized as thermal or membrane-based technologies [6,7].
Multistage flash (MSF) distillation, a thermal desalination technique, remains the primary technology
for desalination in the Middle East due to the easy availability of fossil fuels and the poor feed
water quality. The specific energy consumption and water recovery of MSF are 13.5–25.5 kWh/m3
and up to 20%, respectively, depending on the operating conditions [8–10]. Reverse osmosis (RO),
a membrane-based technology, is presently the state-of-the-art technology for seawater desalination
and contributes to 66% of the world’s installed desalination capacity. The water recovery of the
RO process is up to 55% and its specific energy consumption is 3–6 kWh/m3 of recovered potable
water [11–13]. The major limitation of these technologies is that both are energy intensive, which in

ChemEngineering 2019, 3, 31; doi:10.3390/chemengineering3010031        www.mdpi.com/journal/chemengineering
ChemEngineering 2019, 3, 31 2 of 16
turn results in a corresponding increase in the emission of greenhouse gases [13,14]. Hence, there is a
need to develop an innovative low-energy desalination process for sustainable development.
One such technology is hydrate-based desalination (HyDesal). The HyDesal process effectively
falls in the class of approaches based on freezing. In this process, water molecules form cages around a
guest gas/liquid component, thereby effectively separating themselves from the brine solution even
at temperatures higher than the normal freezing temperature of water. These hydrate crystals, when
melted, are essentially fresh water and the guest component can be reused for the desalination. Other
applications of hydrate-based technology on selective fractionation are gas separation, gas storage,
natural gas storage and transport, CO2 sequestration, cold storage, and refrigeration [15–22].
Although hydrate-based desalination was first proposed in 1942, major R&D efforts followed
in after the 1960s. A detailed review of works on hydrate-based desalination till 1990 was presented
by Englezos [17]. The initial approach that was proposed several decades ago was to pump
hydrate-forming guest species directly into the ocean at depths of 1000 m, separate the crystals,
and, upon dissociation, produce pure water [23,24]. This attempt failed due to the challenge of
separating the hydrates from the seawater as well as the issue of the stability of hydrate crystals. Later,
an improved clathrate desalination process was proposed using halogenated hydrocarbons as guests
for hydrate formation [25]. However, these refrigerants have been banned due to their environmental
impact [26] and cannot be used; hence, the process never received much attention. Ripmeester and
Mccormack [27] proposed a clathrate-hydrate-based desalination process using cyclopentane as a
clathrate-forming agent. The proposed process requires an additional step of separating cyclopentane
from fresh water. Our recent work employing cyclopentane for carbon dioxide capture revealed
significant solvent loss and environmental impact because of its high volatility [28]. Although the
HyDesal process has been studied for last 70 years, it has never been commercially viable due to slow
kinetics, difficulty in separating hydrate crystals from the brine solution, and the higher energy cost
involved due to refrigeration [17,29]. The state of the art of clathrate-hydrate-based desalination in the
literature and development challenges for successful commercialization are presented elsewhere [29].
In our previous work, we proposed a conceptual hydrate-based desalination (ColdEn-HyDesal)
process employing a fixed-bed reactor configuration utilizing waste Liquefied Natural Gas (LNG)
cold energy to minimize the energy requirement based on the ability of propane as a co-guest in a
gas mixture to draw dispersed water from the sand bed towards the gas phase for hydrate growth,
resulting in enhanced kinetics [30]. We also reported that by utilizing waste LNG cold energy, the
specific energy consumption of the HyDesal process can be lowered from 65.13 to 0.84 kWh/m3 of
potable water [31]. The other constituent in the gas mixture along with propane needs to be identified,
as this can result in enhanced kinetics.
In this study, the effect of C3 H8 /N2 (G1), C3 H8 /Ar (G2), and C3 H8 /CO2 (G3) gas mixtures on water
recovery were evaluated for hydrate-based desalination employing a fixed-bed reactor configuration.
Experiments were carried out with pure water and a 3 wt% NaCl solution in a fixed-bed reactor with
sand as porous media to evaluate the kinetics of hydrate formation and water recovery. In addition, the
effect of the addition of sodium dodecyl sulfate (SDS) as a kinetic promoter was also evaluated.
2. Materials and Methods
2.1. Materials
The N2 /C3 H8 (90 mol%/10 mol%), Ar/C3 H8 (90 mol%/10 mol%), CO2 / C3 H8 (90 mol%/10 mol%),
CO2 /C3 H8 (95 mol%/5 mol%), and CO2 /C3 H8 (80 mol%/20 mol%) gas mixtures employed in this
study were supplied by Soxal Private Limited. Silica sand and sodium chloride (CAS 7647-14-5) of 99%
purity were supplied by Sigma-Aldrich. The properties of the silica sand employed in this study, such
as size, pore volume, and bulk density, are tabulated in Table 1. SDS of 99% purity was supplied by
Amresco. Deionized and distilled water were used for the experiments and to prepare the different
concentration solutions.ChemEngineering 2019, 3, 31 3 of 16
ChemEngineering 2019, 3 FOR PEER REVIEW 3
Table 1.
Table Summary of
1. Summary of silica
silica sand
sand properties.
properties.
MediumSand
Medium Sand11(MS1)
(MS1) Medium Sand
Medium Sand 22(MS2)
(MS2) Coarse
CoarseSand
Sand Granular
GranularPebble
Pebble
Size range
Size range(mm)
(mm) 0.1–0.5
0.1–0.5 0.21–0.29
0.21–0.29 0.56–1.3
0.56–1.3 1.5–3.0
1.5–3.0
Bulk
Bulk (g/cm3)3 )
density(g/cm
density 1.56
1.56 1.61
1.61 1.53
1.53 1.49
1.49
Pore volume (cm33 /g) 0.27 0.27 0.238 0.258
Pore volume (cm /g) 0.27 0.27 0.238 0.258
2.2. Apparatus
2.2. Apparatus
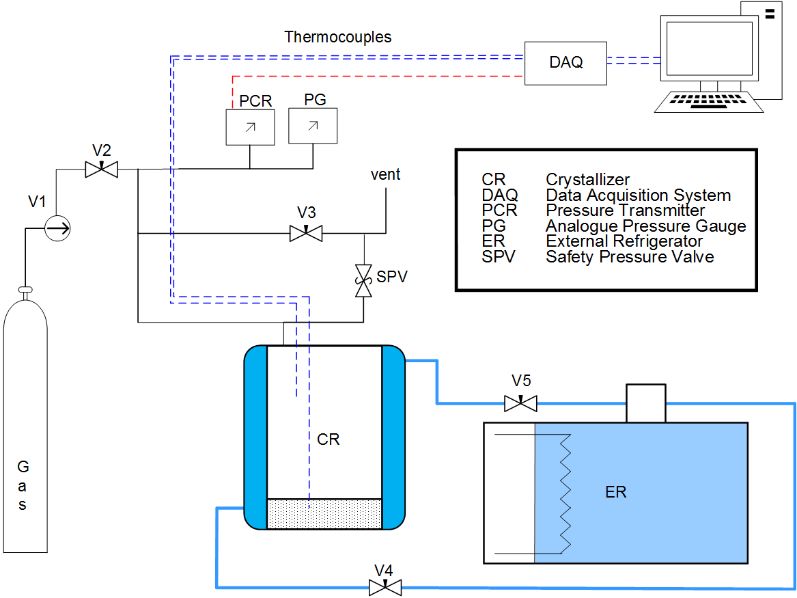
The detailed
The detailed description
description of the apparatus
apparatus can be found in our our previous
previous work [32]. The The schematic
schematic
of the
of the experimental
experimental apparatus
apparatus is
is shown
shown in in Figure
Figure 1.
1. Briefly,
Briefly, the apparatus
apparatus consisted
consisted of
of a crystallizer
crystallizer
of volume 980 cm33 and
of volume and an
an internal
internal diameter
diameter ofof 10.16
10.16 cm. A A window
window at at the
the top
top of
of the crystallizer
crystallizer
allowed for
allowed for viewing
viewing the
the crystallizer
crystallizer contents.
contents. The
The temperature
temperature of of the
the crystallizer
crystallizer was
was controlled
controlled by
by
the cooling
the cooling jacket connected to an external refrigerated
refrigerated circulator.
circulator. An Omega copper-constantan
copper-constantan
thermocouple with
thermocouple withan
anuncertainty
uncertaintyof 0.1 K located
of 0.1 at 1 cm
K located at from
1 cmthe bottom
from the of the crystallizer
bottom measured
of the crystallizer
the bed temperature.
measured Another Omega
the bed temperature. Anothercopper–constantan thermocouple
Omega copper–constantan was used towas
thermocouple measure
used the
to
gas phasethe
measure temperature.
gas phase The pressure of
temperature. Thethepressure
crystallizer
of was
the measured
crystallizerusing
was ameasured
Rosemount smart
using a
pressure transducer (model 3051S, ± 20 kPa). The pressure and temperature data
Rosemount smart pressure transducer (model 3051S, ±20 kPa). The pressure and temperature datawere recorded using
a National
were Instruments
recorded using a CompactRIO data acquisition
National Instruments system data
CompactRIO and LabView
acquisitionsoftware.
system and LabView
software.
Figure
Figure 1.
1. Schematic
Schematic of
of the
the clathrate-hydrate-based
clathrate-hydrate-based desalination
desalination apparatus.
apparatus.
2.3. Procedure
2.3. Procedure
2.3.1. Preparation of Solution
2.3.1. Preparation of Solution
The NaCl solution of desired concentration was prepared by adding the desired amount of
The NaCl solution of desired concentration was prepared by adding the desired amount of
sodium chloride and distilled water and mixing thoroughly. In this study, 3.0 wt% concentration of
sodium chloride and distilled water and mixing thoroughly. In this study, 3.0 wt% concentration of
NaCl was used. SDS solution of desired concentration was prepared by adding the desired amount of
NaCl was used. SDS solution of desired concentration was prepared by adding the desired amount
SDS and distilled water and mixing thoroughly. The concentrations of SDS used in this study were
of SDS and distilled water and mixing thoroughly. The concentrations of SDS used in this study were
100, 500, and 1000 ppm. The SDS-salt solution was prepared by adding the desired amount of sodium
100, 500, and 1000 ppm. The SDS-salt solution was prepared by adding the desired amount of sodium
chloride, SDS, and distilled water and mixing thoroughly.
chloride, SDS, and distilled water and mixing thoroughly.
2.3.2. Preparation of Silica and Bed
2.3.2. Preparation of Silica and Bed
In our previous study [30], we reported a 1.5-cm bed height to be optimum. Therefore, we used a
In our previous study [30], we reported a 1.5-cm bed height to be optimum. Therefore, we used
bed height of 1.5 cm in this study. The amount of silica sand and solution used to prepare the bed were
a bed height of 1.5 cm in this study. The amount of silica sand and solution used to prepare the bed
197.24 g and 53.26 mL, respectively. The bed was set up by splitting the required amount of sand and
were 197.24 g and 53.26 mL, respectively. The bed was set up by splitting the required amount of
solution into three equal parts and placing each in a batch order to form a uniform bed.
sand and solution into three equal parts and placing each in a batch order to form a uniform bed.
2.3.3. Hydrate Formation ProcedureChemEngineering 2019, 3, 31 4 of 16
ChemEngineering
2.3.3. Hydrate2019, 3 FOR PEER
Formation REVIEW
Procedure 4
Once the
the bed
bed was
wasprepared,
prepared,thethecrystallizer
crystallizerwas
wasclosed
closedandandthe
thethermocouples
thermocouples were
wereconnected
connectedto
their respective ports. To purge the air inside the crystallizer, the system was pressurized
to their respective ports. To purge the air inside the crystallizer, the system was pressurized to 300 to 300 kPa
and
kPa then depressurized
and then to 50 kPa
depressurized with
to 50 kPathe gasthe
with mixture three times.
gas mixture threeThe crystallizer
times. was then was
The crystallizer cooled to
then
the experimental
cooled temperature using
to the experimental the external
temperature refrigerated
using the externalcirculator. Once the
refrigerated crystallizer
circulator. reached
Once the
the desired reached
crystallizer temperature, the system
the desired was pressurized
temperature, with
the system thepressurized
was same gas mixture
with the used
samein gas
the purging
mixture
step
usedtointhe
thedesired
purgingexperimental pressure.
step to the desired The temperature
experimental andThe
pressure. pressure were allowed
temperature to stabilize
and pressure were
and reach the experimental conditions. The time at which the pressure and temperature
allowed to stabilize and reach the experimental conditions. The time at which the pressure and of the system
reached the experimental
temperature of the system condition
reachedwas recorded as time
the experimental zero. The
condition was data were recorded
recorded as time every 20 s.data
zero. The The
crystallizer
were recorded pressure
everydropped
20 s. Thedue to hydrate
crystallizer formation
pressure and growth.
dropped The experiment
due to hydrate formation wasand continued
growth.
until no significant pressure drop in the crystallizer was observed. A schematic
The experiment was continued until no significant pressure drop in the crystallizer was observed. Aof the experimental
procedure
schematic of followed is shown inprocedure
the experimental Figure 2. followed is shown in Figure 2.
Figure 2. Schematic of the experimental procedure.
2.4. Calculation of
2.4. Calculation of Water
Water Recovery
Recovery
The moles of gas consumed
The moles of gas consumed for for hydrate
hydrate formation
formation and growth at
and growth any time
at any time were
were calculated
calculated using
using
the following equation:
the following equation:
PV PV
∆n H,↓ t =
− (1)
zRT
PV CR,0 zRT PV CR,t
(
ΔnH ,↓ =
t
where P, V, and T are the crystallizer pressure,
) zRT
volume,
−
zRT
CR , 0 and
CR , t
temperature,
(1)
respectively; R is the ideal
gas constant; and z is the compressibility factor calculated by Pitzer’s correlation [33].
where TheP, volume
V, and Tofare the crystallizer
water converted topressure,
hydrate volume, and temperature,
can be determined by using respectively; R is
the following the ideal
equation:
gas constant; and z is the compressibility factor calculated by Pitzer’s correlation [33].
The volume 3 equation:
Volumeofofwater
water converted
converted toto hydrate
hydratescan
= be
∆ndetermined by using the following
H,↓ × hydration number × 18 (cm ) (2)
Volume of water converted to hydrates = ΔnH ,↓ × hydration number ×18 (cm 3 ) (2)
where Δn_(H,↓) is the number of moles of gas consumed for hydrate formation at the end of the
experiment determined from the gas uptake. The hydration number is the number of water molecules
per guest molecule. Ar/C3H8 gas mixtures formed structure II (sII) hydrate, which had 16 small cagesChemEngineering 2019, 3, 31 5 of 16
where ∆n_(H,↓) is the number of moles of gas consumed for hydrate formation at the end of the
experiment determined from the gas uptake. The hydration number is the number of water molecules
per guest molecule. Ar/C3 H8 gas mixtures formed structure II (sII) hydrate, which had 16 small
cages and 8 large cages in a one-unit cell composed of 136 water molecules. The theoretical hydration
number used in the above equation was 5.67. For N2 /C3 H8 and CO2 /C3 H8 gas mixtures, the hydration
number used was 9.65 and 8.21, respectively, which were calculated using CSMGem [34].
Water recovery represents the volumetric process efficiency of the HyDesal process and can be
calculated by using the following equation, as given in the literature [29]:
Volume of water converted to hydrate × Fh
Water recovery % = × 100 (3)
Volume of feed solution
where Fh is the fraction of hydrate formed that is recoverable at the hydrate crystal separation step
from the brine. Since, in our study, the hydrate crystals were not separated from the brine, Fh of 1 was
calculated in the above equation.
The rate of water recovery (R20 ) was calculated by fitting the water recovery growth versus time
for the first 20 min from the nucleation point using the least-squares method.
3. Results and Discussion
A suitable gas mixture with propane as a constituent can lower the operating conditions as well as
enhance the hydrate formation rate and water recovery. We chose nitrogen, argon, and carbon dioxide
as the other constituent along with 10% propane and evaluated their effect on water recovery and rate
of hydrate formation. A summary of experimental results, such as induction time (IT), gas uptake at
IT, gas uptake after 60 min from IT, water recovery, and rate of water recovery, is presented in Table 2.
Table 2. Summary of experimental conditions and results with G1 (C3 H8 /N2 (10 mol%/90 mol%)), G2
(C3 H8 /Ar (10 mol%/90 mol%)), and G3 (C3 H8 /CO2 (10 mol%/90 mol%)) gas mixtures.
Gas Uptake Gas Uptake Water
Induction
System with G1 Exp. Pressure Temperature at IT 60 min from Recovery at R20
Time (IT)
Mixture No (MPa) (K) (mol/mol of IT (mol/mol 60 min from (cm3 /min)
(min)
Water) of Water) IT (%)
N1 5.0 275.5 250.33 0.0062 0.0438 36.34 0.21
Pure Water N2 5.0 275.5 41.67 0.0065 0.0603 51.96 0.22
N3 5.0 275.5 160.33 0.0051 0.0519 45.21 0.22
N4 5.0 274.2 1600 0.0035 0.0037 0.13 0.02
3.0 wt% NaCl solution
N5 5.0 274.2 117.33 0.0001 0.0014 1.24 0.00
Gas Uptake Gas Uptake Water
Induction
System with G2 Exp. Pressure Temperature at IT 60 min from Recovery at R20
Time (IT)
mixture No (MPa) (K) (mol/mol of IT (mol/mol 60 min from (cm3 /min)
(min)
Water) of Water) IT (%)
A1 5.0 274.2 91.67 0.0037 0.1017 53.41 0.29
Pure Water A2 5.0 274.2 1867.00 0.0046 0.1222 64.73 0.35
A3 5.0 274.2 429.67 0.0021 0.1060 58.90 0.92
Pure water with 100 A4 5.0 274.2 0.67 0.0002 0.1025 57.99 1.00
ppm SDS A5 5.0 274.2 0.33 0.0005 0.1102 62.16 1.16
Pure water with 500 A6 5.0 274.2 53.33 0.0017 0.0992 55.26 1.14
ppm SDS A7 5.0 274.2 24.00 0.0005 0.0971 54.75 1.20
Pure water with 1000 A8 5.0 274.2 90.67 0.0004 0.1016 57.38 1.18
ppm SDS A9 5.0 274.2 1864.33 0.0021 0.1053 58.52 1.23
A10 5.5 274.2 46.00 0.0015 0.0036 1.21 0.02
3.0 wt% NaCl solution A11 5.5 274.2 3.67 0.0012 0.0032 1.10 0.02
A12 5.5 274.2 4307.00 0.0028 0.0047 1.10 0.02
A13 5.5 274.2 42.67 0.0017 0.0132 6.50 0.17
3.0 wt% NaCl solution A14 5.5 274.2 187.67 0.0021 0.0157 7.72 0.19
with 100 ppm SDS A15 5.5 274.2 10.00 0.0008 0.0217 11.83 0.26
A16 5.5 274.2 0.33 0.0001 0.0193 10.95 0.31
3.0 wt% NaCl solution A17 5.5 274.2 168.33 0.0050 0.0679 35.67 0.69
with 500 ppm SDS A18 5.5 274.2 844.67 0.0020 0.0583 31.94 0.55
3.0 wt% NaCl solution A19 5.5 274.2 1.67 0.0001 0.0632 36.12 0.66
with 1000 ppm SDS A20 5.5 274.2 7.33 0.0009 0.0662 37.05 0.52ChemEngineering 2019, 3, 31 6 of 16
Table 2. Cont.
Gas Uptake Gas Uptake Water
Induction
System with G3 Exp. Pressure Temperature at IT 60 min from Recovery at R20
Time (IT)
mixture No (MPa) (K) (mol/mol of IT (mol/mol 60 min from (cm3 /min)
(min)
Water) of Water) IT (%)
C1 3 FOR PEER
ChemEngineering 2019, 2.5 REVIEW
274.2 1004.67 0.0164 0.0728 46.28 60.73
Pure Water
C2 2.5 274.2 87.67 0.0042 0.0590 44.99 1.09
C3 2.6 274.2 0.33 Gas Uptake
0.0003 Gas Uptake0.0444
60 Water 36.18 0.78
C4 2.6 274.2 Induction
0.00
3.0 wt% NaClSystem
solution
with Exp. Pressure Temperature at IT 0.0000 min from 0.0607
IT Recovery at49.83 R20 0.88
Time (IT)
G3 mixture C5
No 2.6
(MPa) 274.2
(K) 0.00 (mol/mol0.0000
of (mol/mol 0.0464
of 38.12(cm3/min) 0.84
60 min from
(min)
Water) Water) IT (%)
C1 2.5 274.2 1004.67 0.0164 0.0728 46.28 0.73
Pure Water
3.1. Effect of 10% Propane in Nitrogen Gas Mixture (G1)
C2 2.5 274.2 87.67 0.0042 0.0590 44.99 1.09
C3 2.6 274.2 0.33 0.0003 0.0444 36.18 0.78
3.0 wt% NaCl
C4 2.6 274.2 0.00 0.0000 0.0607 49.83 0.88
Our HyDesal
solution approach is based on our finding that propane as a co-guest can draw dispersed
C5 2.6 274.2 0.00 0.0000 0.0464 38.12 0.84
water present between the interstitial pore spaces between the sand particles towards the gas phase
3.1. Effect of
to form hydrates 10%Capillary
[30]. Propane in Nitrogen Gas Mixture
action plays (G1)
an important role in the migration of water through the
pores of a fixed-bed
Our HyDesal medium.
approachSand grainonsize
is based ourplays
findingan important
that propane as role in capillary
a co-guest can drawaction and hence
dispersed
will havewater present between
a profound effect on thethe
interstitial
kinetics pore
of spaces
hydrate between the sand
formation andparticles
watertowards
recovery.the gas phase the
Therefore,
to form hydrates [30]. Capillary action plays an important role in the migration of water through the
effect of grain size on the kinetics of N2 –C3 H8 hydrate formation was studied. Our previous study
pores of a fixed-bed medium. Sand grain size plays an important role in capillary action and hence
was conducted with sand of particle size 0.21–0.29 mm only [30]. Hence, we chose four different sands
will have a profound effect on the kinetics of hydrate formation and water recovery. Therefore, the
with different particles
effect of grain size size
on for
the this study.
kinetics of NThe particle sizes chosen were 0.1–0.5 mm (medium sand
2–C3H8 hydrate formation was studied. Our previous study
MS1), 0.21–0.29 mm (medium
was conducted with sandsand MS2),size
of particle 0.56–1.3 mm
0.21–0.29 mm (coarse),
only [30].and 1.5–3.0
Hence, mm (granules),
we chose four differentwhich
sands withfor
were investigated different
their particles
effect on size for this formation
hydrate study. The particle
kinetics sizes chosen
and water were 0.1–0.5 mm (medium
recovery.
Withsandthe MS1),
above0.21–0.29
differentmm (medium
sands, sand MS2),
experiments 0.56–1.3
were mm out
carried (coarse), and 1.5–3.0
at 1.5-cm mm (granules),
bed height, 5.0 MPa, and
which were investigated for their effect on hydrate formation kinetics and water recovery.
275.7 K with 10% propane in nitrogen and pure water. A summary of the experimental condition and
With the above different sands, experiments were carried out at 1.5-cm bed height, 5.0 MPa, and
results is 275.7
presented
K with 10%in Table 2. Figure
propane in nitrogen3 shows thewater.
and pure effectAof different
summary particle
of the sizes on
experimental waterand
condition recovery
with 10%results
propane in nitrogen
is presented and
in Table pure water.
2. Figure 3 showsAs thecan beofseen,
effect MS2
different sand sizes
particle of particle
on watersize 0.21–0.297
recovery
mm performed
with 10% better compared
propane in nitrogenwith andthe other
pure sand
water. As particles.
can be seen,Water recovery
MS2 sand of 9.1%
of particle ±2.9%), 44.5%
size (0.21–0.297
(±7.8%), mm1.7% performed
(±0.6%),better
andcompared
4.2% (±1.6%) with the
wasother sand particles.
achieved in 1 hWater
with recovery
MS1, MS2, of 9.1% (±2.9%),
coarse, and44.5%
granules,
(±7.8%), 1.7% (±0.6%), and 4.2% (±1.6%) was achieved in 1 h with MS1, MS2,
respectively. Water recovery within 1 h in the MS2 sand bed was 4.9, 26.2, and 10.6 times higher than coarse, and granules,
respectively. Water recovery within 1 h in the MS2 sand bed was 4.9, 26.2, and 10.6 times higher than
MS1, coarse, and granules, respectively. Hence, MS2 of particle size 0.21–0.297 mm was chosen for
MS1, coarse, and granules, respectively. Hence, MS2 of particle size 0.21–0.297 mm was chosen for
subsequent investigations.
subsequent investigations.
Effect 3.
Figure 3. Figure of Effect
silica of
sand particle
silica size onsize
sand particle water recovery
on water for 10%
recovery propane
for 10% in in
propane nitrogen
nitrogenininpure
purewater.
water.ChemEngineering 2019, 3 FOR PEER REVIEW 7
ChemEngineering 2019, 3, 31 7 of 16
To understand the effect of the 10% propane in nitrogen (G1) gas mixture on the HyDesal process
in aTofixed-bed
understand configuration,
the effect of theexperiments
10% propane were performed
in nitrogen (G1)with pure water
gas mixture on theand 3.0 wt%
HyDesal NaCl
process
insolutions.
a fixed-bed The experimental
configuration, temperature
experiments wereemployed
performed to with
studypure
thewater
effectand
of NaCl
3.0 wt%onNaCl
watersolutions.
recovery
experiments
The experimental withtemperature
pure water employed
and 3.0 wt% NaCl the
to study solution
effect with
of NaClthe on
G1water
gas mixture
recoverywere 274.2 and
experiments
275.5
with K, respectively.
pure water and 3.0 Thewt%experimental
NaCl solutionpressure
with the at
G1thegasstart of the
mixture HyDesal
were process
274.2 and 275.5was 5.0 MPa.
K, respectively.
For experiments
The experimental withatpure
pressure water,
the start the HyDesal
of the average water
process recovery
was 5.0 andMPa.rate of water recovery (R20)
achieved were 44.50%
For experiments (±7.83%)
with and 0.22
pure water, the(±0.00)
averagecmwater
3/s, respectively. Figure 4 shows that the presence
recovery and rate of water recovery (R20 )
of NaCl were
achieved salt drastically reduced
44.50% (±7.83%) the0.22
and average
(±0.00)water 3
cm recovery and rate
/s, respectively. of water
Figure recovery
4 shows (R20presence
that the ) to 0.68%
(±0.79%) and 0.01 (±0.01) cm 3/s, respectively. Thus, it is clear that NaCl salt has a strong kinetic
of NaCl salt drastically reduced the average water recovery and rate of water recovery (R20 ) to 0.68%
(±inhibition
0.79%) and effect
0.01on(±C0.01)
3H8/Ncm 3 /s, respectively.
2 hydrate formation in fixed-bed
Thus, media
it is clear thatand,
NaClhence, the gas
salt has mixture
a strong G1 is
kinetic
not suitable
inhibition foron
effect theCHyDesal
H
3 8 /N 2 process.
hydrate formation in fixed-bed media and, hence, the gas mixture G1 is
not suitable for the HyDesal process.
Figure4.4.Effect
Figure EffectofofNaCl
NaClconcentration
concentrationon
onwater
waterrecovery
recoveryfor
forthe
the10%
10%propane
propaneininnitrogen
nitrogengas
gasmixture.
mixture.
3.2.
3.2.Effect
Effectofof10%
10%Propane
PropaneininArgon
ArgonGas
GasMixture
Mixture(G2)
(G2)
Argon
Argongasgaswaswas
employed as a co-guest
employed gas withgas
as a co-guest propane
with topropane
study thetoeffect
studyof NaCl concentration
the effect of NaCl
on water recovery. The hydrate phase equilibrium data for the 10% propane in argon
concentration on water recovery. The hydrate phase equilibrium data for the 10% propane gas mixture
in were
argon
generated using PVT-analysis-based Multiflash (version 4.4). Experiments were carried
gas mixture were generated using PVT-analysis-based Multiflash (version 4.4). Experiments were out with the
10% propane in argon gas mixture with pure water and 3.0 wt% NaCl at 5.0 and 5.5 MPa and
carried out with the 10% propane in argon gas mixture with pure water and 3.0 wt% NaCl at 5.0 and 274.2 K,
respectively. A summary of the experimental condition and results is presented in Table 2.
5.5 MPa and 274.2 K, respectively. A summary of the experimental condition and results is presented
in Table 2.ChemEngineering 2019, 3, 31 8 of 16
ChemEngineering 2019, 3 FOR PEER REVIEW 8
For experiments
For experiments with
with pure
pure water,
water, thethe averagewater
average waterrecovery
recovery and
and rate
rate of
of water
waterrecovery
recovery(R(R
20)
20 )
achieved were 59.01% (±5.66%) and 0.52 (±0.35) cm3/s,
3 respectively. Figure 5 shows the impact
achieved were 59.01% (±5.66%) and 0.52 (±0.35) cm /s, respectively. Figure 5 shows the impact of of the
addition of salt on water recovery and the rate of hydrate formation. With the increase in salt
the addition of salt on water recovery and the rate of hydrate formation. With the increase in salt
concentration, the average water recovery decreased drastically. Water recovery decreased 51.76
concentration, the average water recovery decreased drastically. Water recovery decreased 51.76 times
times for 3.0 wt% NaCl solution, respectively, when compared with experiments with pure water.
for 3.0 wt% NaCl solution, respectively, when compared with experiments with pure water. For
For experiments with 3.0 wt%, the average water recovery in 1 h was 1.14% (±0.07%).
experiments with 3.0 wt%, the average water recovery in 1 h was 1.14% (±0.07%).
Figure
Figure 5. Effect
5. Effect of NaCl
of NaCl concentration
concentration onon waterrecovery
water recoveryfor
forthe
the 10%
10% propane
propane in
inargon
argongas
gasmixture.
mixture.
Our Our results
results show show
thatthat NaCl
NaCl actsacts
as as a kineticinhibitor
a kinetic inhibitorat
at3.0
3.0 wt%, resulting
resultingininlow
lowwater
water recovery
recovery
compared
compared withwith
purepure water.
water. ThisThis behavior
behavior ofofNaCl
NaClasasan aninhibitor
inhibitor has
has been
been reported
reportedininthetheliterature
literature
for different
for different hydrate-forming
hydrate-forming systems
systems [35–39].InInorder
[35–39]. orderto
toachieve
achieve better
betterwater
waterrecovery,
recovery,there
therewere
were
two steps available: either employ a different co-guest gas with propane or use a kinetic
two steps available: either employ a different co-guest gas with propane or use a kinetic promoter. promoter.
Kinetic promoters are compounds which can enhance the gas uptake rate for hydrate formation
Kinetic promoters are compounds which can enhance the gas uptake rate for hydrate formation
without affecting the thermodynamic phase equilibrium [40]. Surfactants are one such kinetic
without affecting the thermodynamic phase equilibrium [40]. Surfactants are one such kinetic promoter
promoter which change the morphology of the formed hydrate crystals, resulting in better gas-water
which change the morphology of the formed hydrate crystals, resulting in better gas-water contact and
contact and thereby sustaining faster hydrate growth kinetics and better water recovery.
thereby sustaining
In order tofaster hydrate
improve growthofkinetics
the kinetics hydrateand better and
formation water recovery.
water recovery, we investigated the
In order
effect to improve
of SDS on waterthe kinetics
recovery of hydrate
in the presence formation and water
of a NaCl solution recovery,
of 3.0 we investigated
wt% concentration. SDS, anthe
effect of SDS on water recovery in the presence of a NaCl solution of 3.0 wt% concentration. SDS, an
anionic surfactant, is a well-known kinetic promoter, reported to be the best among surfactants in theChemEngineering 2019, 3 FOR PEER REVIEW 9
ChemEngineering 2019, 3, 31 9 of 16
anionic surfactant, is a well-known kinetic promoter, reported to be the best among surfactants in the
literature for different hydrate-forming systems and different reactor configurations. To understand
literature
the effectfor
of different
SDS on the hydrate-forming
kinetics of hydratesystems and different
formation reactor
and water configurations.
recovery, To understand
the concentration of SDS
the effect of SDS on the kinetics of hydrate formation and water recovery,
was varied from 100 to 1000 ppm. The water recovery experiments were carried out with pure water the concentration of SDS
was
andvaried
3.0 wt% fromNaCl100solution
to 1000 atppm.the The water recovery
experimental experiments
conditions given inwereTablecarried
2. The out with pure
summary water
of the SDS
and 3.0 wt% NaCl solution at the
experiments are also presented in Table 2. experimental conditions given in Table 2. The summary of the SDS
experiments
Figure 6are also presented
shows the effect of invarious
Table 2.SDS concentrations on the kinetics of hydrate formation and
waterFigure 6 shows
recovery with the effectpropane
the 10% of various SDS gas
in argon concentrations
mixture in pure on the kinetics
water. of hydrate
This graph shows formation
the water
and water recovery with the 10% propane in argon gas mixture in pure water.
recovered by the hydrate formation process after nucleation and, hence, time zero in the figure This graph shows the
water recovered
corresponds to by
thethe hydratetime.
induction formation process
The figure after the
shows nucleation
averageand, waterhence, time with
recovery zero inthethe figure
standard
corresponds
deviation fortoeverythe induction
5 min. Astime. can beThe figure
seen fromshows the average
the figure, with anwater recovery
increase in SDSwith the standard
concentration, the
deviation for every 5 min. As can be seen from the figure, with an increase in
water recovery increased initially for the first 20 min from IT. At the end of 1 h from IT, the waterSDS concentration, the
water recovery
recovery increased
was almost initially
the same for for the first 20
experiments min
with from IT.
various At the end ofof1SDS
concentrations h from IT, the
in pure water
water and
recovery was almost the same for experiments with various concentrations
the experiment without SDS in pure water. The rate of hydrate formation (R20) for experiments withof SDS in pure water and
the
100,experiment
500, and 1000 without
ppmSDS in pure
of SDS water.water
in pure The rate
was of hydrate
2.1, formation
2.25, and (R20 )higher
2.31 times for experiments
than that of with
the
100, 500, andwithout
experiment 1000 ppm SDSofinSDSpure inwater,
pure water was 2.1,The
respectively. 2.25, and
rate of 2.31 times
hydrate higher than
formation that of the
for experiments
experiment
without SDS, without SDSand
100, 500, in pure
1000water,
ppm ofrespectively.
SDS were The 0.52 rate of hydrate
(±0.35), 1.08 (± formation
0.12), 1.17 for experiments
(±0.05), and 1.20
without
(±0.04) SDS,
cm /s,100,
3 500, and 1000
respectively. ppm of SDS
Experiments were
with 0.52 (±
further (± 0.12), 1.17 (of
0.35), 1.08concentrations
increased ±0.05),
SDS andwere1.20not
(± 0.04) cm 3
carried out/s,since
respectively. Experiments
the improvement inwith further
kinetics increased
were minimalconcentrations
when the SDS of SDS were not carried
concentration was
out since the
increased fromimprovement
500 to 1000inppm.kinetics were minimal when the SDS concentration was increased from
500 to 1000 ppm.
Figure6.6.Effect
Figure Effectofofsodium
sodiumdodecyl
dodecylsulfate
sulfate(SDS)
(SDS)concentration
concentrationon
onwater
waterrecovery
recoveryininpure
purewater
waterwith
with
the
the10%
10%propane
propaneininargon
argongas
gasmixture.
mixture.
Figure
Figure77shows
showsthe theeffect
effectofofvarious
variousSDS
SDSconcentrations
concentrationson onthe
thekinetics
kineticsofofhydrate
hydrateformation
formationand
and
water recovery with the 10% propane in argon gas mixture in 3.0 wt% NaCl solution.
water recovery with the 10% propane in argon gas mixture in 3.0 wt% NaCl solution. The average The average water
recovery increased
water recovery with thewith
increased increase in the concentration
the increase of SDS.of
in the concentration The average
SDS. water recovered
The average at the
water recovered
end of 1end
at the h from
of 1 IT for experiments
h from without without
IT for experiments SDS, 100,SDS,
500, 100,
and 500,
1000and
ppm1000
SDSppm
in 3.0SDS
wt%inNaCl solution
3.0 wt% NaClChemEngineering2019,
ChemEngineering 2019,3,331
FOR PEER REVIEW 10 of 1610
solution was 1.14% (±0.07%), 9.25% (±2.54%), 33.80% (±0.62%), and 36.58% (±0.66%), respectively.
was
Although ±0.07%),
1.14% (the water9.25% (±2.54%),
recovery for the33.80% (±0.62%),
1000 ppm 36.58% (±0.66%),
andexperiment
of SDS at the respectively.
end of 1 h wasAlthough
higher
the water recovery for the 1000 ppm of SDS experiment at the end of 1 h was higher
compared with the 500 ppm of SDS experiment, the initial rate of hydrate formation was slow. compared with
The
the
rate500
of ppm of SDS
hydrate experiment,
formation the
(R20) for initial
100, 500,rate
and of hydrate
1000 ppm of formation was
SDS in 3.0 wt%slow. The
NaCl rate ofwere
solution hydrate
0.23
formation (R20
(±0.07), 0.62 ) for 100,
(±0.10), and500,
0.59and 1000cm
(±0.10) ppm of SDS in 3.0 wt% NaCl solution were 0.23 (±0.07), 0.62
3/s, respectively.
(±0.10), and 0.59 (±0.10) cm3 /s, respectively.
Figure7.7.Effect
Figure of of
Effect SDS concentration
SDS on water
concentration recovery
on water in 3.0 wt%
recovery in 3.0NaCl
wt%solution with the with
NaCl solution 10% propane
the 10%
inpropane
argon gas mixture.
in argon gas mixture.
Kinetic
Kineticexperiments
experimentswith withthe the10%
10%propane
propaneininargon
argongas gasmixture
mixtureshow showthat
thatNaCl
NaClacts
actsasasaakinetic
kinetic
inhibitor,
inhibitor, resulting in low water recovery. The addition of SDS, a kinetic promoter,improves
resulting in low water recovery. The addition of SDS, a kinetic promoter, improvesthe the
water recovery and rate of hydrate formation. SDS present in the solution may
water recovery and rate of hydrate formation. SDS present in the solution may be adsorbed onto the be adsorbed onto
the hydrate
hydrate crystals.
crystals. Hence,
Hence, afterremoval
after removalofofhydrate
hydratecrystals
crystals andand dissociation,
dissociation, thethe produced
producedwater water
samples
samplesneed
needtotobebetested
testedforfor
thethe
presence of of
presence SDS andand
SDS its quantity.
its quantity.If present, it needs
If present, to betoremoved
it needs be removedvia
avia
secondary treatment step, since surfactants such as SDS are known to significantly
a secondary treatment step, since surfactants such as SDS are known to significantly contribute contribute to the
toxicity of some of
to the toxicity effluents and are harmful
some effluents and are to humans,
harmful to marine
humans, life, and the
marine environment.
life, It would beIt
and the environment.
desirable
would betodesirable
identify suitable eco-friendly
to identify suitable kinetic promoters
eco-friendly such
kinetic as aminosuch
promoters acidsas[41–43],
amino starch
acids [44,45],
[41–43],
biosurfactants [46], or a different co-guest gas with propane in the future for
starch [44,45], biosurfactants [46], or a different co-guest gas with propane in the future the HyDesal process.
for the
HyDesal process.
3.3. Effect of 10% Propane in Carbon Dioxide Gas Mixture (G3)
3.3. It
Effect of 10%
has been Propaneearlier
reported in Carbon
that Dioxide Gas Mixture
the presence of salts (G3)
in porous media has no impact on the kinetics
of CO2 gas hydrate formation [47]. Hence, propane in a carbon dioxide gas mixture was employed in
It has been reported earlier that the presence of salts in porous media has no impact on the
this study. The experimental conditions employed in this study with pure water and 3.0 wt% NaCl
kinetics of CO2 gas hydrate formation [47]. Hence, propane in a carbon dioxide gas mixture was
solution with the 10% propane in carbon dioxide gas mixture were 274.2 K and 2.5 MPa, and 274.2 K
employed in this study. The experimental conditions employed in this study with pure water and 3.0
and 2.6 MPa, respectively. A summary of the experimental condition and results is presented in Table 2.
wt% NaCl solution with the 10% propane in carbon dioxide gas mixture were 274.2 K and 2.5 MPa,
Figure 8 shows the effect of salt on water recovery with the 10% propane in carbon dioxide gas
and 274.2 K and 2.6 MPa, respectively. A summary of the experimental condition and results is
mixture. In pure water, the average water recovery and rate of hydrate formation (R20 ) achieved were
presented in Table 2.ChemEngineering 2019, 3 FOR PEER REVIEW 11
ChemEngineering 2019, 3, 31 11 of 16
Figure 8 shows the effect of salt on water recovery with the 10% propane in carbon dioxide gas
mixture. In pure water, the average water recovery and rate of hydrate formation (R20) achieved were
45.63%
45.63% (±0.91%)
(±0.91%) andand
0.910.91 (±0.25)
(±0.25) cm cm 3/s. In the presence of 3.0 wt% NaCl, the average water recovery
3 /s. In the presence of 3.0 wt% NaCl, the average water recovery
and of
and rate rate of hydrate
hydrate formation
formation (R20(R 20) achieved were 41.38% (±7.39%) and 0.83 (±0.05) cm3/s.
) achieved were 41.38% (±7.39%) and 0.83 (±0.05) cm3 /s. Water
Water
recovery only reduced by 10% in the presence of NaCl salt, suggesting reduced or no kinetic
recovery only reduced by 10% in the presence of NaCl salt, suggesting reduced or no kinetic inhibition
inhibition effect on hydrate formation and water recovery.
effect on hydrate formation and water recovery.
Figure
Figure 8. Effect
8. Effect of NaCl
of NaCl concentration
concentration ononwater
waterrecovery
recoveryfor
for 10%
10% propane
propane in
incarbon
carbondioxide.
dioxide.
A comparison
A comparison of water
of water recovery
recovery from
from 3.03.0wt%
wt%NaCl
NaClsolution
solution with G1,
G1,G2,
G2,and
andG3G3gas
gasmixtures
mixtures
is presented in Figure 9. Water recovery with the C H /CO gas mixture
is presented in Figure 9. Water recovery with the C3 H8 /CO2 gas mixture in 1 h was 60 and
3 8 2 in 1 h was 60 and 36.39 times
36.39
faster compared with C H /N and C H /Ar, respectively. The 10% propane
times faster compared with C3 H8 /N2 and C3 H8 /Ar, respectively. The 10% propane in carbon dioxide
3 8 2 3 8 in carbon dioxide gas
mixture showed
gas mixture showed the the highest
highest waterwater recovery
recovery of of 41.38%
41.38% (±7.39%).
(±7.39%).Similarly,
Similarly,thethe
rate
rateofofhydrate
hydrate
formation (R20) from 3.0 wt% NaCl solution for the G3 gas mixture was 83 and 41.5 times that of the
formation (R20 ) from 3.0 wt% NaCl solution for the G3 gas mixture was 83 and 41.5 times that of
G1 and G2 gas mixtures, respectively. The G1, G2, and G3 gas mixtures had an average rate of hydrate
the G1 and G2 gas mixtures, respectively. The G1, G2, and G33 gas mixtures had an average rate of
formation (R20) of 0.01 (±0.01), 0.02 (±0.00), and 0.86 (±0.03) cm /min, respectively. From experiments
hydrate formation (R20 ) of 0.01 (±0.01), 0.02 (±0.00), and 0.86 (±0.03) cm3 /min, respectively. From
conducted with pure water and 3 wt% NaCl solution with different gas mixtures, it is clear that
experiments conducted with pure water and 3 wt% NaCl solution with different gas mixtures, it is
propane in carbon dioxide yielded higher water recovery compared with the other gas mixtures
clearemployed.
that propane in propane/carbon
Hence, carbon dioxidedioxide yieldedwas higher
chosenwater
as therecovery
preferredcompared
gas mixture.with the other gas
mixtures employed. Hence, propane/carbon dioxide was chosen as the preferred gas mixture.ChemEngineering 2019, 3 FOR PEER REVIEW 12
ChemEngineering 2019, 3, 31 12 of 16
Figure 9. Comparison
Figure of water
9. Comparison recovery
of water with different
recovery gas mixtures
with different and 3.0 and
gas mixtures wt%3.0
NaCl aqueous
wt% NaCl solution.
aqueous
solution.
Further studies were carried out to optimize the concentration of propane in carbon dioxide
to maximize
Furtherwater
studies recovery from salt
were carried water.
out to In this
optimize thestudy, four different
concentration propane
of propane concentrations
in carbon dioxide to
inmaximize
carbon dioxide
water were employed,
recovery from salt namely,
water.2.5%, 5%,study,
In this 10%, and
four20%. Experiments
different propane were carried outin
concentrations
atcarbon
a constant temperature
dioxide of 274.2namely,
were employed, K and a2.5%,
driving 10%, ∆P
5%,force andof20%.
1.97Experiments
MPa with the gas carried
were mixtureout with
at a
different concentrations of propane and 3 wt% NaCl solution. Experimental
constant temperature of 274.2 K and a driving force ΔP of 1.97 MPa with the gas mixture with conditions employed
for this investigation,
different concentrations suchofaspropane
the composition
and 3 wt% ofNaCl
the gas mixture,
solution. pressure, temperature,
Experimental and results,
conditions employed for
are presented in Table 3. Multiple experiments with 2.5% propane in carbon dioxide
this investigation, such as the composition of the gas mixture, pressure, temperature, and results, are gas did not
nucleate
presentedforin
several
Table days. Figureexperiments
3. Multiple 10 shows the witheffect ofpropane
2.5% varying inconcentrations
carbon dioxide of gas
propane in nucleate
did not carbon
dioxide on water recovery from 3.0 wt% NaCl solution. Water recovery with 3.0
for several days. Figure 10 shows the effect of varying concentrations of propane in carbon dioxide wt% NaCl solution
increased
on wateras the propane
recovery from concentration increasedWater
3.0 wt% NaCl solution. from 5% to 10%.
recovery However,
with 3.0 wt%water
NaClrecovery
solution reduced
increased
when
as thethe concentration
propane of propane
concentration was further
increased from 5% increased
to 10%.to 20%. Hence,
However, water werecovery
did not reduced
study thewhen
higherthe
concentration of propane gas mixtures with carbon dioxide. Water recovery
concentration of propane was further increased to 20%. Hence, we did not study the higher with 10% propane in
carbon dioxide was
concentration about two
of propane gastimes higher
mixtures thancarbon
with water dioxide.
recovery Water
with 5% and 20%
recovery propane
with in carbonin
10% propane
dioxide
carbongas mixtures.
dioxide Figuretwo
was about 10 shows
times that
higherwater
than recovery with 3.0 with
water recovery wt% NaCl
5% andsolution obtained
20% propane inin this
carbon
study was 21.06% ( ± 4.34%), 41.38% ( ± 7.39%), and 21.89% ( ±
dioxide gas mixtures. Figure 10 shows that water recovery with 3.0 wt% NaCl solution obtainedinin
4.13%) for 5%, 10%, and 20% propane
carbon dioxide,
this study wasrespectively.
21.06% (±4.34%), Also,41.38%
10% propane
(±7.39%),in carbon dioxide
and 21.89% showed
(±4.13%) forthe
5%,highest
10%, andrate20%
of hydrate
propaneChemEngineering 2019, 3 FOR PEER REVIEW 13
in carbon dioxide,
ChemEngineering 2019, 3, 31respectively.
Also, 10% propane in carbon dioxide showed the highest 13 rate
of 16of
hydrate formation (R20). Hence, 10% propane in carbon dioxide was chosen as the hydrate for further
studies of the HyDesal process.
formation (R20 ). Hence, 10% propane in carbon dioxide was chosen as the hydrate for further studies
of the Table
HyDesal process.of experimental conditions and results with different concentrations of propane in
3. Summary
carbon dioxide.
Table 3. Summary of experimental conditions and results with different concentrations of propane in
System Gas Water
carbon dioxide. Gas Uptake
with (%) Induction Uptake at Recovery
Exp. Pressure Temperature 60 min from R20
Propane in Time (IT) IT at 60 min
System with No (MPa) (K) Gas Uptake
IT (mol/mol Water (cm3/min)
Induction Gas (mol/mol
Uptake at
(%)Carbon
Propane Exp. Pressure Temperature (min) 60of
min from
Water)
from ITat
Recovery R20
Time (IT) IT (mol/mol
Dioxide
in Carbon No (MPa) (K) of Water) IT (mol/mol 60 min(%)from (cm3 /min)
(min) of Water)
Dioxide
5 C6 2.85 274.2 85.00 0.0064 of 0.0391
Water) IT (%)
24.13 0.54
55 C7
C6 2.85
2.85 274.2
274.2 1042.00
85.00 0.0147
0.0064 0.0391
0.0391 18
24.13 0.39
0.54
5
20 C7
C8 2.85
2.0 274.2
274.2 1042.00
2171.00 0.0147
0.0142 0.0391
0.0359 18
18.97 0.39
0.29
20
20 C8
C9 2.0
2.0 274.2
274.2 2171.00
105.67 0.0142
0.0051 0.0359
0.0335 18.97
24.82 0.29
0.39
20 C9 2.0 274.2 105.67 0.0051 0.0335 24.82 0.39
Figure 10.Effect
Figure10. Effectofofpropane
propanecomposition
compositioninincarbon
carbondioxide
dioxidewith
with3.0
3.0wt%
wt%NaCl
NaClaqueous
aqueoussolution.
solution.
4.5.Conclusions
Conclusions
Water
Waterisisa akey
keyresource
resourcefor
forsustainable
sustainabledevelopment
developmentand
andplays
playsa acrucial
crucialrole
roleininhuman
human
development. Desalination is one of the most promising technologies to mitigate the emerging
development. Desalination is one of the most promising technologies to mitigate the emerging water
water crisis. MSF and reverse osmosis are two of the most widely employed desalination technologiesChemEngineering 2019, 3, 31 14 of 16
in the world; however, they are energy intensive. HyDesal is a potential energy-efficient desalination
technology that could strengthen the energy–water nexus. In this study, we evaluated the effect of
10% propane in three different gas mixtures as hydrate formers for the HyDesal process based on
the fixed-bed approach. With the 10% propane in nitrogen and 10% propane in argon gas mixtures,
the water recovery achieved was very low (~2%) in the presence of 3 wt% NaCl in the solution.
To improve the water recovery and kinetics of hydrate formation, SDS, a kinetic promoter, was added
and its effect was evaluated at different concentrations in the 10% propane in argon gas mixture.
The addition of SDS improved the kinetics and water recovery significantly. With the 10% propane in
carbon dioxide gas mixture, the reduction in water recovery due to the presence of salt was found to
be less than 10%. Hence, the 10% propane in carbon dioxide gas mixture is suitable for the HyDesal
process. However, further studies to evaluate the salt rejection rate and process scalability need to
be carried out. The current experimental setup used in this study does not have any provision to
extract the hydrate crystals. We are currently developing a new system that will enable us to extract
the produced water to be characterized for composition analysis and subjected to post-treatment for
the removal of surfactants.
Author Contributions: A.N. and B.P. together conceived, designed, and performed experiments and wrote
the manuscript under the supervision of P.L. All authors contributed to discussions and the production of
the manuscript.
Funding: The work was funded in part under the Energy Innovation Research Programme (EIRP, Award No.
NRF2014EWTEIRP003-006), administrated by the Energy Market Authority (EMA).
Acknowledgments: The work was funded in part under the Energy Innovation Research Programme (EIRP,
Award No. NRF2014EWTEIRP003-006), administrated by the Energy Market Authority (EMA). The EIRP is a
competitive grant call initiative driven by the Energy Innovation Programme Office and funded by the National
Research Foundation (NRF). The authors would like to acknowledge funding support from our industrial
collaborator, Shell Energy Singapore.
Conflicts of Interest: The authors declare no conflicts of interest.
References
1. Water, U.N. Coping with Water Scarcity: Challenge of the Twenty-First Century; Prepared for World Water Day;
World Health Organization: Geneva, Switzerland, 2007.
2. Montgomery, M.A.; Elimelech, M. Water And Sanitation in Developing Countries: Including Health in the
Equation. Environ. Sci. Technol. 2007, 41, 17–24. [CrossRef] [PubMed]
3. Feeley, T.J., III; Skone, T.J.; Stiegel, G.J., Jr.; McNemar, A.; Nemeth, M.; Schimmoller, B.; Murphy, J.T.;
Manfredo, L. Water: A critical resource in the thermoelectric power industry. Energy 2008, 33, 1–11. [CrossRef]
4. Postel, S.; Bawa, K.; Kaufman, L.; Peterson, C.H.; Carpenter, S.; Tillman, D.; Dayton, P.; Alexander, S.;
Lagerquist, K.; Goulder, L. Nature’s Services: Societal Dependence on Natural Ecosystems; Island Press:
Washington, DC, USA, 2012.
5. Marchal, V.; Dellink, R.; van Vuuren, D.; Clapp, C.; Château, J.; Lanzi, E.; Magné, B.; van Vliet, J. OECD
Environmental Outlook to 2050: The Consequences of Inaction; OECD: Paris, France, 2012.
6. Greenlee, L.F.; Lawler, D.F.; Freeman, B.D.; Marrot, B.; Moulin, P. Reverse osmosis desalination: Water
sources, technology, and today’s challenges. Water Res. 2009, 43, 2317–2348. [CrossRef]
7. Khawaji, A.D.; Kutubkhanah, I.K.; Wie, J.-M. Advances in seawater desalination technologies. Desalination
2008, 221, 47–69. [CrossRef]
8. Al-Sahali, M.; Ettouney, H. Developments in thermal desalination processes: Design, energy, and costing
aspects. Desalination 2007, 214, 227–240. [CrossRef]
9. Drewes, J.E.; Cath, T.Y.; Xu, P.; Graydon, J.; Veil, J.; Snyder, S. An Integrated Framework for Treatment and
Management of Produced Water; RPSEA Project; National Energy Technology Laboratory: Pittsburgh, PA, USA,
2009; p. 07122.
10. Igunnu, E.T.; Chen, G.Z. Produced water treatment technologies. Int. J. Low-Carbon Technol. 2012, cts049.
[CrossRef]ChemEngineering 2019, 3, 31 15 of 16
11. Shannon, M.A.; Bohn, P.W.; Elimelech, M.; Georgiadis, J.G.; Marinas, B.J.; Mayes, A.M. Science and
technology for water purification in the coming decades. Nature 2008, 452, 301–310. [CrossRef] [PubMed]
12. Escobar, I.C. Chapter 14 Conclusion: A Summary of Challenges still Facing Desalination and Water Reuse. In
Sustainability Science and Engineering; Isabel, C.E., Andrea, I.S., Eds.; Elsevier: Amsterdam, The Netherlands,
2010; Volume 2, pp. 389–397.
13. Subramani, A.; Jacangelo, J.G. Emerging desalination technologies for water treatment: A critical review.
Water Res. 2015, 75, 164–187. [CrossRef] [PubMed]
14. Raluy, R.G.; Serra, L.; Uche, J. Life cycle assessment of desalination technologies integrated with renewable
energies. Desalination 2005, 183, 81–93. [CrossRef]
15. Babu, P.; Linga, P.; Kumar, R.; Englezos, P. A review of the hydrate based gas separation (HBGS) process for
carbon dioxide pre-combustion capture. Energy 2015, 85, 261–279. [CrossRef]
16. Chong, Z.R.; Yang, S.H.B.; Babu, P.; Linga, P.; Li, X.-S. Review of natural gas hydrates as an energy resource:
Prospects and challenges. Appl. Energy 2016, 162, 1633–1652. [CrossRef]
17. Englezos, P. Clathrate hydrates. Ind. Eng. Chem. Res. 1993, 32, 1251–1274. [CrossRef]
18. Veluswamy, H.P.; Kumar, A.; Seo, Y.; Lee, J.D.; Linga, P. A review of solidified natural gas (SNG) technology
for gas storage via clathrate hydrates. Appl. Energy 2018, 216, 262–285. [CrossRef]
19. Eslamimanesh, A.; Mohammadi, A.H.; Richon, D.; Naidoo, P.; Ramjugernath, D. Application of gas hydrate
formation in separation processes: A review of experimental studies. J. Chem. Thermodyn. 2012, 46, 62–71.
[CrossRef]
20. Sum, A.K.; Koh, C.A.; Sloan, E.D. Clathrate hydrates: From laboratory science to engineering practice. Ind.
Eng. Chem. Res. 2009, 48, 7457–7465. [CrossRef]
21. Ogawa, T.; Ito, T.; Watanabe, K.; Tahara, K.I.; Hiraoka, R.; Ochiai, J.I.; Ohmura, R.; Mori, Y.H. Development of
a novel hydrate-based refrigeration system: A preliminary overview. Appl. Therm. Eng. 2006, 26, 2157–2167.
[CrossRef]
22. Babu, P.; Kumar, R.; Linga, P. Pre-combustion capture of carbon dioxide in a fixed bed reactor using the
clathrate hydrate process. Energy 2013, 50, 364–373. [CrossRef]
23. McCormack, R.; Niblock, G. Build and Operate a Clathrate Desalination Pilot Plant; US Bureau of Reclamation
Water Treatment Technology Program Report; US Bureau of Reclamation: Denver, CO, USA, 1998.
24. McCormack, R.A.; Niblock, G.A. Investigation of High Freezing Temperature, Zero Ozone, and Zero Global
Warming Potential, Clathrate Formers for Desalination; US Department of the Interior, Bureau of Reclamation,
Technical Service Center, Water Treatment Engineering and Research Group: Burlington, MA, USA, 2000.
25. Bradshaw, R.W.; Greathouse, J.A.; Cygan, R.T.; Simmons, B.A.; Dedrick, D.E.; Majzoub, E.H. Desalination
Utilizing Clathrate Hydrates (LDRD Final Report); Digital Library: New York, NY, USA, 2008.
26. Solomon, S.; Qin, D.; Manning, M.; Chen, Z.; Marquis, M.; Averyt, K.B.; Tignor, M.; Miller, H.L. Contribution
of Working Group I to the Fourth Assessment Report of the Intergovernmental Panel on Climate Change; IPCC: Paris,
France, 2007.
27. Mccormack, R.; Ripmeester, J. Clathrate Desalination Process Using an Ultrasonic Actuator. WO Patent
2,013,049,253, 4 April 2013.
28. Zheng, J.; Zhang, B.-Y.; Wu, Q.; Linga, P. Kinetic Evaluation of Cyclopentane as a Promoter for CO2 Capture
via a Clathrate Process Employing Different Contact Modes. ACS Sustain. Chem. Eng. 2018, 6, 11913–11921.
[CrossRef]
29. Babu, P.; Nambiar, A.; He, T.; Karimi, I.A.; Lee, J.D.; Englezos, P.; Linga, P. A Review of Clathrate Hydrate
Based Desalination to Strengthen Energy–Water Nexus. ACS Sustain. Chem. Eng. 2018, 6, 8093–8107.
[CrossRef]
30. Babu, P.; Kumar, R.; Linga, P. Unusual behavior of propane as a co-guest during hydrate formation in silica
sand: Potential application to seawater desalination and carbon dioxide capture. Chem. Eng. Sci. 2014, 117,
342–351. [CrossRef]
31. He, T.; Nair, S.K.; Babu, P.; Linga, P.; Karimi, I.A. A Novel Conceptual Design of Hydrate Based Desalination
(HyDesal) Process by Utilizing LNG Cold Energy. Appl. Energy 2018, 222, 13–24. [CrossRef]
32. Zheng, J.; Lee, Y.K.; Babu, P.; Zhang, P.; Linga, P. Impact of fixed bed reactor orientation, liquid saturation,
bed volume and temperature on the clathrate hydrate process for pre-combustion carbon capture. J. Nat. Gas
Sci. Eng. 2016, 35, 1499–1510. [CrossRef]You can also read


