Chemical Science - Royal Society of ...
←
→
Page content transcription
If your browser does not render page correctly, please read the page content below
View Article Online

Chemical
 View Journal

Science
Accepted Manuscript

 This article can be cited before page numbers have been issued, to do this please use: H. Gao, P. Wu, P.
 Song, B. Kang, H. Chen and J. Xu, Chem. Sci., 2021, DOI: 10.1039/D0SC04764C.
 Volume 9
 Number 1
 This is an Accepted Manuscript, which has been through the
 Chemical
 7 January 2018
 Pages 1-268
 Royal Society of Chemistry peer review process and has been
 accepted for publication.
 Science Accepted Manuscripts are published online shortly after acceptance,
 rsc.li/chemical-science

 before technical editing, formatting and proof reading. Using this free
 service, authors can make their results available to the community, in
 citable form, before we publish the edited article. We will replace this
 Accepted Manuscript with the edited and formatted Advance Article as
 soon as it is available.

 You can find more information about Accepted Manuscripts in the
 Information for Authors.

 Please note that technical editing may introduce minor changes to the
 text and/or graphics, which may alter content. The journal’s standard
 ISSN 2041-6539 Terms & Conditions and the Ethical guidelines still apply. In no event
 EDGE ARTICLE
 Xinjing Tang et al.
 Caged circular siRNAs for photomodulation of gene
 shall the Royal Society of Chemistry be held responsible for any errors
 expression in cells and mice

 or omissions in this Accepted Manuscript or any consequences arising
 from the use of any information it contains.

 rsc.li/chemical-science
Page 1 of 10 PleaseChemical
 do not adjust margins
 Science

 View Article Online

 Chemical Science DOI: 10.1039/D0SC04764C

 ARTICLE
 This article is licensed under a Creative Commons Attribution-NonCommercial 3.0 Unported Licence.

 Received 00th January 20xx, Video-rate imaging of sub-10 nm plasmonic nanoparticles in

 Chemical Science Accepted Manuscript
 cellular medium free of background scattering
Open Access Article. Published on 04 January 2021. Downloaded on 1/12/2021 12:01:29 PM.

 He Gao, a Pei Wu,a Pei Song,a Bin Kang,*a Jing-Juan Xu*a and Hong-Yuan Chena
 Accepted 00th January 20xx
 Plasmonic nanoparticles (e.g gold, silver) have attracted extensive attentions in biological sensing and imaging as
 DOI: 10.1039/x0xx00000x promising nanoprobes. Practical biomedical applications demand small gold nanoparticles with comparable size to
 quantum dots and fluorescent proteins. While too small nanoparticles with size below Rayleigh limit (usually
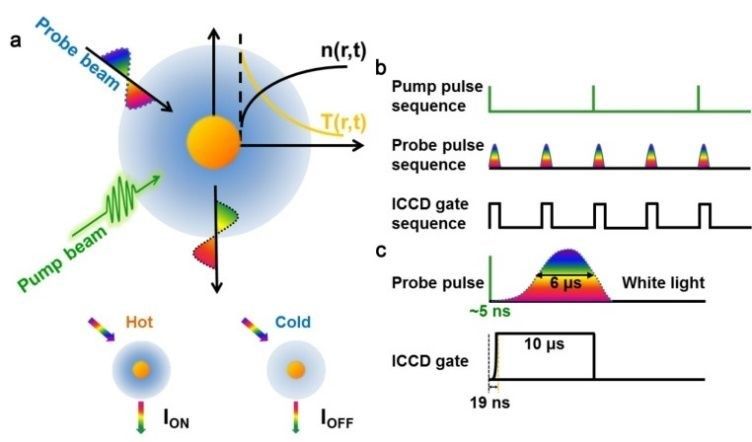
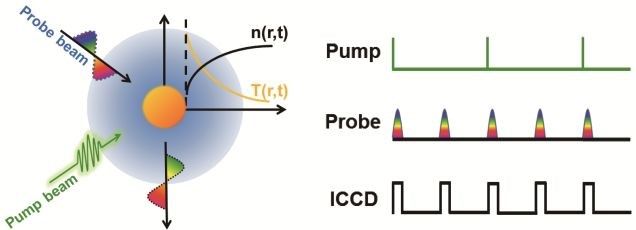
PleaseChemical
 do not adjust margins
 Science Page 2 of 10

 ARTICLE Journal Name

 nm) since the scattering cross-section of nanoparticles scale down promote the study of using small gold nanoparticlesView
 as Article
 biological
 Online
 with six power of their size.23, 24 Worse, cellular medium is a probes for dynamic optical tracking of biological process within
 DOI: 10.1039/D0SC04764C
 heterogeneous environment with many strong scattering organelles, living cells.
 resulting in a strong scattering background. The weak scattering
 signal, in somewhat, could be compensated by using a more
 sensitive camera. However, the scattering background from cellular Results and discussion
 components is hard to fully eliminate since the Rayleigh scattering
 from subcellular components usually have a wide spectra. Even
 This article is licensed under a Creative Commons Attribution-NonCommercial 3.0 Unported Licence.

 some background scavenging reagents, background smoothing
 algorithms, etc., have been tried to reduce the intracellular
 scattering background, however, such problem has not been fully

 Chemical Science Accepted Manuscript
 solved.25-28
 To detect small plasmonic nanoparticles, several types of
 photothermal imaging methods were developed based on
Open Access Article. Published on 04 January 2021. Downloaded on 1/12/2021 12:01:29 PM.

 plasmonic resonance absorption instead of scattering, since the
 absorption cross section of nanoparticles scales down with three
 power of particle size (slower than scattering). Laser scanning
 photothermal imaging is able to detect nanoparticles down to a few
 nanometers, and enable high resolution imaging of cellular
 structure. In this type of imaging, the photothermal signals, defined
 by the relative change of probe beam with and without heat beam, Figure 1. Scheme of the absorption modulating scattering
 still scale down with absorption cross-section.29-31 Thus small microscopy (AMSM). (a) Principle of pump-probe imaging of a
 nanoparticles below 10 nm demand a tightly focused and high single gold nanoparticle. (b) Time sequence of pump pulse (20 Hz),
 frequency modulated heat beam and a lock-in amplifier to extract probe pulse and camera gate (40 Hz). (c) Schematic diagram of
 the weak photothermal signal.32 For imaging of living cells, such working time window of probe pulse and camera gate in one time
 strong and focused laser beam might cause irreversible cell period of imaging.
 damage.33 Also, this type of laser scanning based imaging method
 usually needs minutes to hours to obtain a frame of image, which
 The absorption modulating scattering microscopy (AMSM) is based
 seems too slow for living cell imaging since many dynamic biological
 on a pump-probe detection technique,39 which is realized by using a
 events occurs in seconds or even faster. Besides laser scanning
 self-built setup (Figure 1 and Figure S1, Supporting Information). A
 photothermal imaging method, photothermal imaging could also be
 532 nm pulse laser (~5 ns) was used as pump beam to heat the gold
 realized based on surface plasmon resonance (SPR). 34SPR imaging
 nanoparticles, and pulsed white light (~6 µs) was used as probe
 enable to detect photothermal signal with very fast speed, however,
 beam to detect the scattering light signal from gold nanoparticles
 it seems hardly to image nanoparticles inside of cells since the SPR
 (Figure 1a, Figure S2). Without pump beam, temperature of the
 effect highly relies on the interface of gold film.35 Recently, there
 liquid medium around gold nanoparticles is uniform and the
 are also some new photothermal imaging methods, like widefield
 intensity of scattering light is defined as IOFF. Once the nanoparticle
 photothermal sensing (WPS), which aimed to break the obstacle of
 is irradiated by pump beam, it would be heated to a ‘hot’ state in
 imaging speed36. Such photothermal method is still based on the
 hundreds picoseconds through photon-phonon interaction.40-42
 absorption characteristics of the objects. Beside absorption-based
 After a very short time (~ns), the nanoparticle transfers a part of
 principle, interferometric optical detection can also be used to
 heat to the surrounding medium, which resulting in a localized
 image 2-5 nm gold nanoparticles based on their scattering
 thermal field in the medium. As refractive index of the medium
 properties.37 In cells, it usually requires larger nanoparticles to
 depends on temperature, a local refractive index change is formed
 achieve a good image quality because the cellular enviroment
 in the medium surrounding the nanoparticles, which is often called
 contains a lot of scattering objects and contribute a strong
 “nano-thermal lens”.31, 32 Assisted by the effect of nano-lens, more
 scattering background. 38
 light scattered from gold nanoparticles was captured by the imaging
 Here, we demonstrated a method, named absorption modulated
 unit. Under this condition, the scattering light intensity is defined as
 scattering microscopy (AMSM). This AMSM imaging method applied
 ION. Hence, absorption modulated scattering signal Ф was defined
 both the resonance absorption and scattering properties of
 as Ф = (ION − IOFF)/ IOFF, which represented the change of the
 plasmonic nanoparticles, rather than each of single effect. Thus the
 scattering light of nanoparticles caused by absorption of pump
 AMSM method exhibited a remarkable ability on removal of
 energy. After stopping pump, the nanoparticle is cooling down and
 scattering background. Compared to regular dark-field microscopy
 the “nano-thermal lens” disappeared in about a few microsecond.43
 that typically can only detect 30-50 nm gold nanoparticles, our
 Then the system returns to the initial state without pump and the
 AMSM method was able to detect much smaller nanoparticles with
 scattering light intensity return back to IOFF until next time of heat.
 size down to ~9 nm. Moreover, the imaging speed of AMSM
 To achieve video rate imaging, time sequence control was
 method is much faster than regular laser-scanning photothermal
 introduced in above system. The pump laser worked at 20 Hz and a
 microscopy, thereby allows for real-time video rate (20 fps) imaging
 delay generator was used to synchronize frequency and generate a
 of sub-10 nm nanoparticles in living cells. This AMSM method might

 2 | Chem. Sci., 2019, 00, 1-3 This journal is © The Royal Society of Chemistry 20xx

 Please do not adjust margins
Page 3 of 10 PleaseChemical do not adjust margins Science Journal Name ARTICLE transistor-transistor logic (TTL) signal sequence with 40 Hz, which View Article Online acted on the probe beam source and imaging module (Intensified DOI: 10.1039/D0SC04764C Camera, ICCD) to collect the scattering light signal (Figure 1b). The time interval of probe sequences was 25 ms, in one cycle of pump, Where C is a constant, ∂ /∂ is the rate of refractive index (n) the scattering intensity was recoded as ION, and 25 ms later, the changes with temperature, P is the power of pump beam, ρAu and scattering intensity was recorded as IOFF after the nanoparticle was cAu are the density and specific heat of nanoparticles. Following this fully cooled. By subtracting IOFF from ION in chronological order, formula, Φ is closely related to many factors, but not absorption absorption modulated scattering signal Ф varying with time would and scattering cross sections of the nanoparticles (see Supporting This article is licensed under a Creative Commons Attribution-NonCommercial 3.0 Unported Licence. be obtained. As illustrated in Figure 1c, about 6 μs was needed for Information for details). According to Mie theory, the scattering probe beam (pulse xenon lamp) to reach the maximum brightness cross sections decreases sharply with reduce of particle size, so that and the half-width of time duration was about 6 μs as well. Thus, the traditional dark field microcopy is failed to detect too small Chemical Science Accepted Manuscript the ICCD gate time was set to a duration of 10 μs to ensure nanoparticles. Fortunately, the Φ signal of our AMSM, in theory, is capturing most of the scattering light (Figure. 1c) with a very short independent on the nanoparticle size, which makes it possible to start time of 19 ns. detect very small nanoparticles. Notable that even Φ does not Open Access Article. Published on 04 January 2021. Downloaded on 1/12/2021 12:01:29 PM. As mentioned above, the signal Ф originates from the change of depend on particle size in principle, the practical imaging still suffer refractive index in the medium surrounding the gold nanoparticles a particle size limit because of the limitation of laser power and caused by light absorption. Thus, the Φ signal value can be sensitivity of camera. ultimately expressed as (see Supporting Information for details):44, 45 n P C T AucAu (1) This journal is © The Royal Society of Chemistry 20xx Chem. Sci., 2019, 00, 1-3 | 3 Please do not adjust margins
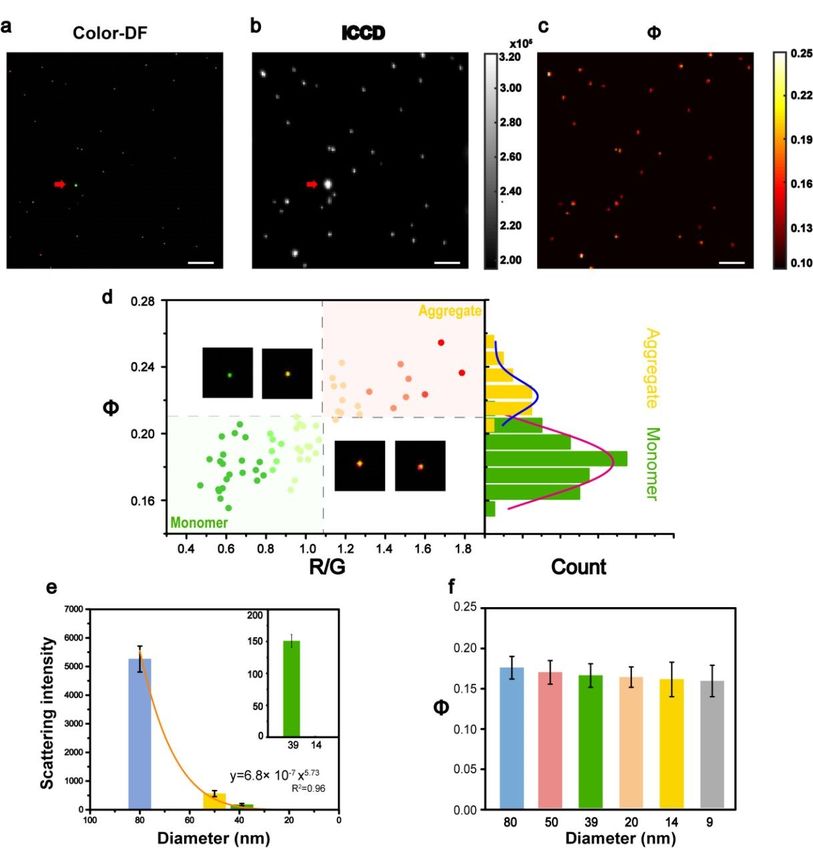
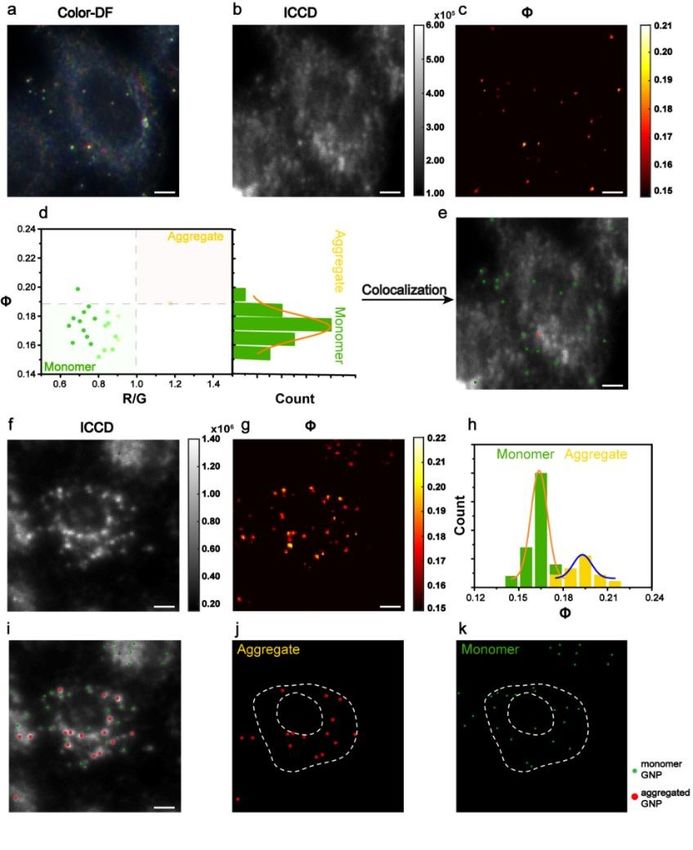
PleaseChemical
 do not adjust margins
 Science Page 4 of 10

 ARTICLE Journal Name

 Figure 2. Colocalization imaging analysis of 80 nm gold nanoparticles (a) color dark field image, (b) ICCD image, and (c) Φ signal image of
 View Article Online
 nanoparticles in glass substrate. (scale bars: 10 μm). (d) Scatter plot of the Φ values versus R/G values of each nanoparticle and statistical
 DOI: 10.1039/D0SC04764C
 histograms of the Φ distribution of monomeric (green) and aggregated (yellow) particles. (e) Scattering light intensity and (f) Φ signal
 intensity of different size nanoparticles. Red arrow in (a) (b) indicates a dust particle.

 The feasibility of this imaging method was demonstrated firstly in objects must be considered, especially in complex environment like
 vitro (Figure 2). Gold nanoparticles coated with polyethylene glycol cells. Therefore, we then investigated the capability of our AMSM
 This article is licensed under a Creative Commons Attribution-NonCommercial 3.0 Unported Licence.

 (Au-PEG) with size of 80 nm was immerged into glycerol medium to method on eliminating such strong scattering background signals,
 simulate the environment of cytoplasm with similar refractive index. using dust and polystyrene sphere particles as models (Figure S3).
 Figure 2a showed an example of raw image captured by ICCD, and As expected, since the absorption characteristics of dust or

 Chemical Science Accepted Manuscript
 its corresponding Ф signal image was shown in figure 2b. All the polystyrene sphere particles are significantly different to gold
 gold nanoparticles in figure 2a were recognized in figure 2b except nanoparticles, then they could not be heated by the pump laser and
 of the super bright dust particle. Dust particles have a much larger thereby cannot be detected in final AMSM image. These results
Open Access Article. Published on 04 January 2021. Downloaded on 1/12/2021 12:01:29 PM.

 size (in micrometer scale) and a huge scattering cross section, thus suggested the signal extraction capabilities of our system from
 they scatter much more light than gold nanoparticles. For scattering complex scattering background. 29
 imaging, the background scattering from this type of super bright

 Figure 3 Colocalization imaging of gold nanoparticles in single cell. (a) Color dark field image, (b) ICCD image, and (c) Φ signal image of
 HeLa cell incubated with 80 nm gold nanoparticles. (d) Scatter plot of the Φ signal versus R/G ratio and Φ distribution histogram of
 monomeric (green) and aggregated (yellow) nanoparticles. (e) Localization of monomeric (green) and aggregated (red) nanoparticles in
 HeLa cell. (f) ICCD dark field image and (g) Φ image of 39 nm gold nanoparticles in HeLa cell. (h) The corresponding Φ distribution
 histogram of monomeric and aggregated nanoparticles. (i) Localization of monomeric (green) and aggregated (red) 39 nm gold
 nanoparticles in HeLa cell. (j-k) Splitting localization images of monomeric (j) and aggregated (k) nanoparticles. (scale bars: 5 μm).

 In cell imaging using gold nanoparticles as probe, particle and aggregates usually could be distinguished under true color dark
 aggregation is almost inevitable. The states of particle monomers field image, since aggregates show different color with monomers

 4 | Chem. Sci., 2019, 00, 1-3 This journal is © The Royal Society of Chemistry 20xx

 Please do not adjust margins
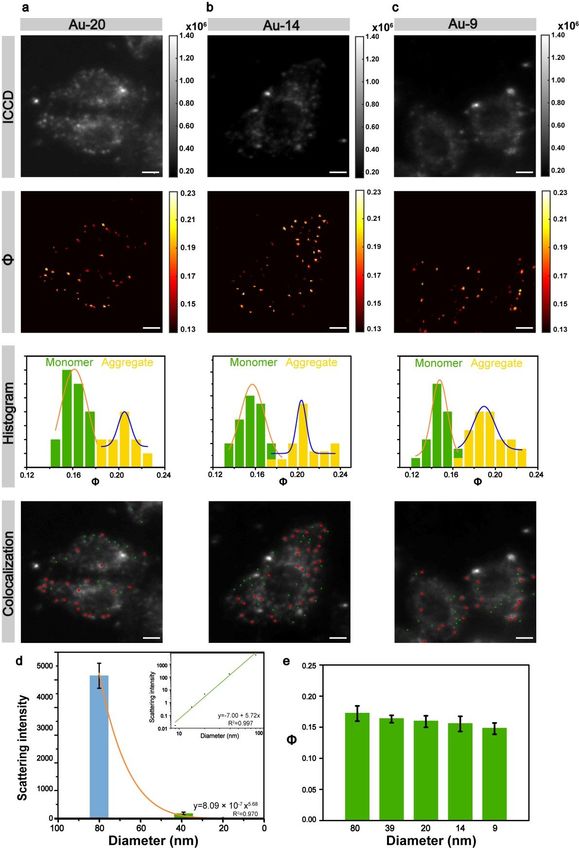
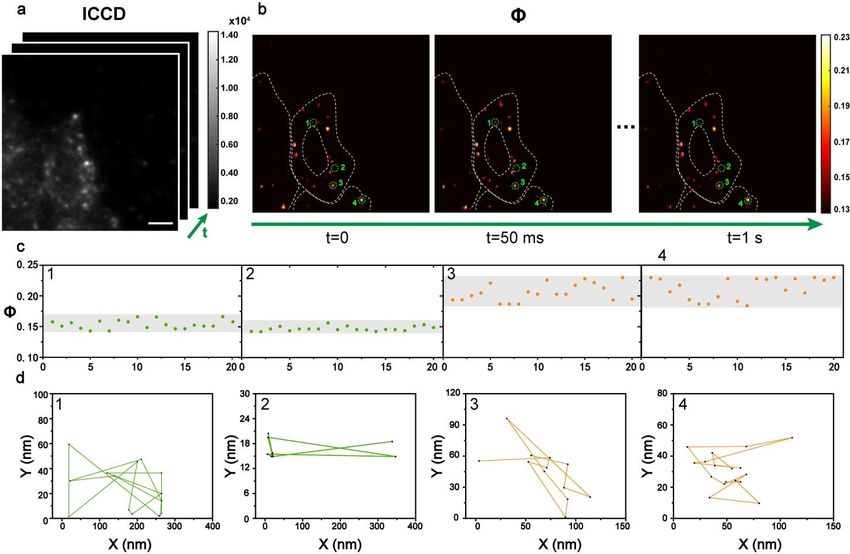
Page 5 of 10 PleaseChemical
 do not adjust margins
 Science

 Journal Name ARTICLE

 (Figure. 2d). We then splited the RGB channels of color dark field counting, the Φ distribution histogram of monomeric and
 View Article Online
 image, and calculated the Red/Green (R/G) value of each aggregated nanoparticles were shown out (Figure 3h). Compared to
 DOI: 10.1039/D0SC04764C
 nanoparticles. Then R/G values and corresponding Ф values of large 80 nm nanoparticles, more aggregated particles were observed for
 number of nanoparticles in many frames of images were plotted 39 nm nanoparticles. The position of all monomeric and aggregated
 into figure 2d and figure S4. The populations of monomers and gold nanoparticles in cells were recognized and marked (Figure 3i-
 aggregates were clearly distinguished according to either R/G 3k). Usually, nanoparticles with size below 40 nm were hard to
 values or Ф signal intensity, since the particle aggregates exhibited capture via regular dark field imaging. Here we can still use the Φ
 a red-shift color and a higher Ф signal. Then the Ф signal values of value intensity to identify the status of gold nanoparticles. A
 This article is licensed under a Creative Commons Attribution-NonCommercial 3.0 Unported Licence.

 these two populations were statistically analyzed and shown in complete set of signal analysis processes for cell imaging is
 right histogram. This result verified the ability of this method to described in details in Supporting Information (Figure S13, S14).
 identity the monomeric and aggregated state of nanoparticles, After that, we gradually reduced the size of gold nanoparticles to

 Chemical Science Accepted Manuscript
 which is an important issue in imaging of nanoparticles within cells. explore the limit of our home-built AMSM system. The 20 nm
 The detailed procedure for data processing was presented in nanoparticles still can loom through the scattering background cell
 Supporting Information (Figure S5). in ICCD image (Figure 4a), but 14 nm and 9 nm nanoparticles were
Open Access Article. Published on 04 January 2021. Downloaded on 1/12/2021 12:01:29 PM.

 According to equation 1, the Ф signal is independent to particle size totally drowned in the background scattering (Figures 4b and 4c).
 in theory. To prove this concept, the intensity of scattering light and Fortunately, small nanoparticles with size down to 9 nm could still
 Ф signal of nanoparticles with size range from 80 to 9 nm were be clearly imaged using our equipment. Some strong scattering light
 measured (Figure 2e and 2f, Figure S6–S10). From the dark field from dust particles or cellular components were successfully
 images, we can see that most of particles are dispersed monomers filtered.
 on glass, because the surface of gold nanoparticles is wrapped by Similar to large size particles, the Φ signals of the small size gold
 PEG. The intensity of scattering signal doped sharply with the nanoparticles also have two distinct distributions. Particle
 particle size, which is consistent well with the Mie theory (Figure community with relative small Φ values indicated monomeric
 2e). With the decrease of particle size, the scattering signal particle and the community with relative large Φ values indicated
 decreased sharply by a power of 5.73, which is close to the Mie the particle aggregation. When we separated intracellular
 theory that scattering cross section drops with particles size by the monomeric and aggregated gold nanoparticles and get the similar
 power of 6 (Figure S10). While the Φ signals of different size overlay image as before, the position of gold nanoparticles can be
 nanoparticles almost remain in the same range, only with a slight accurately pointed out. We further statistically analyzed the
 drop (~8%) along with the size decreasing from 80 nm to 9 nm scattering intensity of different size nanoparticles with in cellular
 (Figure 2f). This tendency is basically consistent with theory of medium, the scattering signal dropped sharply with the decrease of
 equation 1, the slight drop on Φ signals of very small nanoparticles particle size by a power of 5.68 (Figure 4d), which approximately
 could be attribute to the response linearity of camera. We further complies with the Mie theory. However, the intensity of Φ signal
 explored the influence of pump energy, surface coating, and decreased only about 14 % although the particle size was reduced
 surrounding medium on the intensity of Φ signal (Figure S11). For a to more than one-eighth of the beginning (Figure 4e). This tendency
 given medium, Φ signal intensity is proportional to the pump laser is also consistent with the theory of AMSM. The universality of
 power. However, different surface modifications on nanoparticles AMSM was also verified on imaging of small size gold nanoparticles
 did not alter the intensity of their Φ signals. in MCF-7 cells (Figure. S15).
 We then demonstrated AMSM imaging of nanoparticles within cells. Dynamic tracking technology is an urgent demand in cell imaging to
 For the convenience of observation and also minimization of reveal intracellular events in real time. Benefit from the principle of
 adverse effect on cells, we controlled the incubation concentration time sequence control of our AMSM method, video-rate or even
 of gold nanoparticles to ensure only a small amount of fast imaging is feasible (see Supplementary Video). To achieve this,
 nanoparticles were internalized into cells. According to the dark 40 frames of HeLa cells with 9 nm gold nanoparticles were recorded
 field images of cells, the numbers of nanoparticles within each cell (Figure 5a) in one second, and finally 20 frames of Ф signal images
 were around ~102. Gold nanoparticles incubated with HeLa cells were obtained with a frame rate of 20 fps (Figure 5b). Four particles
 were captured in color dark field image and Ф signal image (Figure were extracted as examples and their Ф signals over time were
 3a-c). Through the population in the scatter plot of R/G ratio and Ф exhibited in Figure 5c. The particles 1 and 2 show relatively stable Ф
 signal intensity, monomeric and aggregated gold nanoparticles values around 0.15, thus they are monomeric gold nanoparticles
 could be separated (Figure 3d). Thus the positions of each according to the previous discussion. The particles 3 and 4 are
 nanoparticle could be located within cells (Figure 3e). The identified as aggregates from the Ф signal, which shows a stronger
 assignment of monomeric or aggregated nanoparticles well intensity and a wider variation range than monomers. Then we
 matched color dark field image. HeLa cell without incubating with extracted the position information of these four nanoparticles at
 gold nanoparticles was also checked (Figure. S12). Compared to each frame to track their motion states (Figure 5d). The two
 dark field image (Figure. 3a), the Ф signal image (Figure 3c) showed monomeric gold nanoparticle 1 and 2 exhibit a fast movement with
 very tiny background scattering from cellular components, because a long journey of 1736 and 1438 nm. However, the aggregated
 cellular components did not have a strong resonance absorption particles 3 and 4 show a slower movement and a shorter journey
 like gold nanoparticles. within 500 nm. Apparently, the moving speed of aggregates within
 Then the same imaging procedure was applied by using 39 nm gold cellular medium is much slower than the monomers. Here we just
 nanoparticles (Figure 3f, g). After signal extracting and particle showed the dynamics imaging ability of our method, the moving

 This journal is © The Royal Society of Chemistry 20xx Chem. Sci., 2019, 00, 1-3 | 5

 Please do not adjust margins
PleaseChemical
 do not adjust margins
 Science Page 6 of 10

 ARTICLE Journal Name

 states of gold nanoparticles within cells could be tracked at video View Article Online
 rate (20 fps) for a long term if necessary. DOI: 10.1039/D0SC04764C
 This article is licensed under a Creative Commons Attribution-NonCommercial 3.0 Unported Licence.

 Chemical Science Accepted Manuscript
Open Access Article. Published on 04 January 2021. Downloaded on 1/12/2021 12:01:29 PM.

 Figure 4 Imaging of small gold nanoparticles within cells. (a-c) ICCD image, corresponding Φ image, Φ distribution histogram and the
 spatial position of monomeric and aggregated gold nanoparticles of (a) 20 nm, (b) 14 nm, and (c) 9 nm gold nanoparticle. (d) Scattering

 6 | Chem. Sci., 2019, 00, 1-3 This journal is © The Royal Society of Chemistry 20xx

 Please do not adjust margins
Page 7 of 10 PleaseChemical
 do not adjust margins
 Science

 Journal Name ARTICLE

 light intensity of nanoparticles with different sizes in Hela cells. Inset: Linear fitting of the logarithm of scattering light intensityView
 versus
 Article Online
 particle size. (e) Φ signal value of gold nanoparticles with different sizes in HeLa cell. (scale bars: 5 μm) DOI: 10.1039/D0SC04764C
 This article is licensed under a Creative Commons Attribution-NonCommercial 3.0 Unported Licence.

 Chemical Science Accepted Manuscript
Open Access Article. Published on 04 January 2021. Downloaded on 1/12/2021 12:01:29 PM.

 Figure 5 Dynamic tracking of 9 nm gold nanoparticles in cells. (a) A series of dark field image of HeLa cell incubated with gold
 nanoparticles captured by ICCD in sequence. (scale bars: 5 μm) (b) The corresponding Φ signal images of intracellular gold nanoparticles in
 1 second with a time interval of 50 ms. (c) The variation of Φ signal of four typical particles extracted in the dynamic Ф signal image. (d)
 Movement tracking of the four particles in 1 second. A videography of gold nanoparticles tracking was vividly shown in Supporting
 Information.

 photobleaching, the AMSM imaging method makes great
 potential for real-time cell imaging by using small size gold
 Conclusion nanoprobes for unfolding dynamics molecular processes
 within living cells.
 We have demonstrated an absorption modulated scattering Experimental
 microscopy (AMSM) for imaging small gold nanoparticles
 within scattering cellular medium. Since the AMSM utilized Reagents
 both absorption and scattering rather than a single one, only
 subjects with characteristic features of resonance absorption O-[2-(3-Mercaptopropionylamino)ethyl]-O'-
 and scattering were detected, and the scattering background methylpolyethylene glycol (Mw= 5000, SH-PEG), and glycerol
 from cellular component could be almost fully removed. The (GC, ≥99.5%) were obtained from Sigma-Aldrich Co. (U.S.A.).
 AMSM signal was very sensitive to the nanoparticle states, Human cervical cancer (HeLa) cells, Michigan Cancer
 which enable to distinguish monomers or aggregates in Foundation-7 (MCF-7) cells, paraformaldehyde (4 %),
 cellular environment. Compared to regular darkfield phosphate buffer solution (PBS, 10 mM, pH=7.4) were
 microcopy, the AMSM could detect much smaller provided by KeyGEN Biotech. Co. (Nanjing, China). The
 nanoparticles with size far beyond Rayleigh limit, with a polystyrene spheres used in this work were purchased from
 sensitivity comparable to that of a photothermal microscopy. Zhejiang Tianke high tech Development Co., Ltd (Zhejiang,
 The imaging speed of AMSM could be close to video rate or China). Gold nanoparticles (Au NPs) with an average diameter
 even faster in principle, if with a high frequency pulsed laser of 9 nm ,14 nm, 20 nm, 39 nm and 80 nm were purchased
 and a fast camera. On account of stable signal intensity, fast
 imaging speed, background removal ability, and without

 This journal is © The Royal Society of Chemistry 20xx Chem. Sci., 2019, 00, 1-3 | 7

 Please do not adjust margins
PleaseChemical do not adjust margins Science Page 8 of 10 ARTICLE Journal Name from Ted Pella Inc. (U.S.A.) (Figure. S16). Ultra-pure water from 1. H. C. Hulst and H. C. van de Hulst, Light scattering by View Article Online Millipore Milli-Q (18 MΩ·cm−1) was used in the experiments. small particles, Courier Corporation, 1981. DOI: 10.1039/D0SC04764C 2. G. Mie, Annalen der physik, 1908, 330, 377-445. Sample 3. S. Schultz, D. R. Smith, J. J. Mock and D. A. Schultz, Proc. Natl. Acad. Sci. U. S. A., 2000, 97, 996. The preparation process of Au-PEG particles with different particle sizes is basically the same. Gold nanoparticles of 4. W. Eck, G. Craig, A. Sigdel, G. Ritter, L. J. Old, L. Tang, different sizes (9 nm 9.5nM, 14 nm 2.3nM, 20nm 1.2nM, 40 M. F. Brennan, P. J. Allen and M. D. Mason, ACS Nano, 2008, 2, 2263-2272. This article is licensed under a Creative Commons Attribution-NonCommercial 3.0 Unported Licence. nm 150 pM) were mixed with 1 mmol/L SH-PEG of the same volume to prepare Au-PEG particles of different sizes. At the 5. E. Oh, R. Liu, A. Nel, K. B. Gemill, M. Bilal, Y. Cohen same time, the desired Au-PEG was obtained by mixing the 80 and I. L. Medintz, Nat. Nanotechnol., 2016, 11, 479- nm gold nanoparticles (18 pM) with an equal volume of 486. Chemical Science Accepted Manuscript 0.1mmol/L PEG solution. The mixture was maintained at 37 C 6. N. Chen, Y. He, Y. Su, X. Li, Q. Huang, H. Wang, X. and stirred continuously for 24 hours. By using the appropriate Zhang, R. Tai and C. Fan, Biomaterials, 2012, 33, speed, the resulting Au-PEG were then centrifuged and 1238-1244. Open Access Article. Published on 04 January 2021. Downloaded on 1/12/2021 12:01:29 PM. washed several times. Au NPs, Au-PEG or Au-DNA was absorbed on positively 7. C. Rosman, S. Pierrat, A. Henkel, M. Tarantola, D. charged glass slides for 30 minutes, respectively. Then Au- or Schneider, E. Sunnick, A. Janshoff and C. Sönnichsen, Au-complex coated glass slides were washed three times and Small, 2012, 8, 3683-3690. placed on an objective for detection. Moreover, water or 8. X. Nan, P. A. Sims and X. S. Xie, ChemPhysChem, glycerol was dropped on each glass slides acted as surrounding 2008, 9, 707-712. medium. 9. I. H. El-Sayed, X. Huang and M. A. El-Sayed, Nano HeLa cells, MCF-7 cells were routinely cultured in DMEM Lett., 2005, 5, 829-834. medium with 10% fetal bovine serum, 2% antibiotics, and 5% 10. J. A. Yang, H. T. Phan, S. Vaidya and C. J. Murphy, CO2 in a 37 C incubator. When making samples, HeLa cells, Nano Lett., 2013, 13, 2295-2302. MCF-7 cells were seeded on a glass coverslip. After cultured for 24 h, proper Au-PEG solution was added to incubate. Five 11. G. A. Craig, P. J. Allen and M. D. Mason, in Cancer hours later, the HeLa, MCF-7 cells coated glass coverslips were Nanotechnology: Methods and Protocols, eds. S. R. washed with PBS for several times to remove excess Grobmyer and B. M. Moudgil, Humana Press, nanoparticles and ready for living detection. The fixed cell Totowa, NJ, 2010, DOI: 10.1007/978-1-60761-609- samples were prepared by incubation with 4% 2_12, pp. 177-193. paraformaldehyde for additional 15 min, and then the 12. W. Qian, X. Huang, B. Kang and M. El-Sayed, J. coverslips coated with fixed cells were washed and infiltrated Biomed. Opt., 2010, 15, 046025. in PBS solution for detection. The temperature of the glass 13. C. Sönnichsen, B. M. Reinhard, J. Liphardt and A. P. slides and glass coverslips were controlled by a thermal Alivisatos, Nat. Biotechnol., 2005, 23, 741-745. platform equipped with a sensitive temperature control system. For all cell experiments on microscope, at least three 14. L. Zhang, Y. Li, D.-W. Li, C. Jing, X. Chen, M. Lv, Q. independent trials of experiments were performed and 10-20 Huang, Y.-T. Long and I. Willner, Angew. Chem. Int. cells were randomly selected at each time of measurement. Ed., 2011, 50, 6789-6792. MTT assay confirmed that the cell activity of cells under 15. K. Lee, Y. Cui, L. P. Lee and J. Irudayaraj, Nat. different experimental conditions was greater than 96%, Nanotechnol., 2014, 9, 474-480. indicating that AMSM imaging method had no photodamage 16. M.-X. Li, C.-H. Xu, N. Zhang, G.-S. Qian, W. Zhao, J.-J. on cells (Figure. S17). Xu and H.-Y. Chen, ACS Nano, 2018, 12, 3341-3350. 17. F. Wang, Y. Zhu, L. Zhou, L. Pan, Z. Cui, Q. Fei, S. Luo, D. Pan, Q. Huang, R. Wang, C. Zhao, H. Tian and C. Conflicts of interest Fan, Angew. Chem. Int. Ed., 2015, 54, 7349-7353. The authors declare no competing financial interests. 18. R. Tang, J. Xue, B. Xu, D. Shen, G. P. Sudlow and S. Achilefu, ACS Nano, 2015, 9, 220-230. 19. D. M. Chudakov, M. V. Matz, S. Lukyanov and K. A. Lukyanov, Physiol. Rev., 2010, 90, 1103-1163. Acknowledgements 20. B. Dubertret, P. Skourides, D. J. Norris, V. Noireaux, This work was mainly supported by the National Natural Science A. H. Brivanlou and A. Libchaber, Science, 2002, 298, Foundation of China (21675081 and 22034003), Excellent Research 1759. Program of Nanjing University (ZYJH004), and State Key Laboratory 21. B. Zhang, F. Zhang, P. Zhang, D. Shen, X. Gao and G. of Analytical Chemistry for Life Science (5431ZZXM2002) Zou, Anal. Chem., 2019, 91, 3754-3758. 22. B. H. Kim, M. J. Hackett, J. Park and T. Hyeon, Chem. Mater., 2014, 26, 59-71. 23. P. K. Jain, K. S. Lee, I. H. El-Sayed and M. A. El-Sayed, References J. Phys. Chem. B, 2006, 110, 7238-7248. 8 | Chem. Sci., 2019, 00, 1-3 This journal is © The Royal Society of Chemistry 20xx Please do not adjust margins
Page 9 of 10 PleaseChemical
 do not adjust margins
 Science

 Journal Name ARTICLE

 24. M. A. van Dijk, A. L. Tchebotareva, M. Orrit, M. View Article Online
 Lippitz, S. Berciaud, D. Lasne, L. Cognet and B. DOI: 10.1039/D0SC04764C

 Lounis, Phys. Chem. Chem. Phys., 2006, 8, 3486-
 3495.
 25. H. Hama, H. Kurokawa, H. Kawano, R. Ando, T.
 Shimogori, H. Noda, K. Fukami, A. Sakaue-Sawano
 and A. Miyawaki, Nat. Neurosci., 2011, 14, 1481-
 1488.
 This article is licensed under a Creative Commons Attribution-NonCommercial 3.0 Unported Licence.

 26. D. Sun, J. Fan, C. Liu, Y. Liu, Y. Bu, C. J. Lyon and Y.
 Hu, Anal. Chem., 2016, 88, 12001-12005.
 27. Y. Cui, X. Wang, W. Ren, J. Liu and J. Irudayaraj, ACS

 Chemical Science Accepted Manuscript
 Nano, 2016, 10, 3132-3143.
 28. Z. Ye, L. Wei, X. Zeng, R. Weng, X. Shi, N. Wang, L.
 Chen and L. Xiao, Anal. Chem., 2018, 90, 1177-1185.
Open Access Article. Published on 04 January 2021. Downloaded on 1/12/2021 12:01:29 PM.

 29. D. Boyer, P. Tamarat, A. Maali, B. Lounis and M.
 Orrit, Science, 2002, 297, 1160.
 30. L. Cognet, C. Tardin, D. Boyer, D. Choquet, P.
 Tamarat and B. Lounis, Proc. Natl. Acad. Sci. U. S. A.,
 2003, 100, 11350.
 31. M. Selmke, M. Braun and F. Cichos, ACS Nano, 2012,
 6, 2741-2749.
 32. A. Gaiduk, P. V. Ruijgrok, M. Yorulmaz and M. Orrit,
 Chem. Sci., 2010, 1, 343-350.
 33. H. Zhang, W. Gao, Y. Liu, Y. Sun, Y. Jiang and S.
 Zhang, Anal. Chem., 2019, 91, 12581-12586.
 34. Z. Chen, X. Shan, Y. Guan, S. Wang, J.-J. Zhu and N.
 Tao, ACS Nano, 2015, 9, 11574-11581.
 35. W. Jing, Y. Wang, Y. Yang, Y. Wang, G. Ma, S. Wang
 and N. Tao, ACS Nano, 2019, 13, 8609-8617.
 36. Y. Bai, D. Zhang, L. Lan, Y. Huang, K. Maize, A.
 Shakouri and J.-X. Cheng, Science Advances, 2019, 5,
 eaav7127.
 37. V. Jacobsen, P. Stoller, C. Brunner, V. Vogel and V.
 Sandoghdar, Opt. Express, 2006, 14, 405-414.
 38. R. W. Taylor, R. G. Mahmoodabadi, V.
 Rauschenberger, A. Giessl, A. Schambony and V.
 Sandoghdar, Nature Photonics, 2019, 13, 480-487.
 39. A. Schmidt, M. Chiesa, X. Chen and G. Chen, Rev. Sci.
 Instrum., 2008, 79, 064902.
 40. J. H. Hodak, A. Henglein and G. V. Hartland, J. Phys.
 Chem. B, 2000, 104, 9954-9965.
 41. M. Rashidi-Huyeh and B. Palpant, J. Appl. Phys.,
 2004, 96, 4475-4482.
 42. Z. Qin and J. C. Bischof, Chem. Soc. Rev., 2012, 41,
 1191-1217.
 43. N. N. Nedyalkov, S. E. Imamova, P. A. Atanasov, R. A.
 Toshkova, E. G. Gardeva, L. S. Yossifova, M. T.
 Alexandrov and M. Obara, Appl. Surf. Sci., 2011, 257,
 5456-5459.
 44. T. L. Bergman, F. P. Incropera, D. P. DeWitt and A. S.
 Lavine, Fundamentals of heat and mass transfer,
 John Wiley & Sons, 2011.
 45. C. D. S. Brites, M. C. Fuertes, P. C. Angelomé, E. D.
 Martínez, P. P. Lima, G. J. A. A. Soler-Illia and L. D.
 Carlos, Nano Lett., 2017, 17, 4746-4752.

 This journal is © The Royal Society of Chemistry 20xx Chem. Sci., 2019, 00, 1-3 | 9

 Please do not adjust margins
Chemical Science Page 10 of 10

 View Article Online

 A graphical and textual abstract for the Table of contents entry DOI: 10.1039/D0SC04764C
 This article is licensed under a Creative Commons Attribution-NonCommercial 3.0 Unported Licence.

 Chemical Science Accepted Manuscript
 An absorption modulated scattering microscopy that allows for imaging of sub-10 nm gold
 nanoparticles within scattering cellular medium is presented.
Open Access Article. Published on 04 January 2021. Downloaded on 1/12/2021 12:01:29 PM.
You can also read