Global Insights 5 Questions for 2021
←
→
Page content transcription
If your browser does not render page correctly, please read the page content below

January 2021

Global Insights
            5 Questions
               for 2021

                              1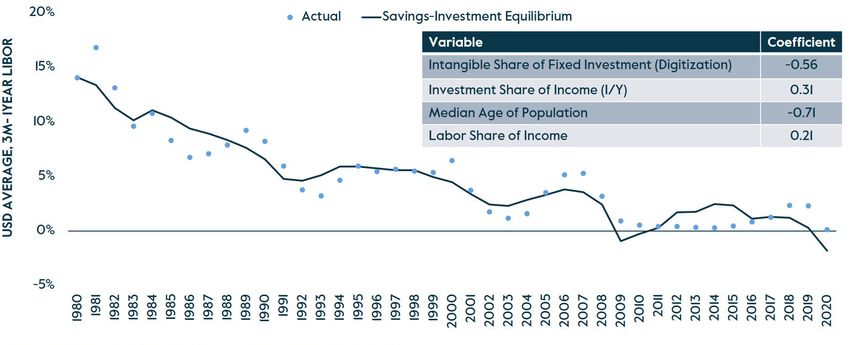
Predictions are difficult, especially when they’re about the future.1 But
                       sometimes predictions do not suffice even when they’re accurate. A year ago,
                       those who bucked conventional wisdom and predicted a recession in 2020
                       were proven right, but probably not for the reasons they specified. Last April,
                       many forecasters expected a strong rebound in the second half of 2020 as the
                       pandemic was brought under control and social distancing restrictions were
                       lifted. The rebound largely materialized even as the predicate for it did not;
                       the U.S. finished the year with 3,500 new fatalities and 230,000 new infections
                       each day, with offices in central business districts operating at 15% capacity,
                       air passenger traffic down -60%, and nearly 20% of restaurants in the country
                       permanently closed.2

                       While there is little doubt that the number of vials of vaccine(s) manufactured,
                       distributed and shot into arms will be among the most important
                       macroeconomic variables of 2021, we know from last year’s experience that
                       it’s not all that matters. The pandemic changed the way we live, work and
                       entertain ourselves. Advance knowledge of vaccination rates would not
                       be sufficient to predict where the economy or asset prices finish the year.
                       Additional questions need to be answered.

1   Old Danish proverb traditionally attributed to physicist Niels Bohr.
2   National Restaurant Association, Kastle, and COVID Tracking Project, January 2021.
                                                                                                          2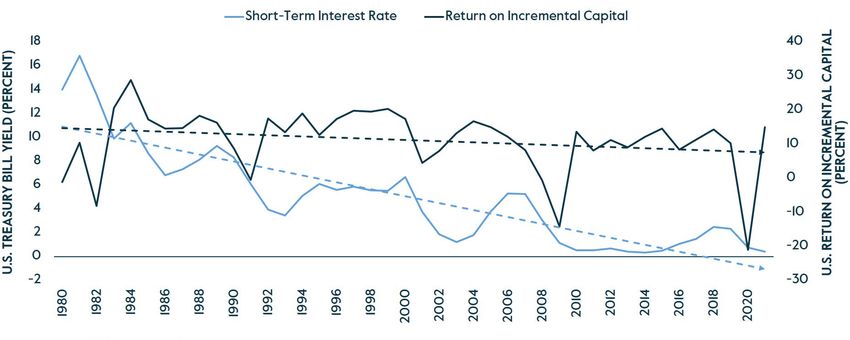
1

                         Will the post-vaccine rebound halt momentum
                         for industries that thrived in 2020?
                         Overall business revenues fell more in 2020 than in                            The same dispersion is evident in the household
                         any 12-month period during the Global Financial Crisis                         consumption data. The reallocation in spending
                         (2007-09), but the more salient difference was the                             across categories exceeds the contraction in total
                         dispersion in results across sectors. In 2008-09, only                         household spending itself (Figure 1). The savings
                         one-in-20 public companies experienced revenue                                 from sharply reduced travel spending, and fewer
                         declines in excess of 50%.3 In 2020, twice as many                             visits to bars, restaurants, movie theatres and
                         businesses endured losses of this magnitude, but                               amusement parks financed a boom in digital media
                         more than 5% of public companies also reported                                 and equipment (+24%), new and used auto sales
                         revenue growth of over 50%. This means that there
                                                                3
                                                                                                        (+11%), furniture and home appliances (+15%) and even
                         were more businesses with greater than 50% revenue                             pets and related supplies (+10%). So while total U.S.
                         growth in 2020 than companies whose revenues fell                              consumption finished 2020 down -1.5% from year-ago
                         by -50% in the GFC.                                                            levels, spending in these categories was 11% higher, on

                         Figure 1.
                         Annualized Spending Growth by Category

3     Measured on a year-over-year basis to trough in activity. Greenwood, R. et al. (2020), Sizing Up Corporate Restructuring in the COVID
      Crisis,” NBER Working Paper 28104.
Figure 1. Source: Carlyle Analysis; Bureau of Economic Analysis, January 2021. There is no guarantee these trends will continue.                                3
Figure 2.
                         Decline in Travel Spending Financed Durable Goods Purchases in 2020

                         average, than one would have expected at the start                                some digital streaming services experienced what
                         of the year (Figure 2).                                                           they would have previously considered to be five
                                                                                                           years’ worth of subscriber growth. Did the pandemic
                         As a result, the 2021 recovery is likely to prove far                             “frontload” future growth into 2020 by depriving
                         more complicated than the one that followed the                                   consumers of other entertainment options? Or is this
                         GFC, when “consumer discretionary” spending on                                    the new run rate to expect going forward? Many
                         autos, boats, airline tickets and resort bookings rose                            analysts now expect cumulative subscriber growth
                         in tandem. A rising post-vaccine tide is unlikely to lift                         to be 3x to 4x larger than expected a year ago. While
                         all boats; the stronger the post-pandemic rebound in                              these projections may come to fruition, they are not
                         the hardest-hit categories, the greater the likelihood                            likely to coexist with the 4x to 6x rebound in spending
                         that revenues will not only slow but actually contract                            at theatres, sports venues and live events implied by
                         for 2020’s winners. Likewise, the more persistent some                            bottom-up EPS estimates (Figure 3). There is some risk
                         of pandemic-induced lifestyle changes prove to be,                                that the market today is discounting mutual exclusive
                         the greater the number of insolvencies among the                                  realities: a linear extrapolation of 2020 results for the
                         sectors banking on a sharp recovery.                                              winners in digital media and durable goods and a full
                                                                                                           rebound to pre-pandemic trends in travel, leisure and
                         In just nine months since the start of the pandemic,                              in-person experiences (Figure 4).

Figure 2. Source: Carlyle Analysis; BEA Data, December 2020. There is no guarantee these trends will continue.

                                                                                                                                                                     4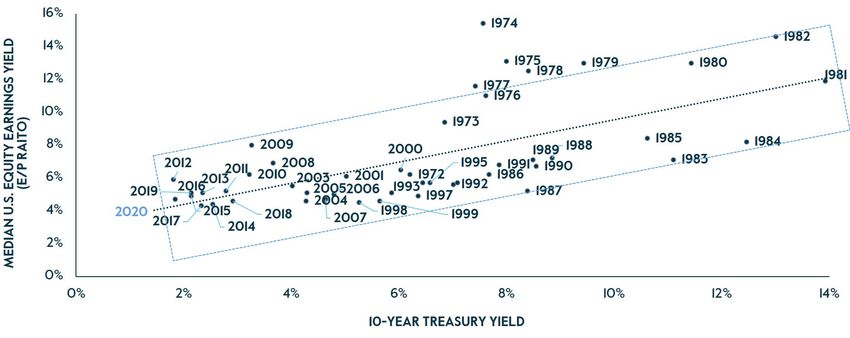
Figure 3.
                          Persistence of 2020 Trends or Reversion to Normal?

                          Figure 4.
                          Markets Erase Losses in Hard-Hit Sectors Without Taking Back
                          Gains Among 2020’s Winners

Figure 3. Source: Carlyle Analysis; Walt Disney Company Investor Day; FactSet, January 2021. There is no guarantee these projections will materialize.
Figure 4. Source: Carlyle; Bloomberg, January 5, 2021. There is no guarantee these trends will continue.
                                                                                                                                                         5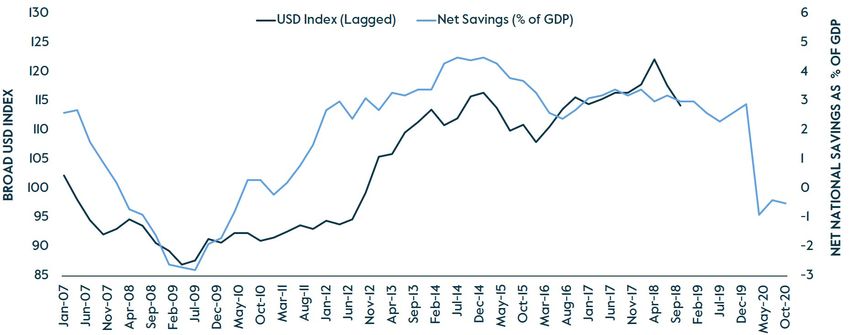
2

                          What Does the Fed’s New Policy Framework
                          Mean for Asset Prices?
                          One could argue that ultra-low interest rates and                                  One doesn’t need to subscribe to this argument to
                          central bank liquidity backstops have resulted in a                                recognize that today’s record high purchase price
                          market that’s rationally Pollyannaish. With downside                               multiples are almost exactly where one would expect
                          risks seemingly truncated by the free option written                               based on the historic relationship between corporate
                          by policymakers, it should be no surprise that each                                earnings yields and long-term interest rates (Figure
                          asset gets priced to its best outcome in the best of all                           5). Lower (real) interest rates boost asset prices by
                          possible worlds. And with overall economic activity                                depressing the discount rates applied to all future
                          depressed relative to long-run potential, the runway                               cash flows. While economy-wide expected returns
                          for growth may be long enough to allow each and                                    may have declined with the fall in bond yields,
                          every optimistic narrative to play itself out over the                             the premium from bearing market, liquidity and
                          next several years.                                                                macroeconomic risks has not. Indeed, the return on

                          Figure 5.
                          Record Valuations Consistent with Low Bond Yields

Figure 5. Source: Carlyle Analysis of Ken French, U.S. Treasury Data, 2020. There is no guarantee any trends will continue.

                                                                                                                                                                     6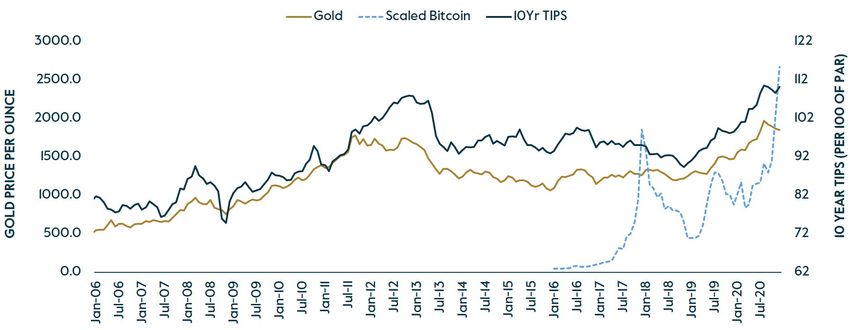
Figure 6.
                         Risk-Free Rates Fall 40% More than the Real Return on Capital

                         discretionary risk capital has been steadily widening                            corporate cash holdings (Figure 8) offers perhaps
                         relative to the risk-free rate for years (Figure 6).                             the clearest evidence of this shift, as the nearly
                                                                                                          infinite scalability of digital platforms increases
                         With asset prices so leveraged to low rates, should                              retained earnings (corporate savings) relative to
                         investors worry about a sudden and unforeseen                                    corporate investment.
                         change in monetary policy? As Marx wrote of
                         revolutionaries, central banks make their own history                            The Fed seems to have learned that lesson. Formal
                         but not under self-selected circumstances. Savings-                              changes to its policy framework announced in August
                         investment fundamentals dictate the appropriate                                  2020 should ensure that policy does not become
                         level of interest rates, not the whims of policymakers.                          unduly reactive to the first signs of wage gains or
                                                                                                          price pressures in the coming years. The Fed seems
                         The Fed’s cardinal mistake of the last decade was                                to be telling investors that while it may lack the room
                         not stoking inflation by “printing money” – as many                              to cut rates today, it can still meet its objectives, over
                         commentators feared in 2010-13 – but failing to                                  time, by refraining from raising rates tomorrow.
                         appreciate how structural economic changes had
                         depressed “equilibrium” interest rates (Figure 7).                               While ostensibly aimed at hastening the pace of
                         Interest rates that seem “too low” relative to historic                          job creation and wage gains, the net effect could
                         experience can be perfectly appropriate, even                                    be to strengthen convictions among investors that
                         restrictive, when desired savings increases relative                             Pollyanna has this one right.
                         to investment demand. The sustained increase in

Figure 6. Source: Carlyle Analysis; IMF WEO Database, October 2020. There is no guarantee any trends will continue.

                                                                                                                                                                   7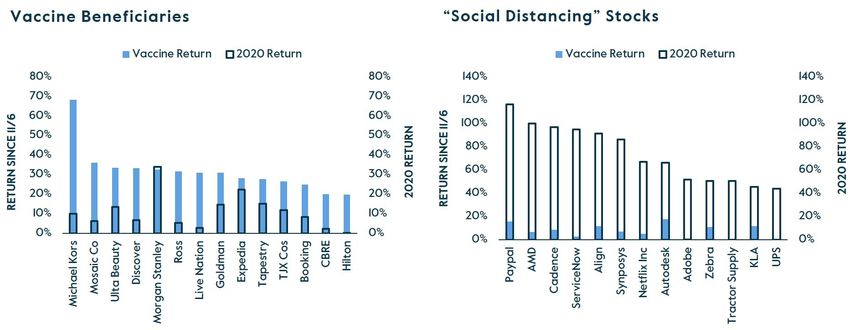
Figure 7.
                         Structural Factors Explain 88% of the Decline in Interest Rates

                         Figure 8.
                         Increase in Corporate Savings (Retained Earnings) Reflects in
                         Exponential Rise in Cash Holdings

Figure 7. Source: Carlyle Analysis; OECD; Federal Reserve Data; IMF WEO 2020. There is no guarantee any trends will continue.
Figure 8. Source: Carlyle Analysis; OECD; Federal Reserve Data. There is no guarantee any trends will continue.
                                                                                                                                8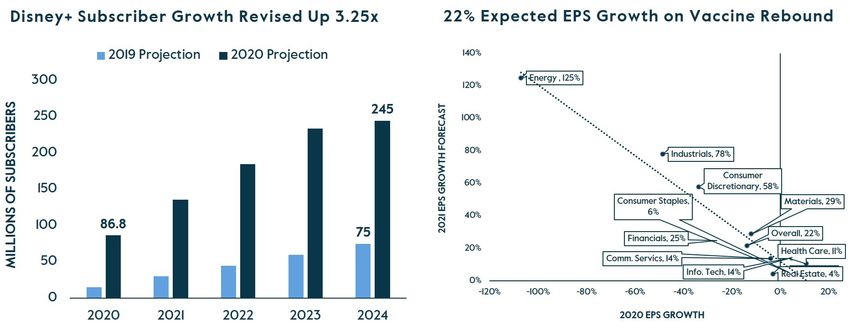
3

                         How Much Further Does the Dollar Have to Fall?

                         Should the Fed deliver on its promise to keep rates                             stood at nearly $13 trillion, of which over $4 trillion was owed
                         pinned near zero, the most obvious loser would be                               by businesses in Emerging Market economies.4 As the Fed
                         the U.S. dollar. Contemporary discussions of currency                           tightened last cycle, the differential between U.S. interest
                         risk quickly turn to Bitcoin and other cryptocurrencies,                        rates and those available in the rest of the world widened
                         whose demand skyrockets on the same fears that have                             by nearly 350bps (Figure 10). Between the May 2013 “taper
                         historically motivated gold purchases (Figure 9). While it                      tantrum” and its cyclical peak, the dollar appreciated by
                         may seem quaint to think of the dollar’s value in relation                      35% against a broad basket of currencies, devastating EM
                         to other currencies, the core problem in international                          businesses that depend on domestic currency revenues
                         finance today is not that the dollar is worthless, but that                     and assets to repay their USD liabilities.5
                         it remains too rich. Though the greenback closed 2020
                         at its lowest level since mid-2018, it still looks significantly                As U.S. rates plunged over the past year, this differential
                         overvalued relative to most currencies whether                                  has fallen back to late-2014 levels, consistent with an
                         measured on the basis of interest differentials, relative                       additional -11% decline in the broad dollar over the next
                         production costs, or balance of payments trends.                                year. When adding the effects of larger fiscal deficits and
                                                                                                         Treasury issuance – which have already pushed U.S. net
                         At the end of 2020, the total stock of dollar-denominated                       national savings rates into negative territory – the
                         debt owed by corporate borrowers outside of the U.S.                            implied decline would be closer to -20% (Figure 11).

                         Figure 9.
                         Gold Prices Tightly Correlated with Inflation Risk Premium

4     Bank for International Settlements, Total credit to non-bank borrowers by currency of denomination, December 2020.
5     Every 1% increase in the dollar has been associated with a -0.3% decline in EM GDP growth Hofman, B. and T. Park. BIS Quarterly Review, December 7, 2020.
Figure 9. Source: Carlyle Analysis; Federal Reserve Bank of St. Louis.                                                                                                9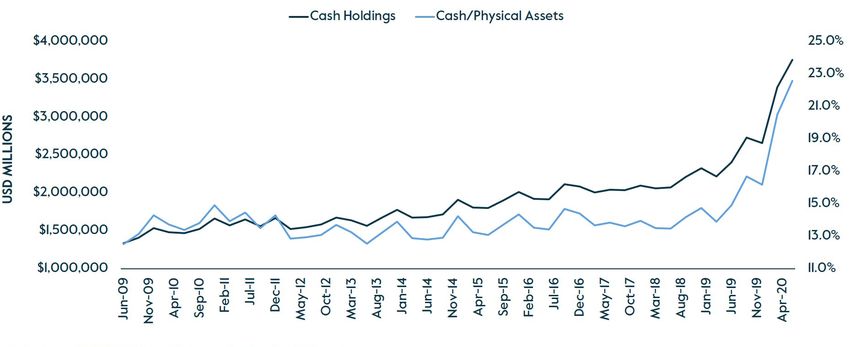
Figure 10.
                         Broad Dollar Index & Interest Rate Differentials

                         Figure 11.
                         Broad Dollar & Net National Savings Rate

                         Such declines would not only be helpful to EM                                   to those in EM economies (excluding China).6 U.S.
                         borrowers, but also consistent with the stated goals                            workers cost more on a relative basis even if that didn’t
                         of the Fed and Treasury Secretary-designate Janet                               show up in their paycheck. Engineering a -15% to -20%
                         Yellen, who intend to “run the economy hot” to achieve                          decline in the dollar through greater fiscal-monetary
                         broad-based and inclusive wage gains. While U.S.                                coordination would be the perfect way to create space
                         wage growth last cycle did not feel particularly robust,                        for more rapid domestic wage gains, especially in a
                         dollar appreciation caused domestic wage rates and                              world where inflation pass-through is limited by the
                         production costs to rise by an average of 23% relative                          dollar’s dominant international role.7

6     Source: Carlyle Analysis; IMF, WEO Database, October 2020. There is no guarantee any trends will continue.
7     Dominant Currencies and External Adjustment, IMF, July 20, 2020.
Figure 10. Source: Carlyle Analysis; ICE Indices, January 5, 2021.                                                                                              10
Figure 11. Source: Carlyle Analysis; BEA and Federal Reserve Board Data, January 5, 2021.
4
Has China’s Relative Economic Position
Strengthened?
At the onset of the pandemic, it seemed that no tensions with key trading partners, further depressing
economy would suffer more than China’s. The trade and investment flows.
sharp drop in its Q1-2020 GDP exposed how
dependent global value chains had become on Less than a year later, China seems poised to emerge
Chinese manufacturing and logistics. Multinational from the pandemic in a much stronger relative position.
corporations were expected to onshore production, While global GDP likely contracted by -4% last year,
identify alternative suppliers, and otherwise China’s expanded by 3%.8 China’s economy is now
create redundancies that would make the Chinese 20% larger than that of the U.S. and nearly 5x larger
“node” less central to global production networks. than Japan’s when measured at purchasing power
Questions about the government’s handling of the parity. The country’s response to the coronavirus
initial outbreak also seemed likely to raise diplomatic was so effective at suppressing new infections that
Figure 12.
Rebound in Chinese Retail Sales & Foot Traffic
8 Carlyle Analysis. IMF, WEO Database, October 2020.
Figure 12. Source: Carlyle Analysis of Portfolio Company Data; CPCA, November 2020. There is no guarantee any trends will continue.
11Figure 13.
Chinese Infrastructure & Logistics Outperform
Western government officials and news agencies Multinationals found it was a lot easier to leave China
initially questioned the accuracy of their reported in theory than it was in practice. The debt-financed
figures. Mass testing, centralized quarantine, and
9
infrastructure projects that led so many hedge funds to
digital contract tracing eventually became the hallmark bet on China’s implosion in 2015-16 now accommodate
of East Asia’s successful efforts to combat the virus. over half of all global merchandise trade.10 Boasting
Domestic air travel, retail foot traffic and work life seven of the 10 busiest ports in the world and a logistics
largely returned to normal (Figure 12) while languishing sector that sprung back to full capacity within 80 days
in Europe and North America. of the initial lockdown orders (Figure 13), China was the
9 C.f. “How accurate are China’s virus numbers?” PBS, April 1, 2020.
10 Carlyle Analysis. World Bank, WDI Database, 2020. Gross Inflows + Outflows.
Figure 13. World Shipping Council, October 2020; Carlyle Analysis of Portfolio Company Data and Google Mobility, December 2020. There is no guarantee these trends will continue. 12Figure 14.
For First Time Ever, Another Nation (China) Home to More Fortune 500
Businesses than the U.S.
last place any business would want to leave in the midst accessing U.S. user data. But these obstacles are
of a pandemic. The bilateral trade surplus with the U.S. hardly insurmountable. Exports only account for 19% of
looks to have returned to its prior peak. China’s GDP, down from 38% in 2007, and a figure likely
to fall further as household consumption accounts for
The future will be more complicated. Growth will a larger share of growth. Access to critical technology
come to depend on domestic rather than external remains a challenge, but China is already home to
demand. The U.S. seems likely to restrict access to more large, internationally active businesses than the
key technologies, like semiconductors, and prevent U.S. (Figure 14). This set of obstacles looks much easier
Chinese software and phone-based apps from to maneuver than those of 12-months ago.
Figure 14. Source: Carlyle; Fortune Global 500, 2020. There is no guarantee any trends will continue.
135
What Do Migratory Patterns Suggest About the
Future of Work and State Finances?
At the onset of the pandemic, “recovery” was often entirely, with significant out-migration from New York,
equated with a return to normal life and business Chicago, and California. 11 Relative to the pre-COVID
operations. This was generally the pattern observed baseline, housing demand has been nearly perfectly
in China and other Asian economies. But in the U.S. correlated with distance from central business
and Europe, many firms returned to pre-pandemic districts. The biggest losers have been the densest
levels of output, productivity and sales on a zip codes and areas with the largest share of jobs
predominately remote basis, weakening the “back- that can be performed remotely (Figure 15). Overall
to-the-office” imperative and allowing workers to U.S. home purchases finished the year 20% above
relocate to homes and communities better suited to pre-COVID levels (Figure 16), with sales and house
new realities. price appreciation concentrated in suburbs and
smaller metro areas.
In the U.S., people not only fled the city for the
suburbs but also left many major metro areas Initially, out-migration was attributed to short-term
Figure 15.
Pandemic-Induced Shifts in Housing Demand
Home Sales vs Home Sales vs Home Sales vs
Distance from Downtown Population Density Share of Office Jobs
11 United Van Lines, National Migration Data, 2020.
Figure 15. Source: Federal Reserve Bank of Dallas, “The Impact of the COVID-19 Pandemic on the Demand for Density: Evidence from the U.S. Housing Market,” October 2020.
14Figure 16.
Rise in House Sales & Price Appreciation
inconveniences, like closed bars, restaurants and These migratory patterns could create “facts on the
gyms – amenities that tend to be concentrated in ground” that force employers to embrace remote
the densest zip codes. Many of the renters who left work to compete for talent. Rather than demand that
may return after the pandemic, but home purchases workers return, some employers could even follow
are rarely short-term decisions. The typical U.S. them out-of-state, as seems to have occurred with
homeowner has been in their current residence for some tech businesses departing the San Francisco
13 years12 and 61% of first-time buyers are still in that Bay Area for Texas. 15 If so, we could see more distress
home eight years after the purchase. 13 Moreover, in the office market, as demand for existing floor
the exodus from crowded and high-cost metro areas space turns out to be softer and markets clear at
in favor of smaller and more reasonably priced lower rents than analysts currently anticipate. In
communities has been apparent in the data for the addition, post-COVID fiscal gaps in states with the
past several years. The pandemic may have simply
14
highest office density could prove to be even larger
accelerated out-migration by changing attitudes than currently expected, as remote work removes
about working from home, allowing households to barriers that had previously barred the exit of a
relocate without switching jobs. large share of the tax base.
12 Census Bureau, January 2021.
13 National Association of Home Builders, 2013.
14 Carlyle Analysis, Census Bureau, America Communities Survey, 2020. 15
15 “Oracle moving headquarters to Austin, Texas, joining other tech companies in California exodus,” December 11, 2020.
Figure 16. Source: Carlyle Analysis; Federal Reserve Bank of St. Louis. Census Bureau. There is no guarantee these trends will continue.Jason Thomas
HEAD OF GLOBAL RESEARCH
jason.thomas@carlyle.com / (202) 729-5420
Jason Thomas is the Head of Global Research at The Carlyle Group, focusing on economic and statistical
analysis of Carlyle portfolio data, asset prices and broader trends in the global economy. He is based in
Washington, DC.
Mr. Thomas serves as Economic Adviser to the firm’s Global Private Equity and Global Credit Investment
Committees. His research helps to identify new investment opportunities, advance strategic initiatives
and corporate development, and support Carlyle investors.
Prior to joining Carlyle, Mr. Thomas was Vice President, Research at the Private Equity Council. Prior to
that, he served on the White House staff as Special Assistant to the President and Director for Policy
Development at the National Economic Council. In this capacity, Mr. Thomas served as primary adviser
to the President for public finance.
Mr. Thomas received a BA from Claremont McKenna College and an MS and PhD in finance from George
Washington University, where he studied as a Bank of America Foundation, Leo and Lillian Goodwin
Foundation, and School of Business Fellow. Mr. Thomas has earned the chartered financial analyst
designation and is a Financial Risk Manager certified by the Global Association of Risk Professionals.
16You can also read


