Kentish Town Planning Framework Future Transport Context - Transport for London City Planning Issued to Camden 12.07.2019
←
→
Page content transcription
If your browser does not render page correctly, please read the page content below
Kentish Town
Planning Framework
Future Transport Context

Transport for London
City Planning
Issued to Camden
12.07.2019
2

Contents
Executive Summary ......................................................................................................................... 4
Introduction .................................................................................................................................... 6
Context ........................................................................................................................................... 7
   Growth Potential ......................................................................................................................... 7
   Local Context .............................................................................................................................. 8
   Trip Patterns ................................................................................................................................ 9
Healthy Streets and Vision Zero .................................................................................................... 10
   Healthy Streets Approach.......................................................................................................... 10
   Vision Zero ................................................................................................................................ 10
   Mayor’s Transport Strategy Indicators ....................................................................................... 11
Walking and Cycling Connections .................................................................................................. 14
   Walking ..................................................................................................................................... 14
       Pedestrian Density ................................................................................................................. 14
       Walking potential ................................................................................................................... 16
   Cycling ...................................................................................................................................... 18
       Current Cycle flows ............................................................................................................... 18
       Cycling Potential .................................................................................................................... 19
       Future Changes to the network.............................................................................................. 21
   Safety and Vision Zero............................................................................................................... 23
Public Transport ............................................................................................................................ 25
   Public Transport Access Levels ................................................................................................. 25
   Buses ........................................................................................................................................ 26
       Bus Services .......................................................................................................................... 26
       Bus Demand .......................................................................................................................... 27
   Underground and Rail ................................................................................................................ 28
       Step-free access .................................................................................................................... 28
       Underground ......................................................................................................................... 29
       National Rail .......................................................................................................................... 30
Highway ........................................................................................................................................ 32
   Average Vehicle delay................................................................................................................ 32
   Junction volume to capacity ratio .............................................................................................. 33
Future Years .................................................................................................................................. 34
   Cycling forecast ......................................................................................................................... 34
   Future changes to the network .................................................................................................. 37
       Rail Services ........................................................................................................................... 37
       Stations ................................................................................................................................. 37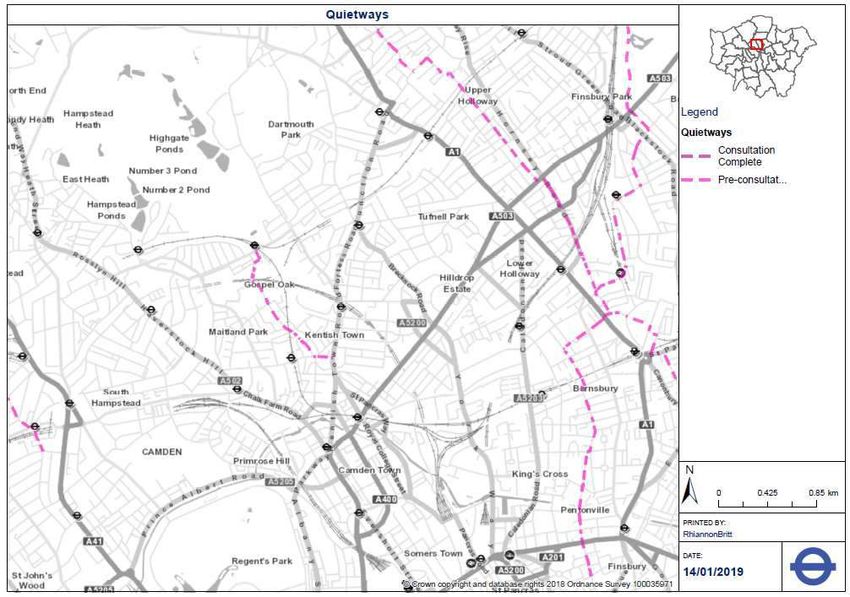
3
   Highways forecast: .................................................................................................................... 38
Conclusion .................................................................................................................................... 39
Appendices ................................................................................................................................... 40
   Appendix I: Data descriptions of the MTS indicators .................................................................. 40
   Appendix II: Data Dictionary ...................................................................................................... 41
   Appendix III: Cynemon forecasting assumptions ....................................................................... 42
   Appendix IV: LoHAM Network .................................................................................................. 44
   Apendix V: Forecasting assumptions for Strategic Model Suite .................................................. 45

© Transport for London 2019

All rights reserved. Reproduction permitted for research, private study and internal circulation
within an organisation. Extracts may be reproduced provided the source is acknowledged.

Disclaimer

This publication is intended to provide accurate information. However, Transport for London (TfL)
and the authors accept no liability or responsibility for any errors or omissions or for any damage or
loss arising from use of the information provided.
4

Executive Summary

Context

The London Borough of Camden (LBC) is developing a planning framework for Kentish Town. The
area has the potential for a new neighbourhood with a mix of employment, residential and
community uses alongside new parks and open spaces. The site is located between Gospel Oak
and Kentish Town stations. This report explores the current and future transport context of the
development and surrounding area.

In terms of current mode share, Camden residents have a high walking mode share when compared
to the rest of Inner London, indicating that the majority of trips made from Camden are on foot.
Underground/DLR is the second most popular mode, followed by Bus/Tram and Car/Motorcycle.
The sustainable, active and efficient mode share (walking, cycling and public transport) for Camden
residents is 84.2 per cent. Camden council has set a target in their Local Implementation Plan to
increase this to 88 per cent by 2021.

The highest Mayoral Transport Strategy priorities for the site are Inclusive, Green, Active and
Quality.

Walking and Cycling Connections

Pedestrian density is highest around Kentish Town and Kentish Town West stations, leading South
down Kentish Town Road, indicating that there is a high level of walking around the stations. This
pedestrian density is among the highest in London. There is a relatively low current pedestrian
density around Gospel Oak station. Walking potential is higher in the places where pedestrian
density is currently low, including around Gospel Oak station and Tufnell Park station. This
indicates that there are trips in the proximity of these stations that are using motorised transport
but could feasibly be walked.

There is high cycling potential on Kentish Town Road and Fortess Road, potentially to connect
people to Kentish Town and Kentish Town West stations. There is much lower potential in the
residential regions to the West of the development. The actual cycling flow around the
development is forecast to increase around the development in 2031, in particular along Kentish
Town Road and Fortess Road.

Kentish Town Road is a hotspot for casualties on all transport modes. Given the Mayoral aspiration
within Vision Zero, this is a significant safety issue in the proximity of the development.
5

Public Transport

The development area has a high access level to public transport. In particular, the east of the
development has a very high PTAL due to its proximity to Kentish Town station. The west of the
development has a lower PTAL rating.

The development area is served by 8 buses per hour to the north, and 16 buses per hour to the
east. Kentish Town Road to the south east of the development is the highest served road in the
area with 34 southbound buses per hour. The south west of the development contains smaller
residential roads that are less well served by the bus network.

Crowding levels on Northern Line trains stopping at Tufnell Park and Kentish Town Stations is at
the highest level across the underground, with over five people standing per meter squared. This
shows that there is no extra capacity on the Northern Line at these stations. This crowding is
forecast at the same levels in 2031.

Trains on the Overground network stopping at Gospel Oak and Kentish Town West stations are
moderately busy, with two to three people standing per metre squared. The Kentish Town
Overground Line has slightly more standing capacity, with current crowding levels at one person
standing per meter squared. In 2031, these crowding levels are forecast to decrease slightly for the
Overground coming into Gospel Oak, and remain at the same levels for Kentish Town and Kentish
Town West stations.

Highway

The highway network surrounding the development is a highly congested area, with high delays on
Gordon House Road, Highgate Road, Kentish Town Road and Prince of Wales Road, this delay is
amongst the highest in London.
6

Introduction

This Future Tranport Context report has been produced to provide the strategic context for the
Kentish Town Planning Framework in the London Borough of Camden.

The proposed development, comprises an employment led mixed use neighbourhood, with a mix
of employment, residential and community users alongside new parks and open spaces.

This report sets out the strategic transport and development context for the Kentish Town
Planning Framework. It is not intended to replace the developer’s Transport Assessment, but
rather enhance their submission by providing a strategic picture of current and forecast conditions
on the local transport network against which the development and associated travel demand can
be viewed. It is also not intended to replace any advice or requirement given by the local transport
authority in the area.

This report uses datasets captured at a strategic London-wide, not local level, and therefore this
must be considered during interpretation.

This report has been prepared by Transport for London (TfL) officers on a ‘without prejudice’ basis
only. It should not be interpreted as indicating any subsequent Mayoral decision on any planning
application based on the proposed scheme.

This report contains an array of datasets and forecasting models. Further information on all
methods used can be found within the appendices or via the TfL website. In particular this report
makes use of the City Planner Tool. The City Planner Tool provides access to a library of spatial
data sets relevant to transport planning and delivery at TfL and is available to all Local Authorities.
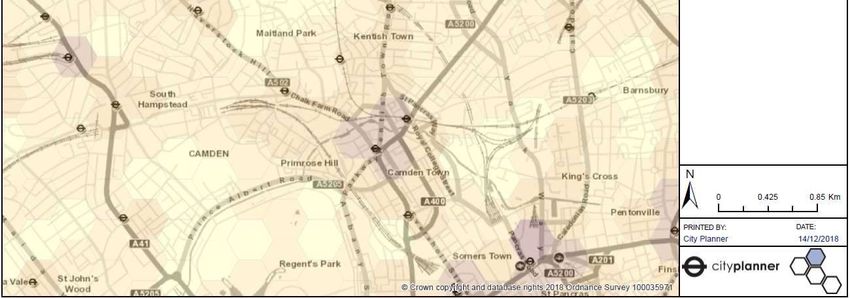
7

Context

Growth Potential

The London Borough of Camden (LBC) is proposing the development of a new neighbourhood in
Kentish Town with a mix of employment, residential and community uses alongside new parks and
open spaces. Figure 1 below shows the proposed area of the development.

There are two areas for development within the framework area: The Regis Road Site (shown in
orange in Figure 1) and what is known locally as The Murphy Site (shown in blue in figure 1). The
policy requirement for the development of each site is for it to be comprehensive, employment led
and coordinated.

The Council’s policy requires a comprehensive approach to redevelopment in this area: This could
mean increased housing numbers, the development of more affordable housing, an increase in
jobs, higher quality public realm and social and physical infrastructure. The Regis Road site is
allocated for residential and commercial development in the Local Plan and further guidance is
provided in the current planning framework. The Murphy’s site is protected for industrial use with a
potential scope for intensified mixed use.

LBC is aiming for a single masterplan and delivery approach for the whole area, however it may be
possible for two coordinated development plans: one for Murphy’s and one for the Regis Road site.
Plot by plot or piecemeal redevelopment proposals will be resisted as a comprehensive approach
allows greater flexibility to support business retention, continuity and holistic construction
management.
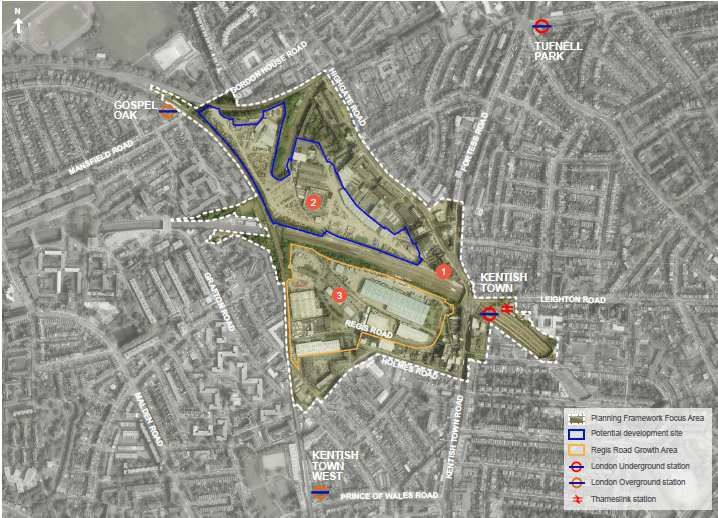
8

Figure 1. Proposed development area

The development plan states that it will be delivered by 2028, therefore for the purposes of this
report, the standard TfL forecasting year of 2031 has been used where appropriate as the nearest
approximate.

Local Context

The site is located within the London Borough of Camden. The site has good public transport links,
as Gospel Oak station is to the North West, Tufnell Park station to the North East, and Kentish
Town West station to the South. Kentish Town station is contained within the East of the site area.
The Murphy Site (highlighted in blue in figure 1) is bound to the North, West and Southern sides by
railway lines, this restricts access to the site to the North and East. The tip of the Northern end of
the site borders Hampstead Heath Park.

The Regis Road site (highlighted in orange in figure 1) is bound by the overground railway line to the
West and the National Railway line to the North. Access to this site is also currently limited due to
these rail lines.
9

Currently this area comprises Kentish Town Business Park. Murphy established its headquarters in
1984, in the Murphy site, and still remains on the site to this day. The Regis Road site includes
logistics, light manufacturing and media companies, as well as a mix of other businesses.

The local area surrounding the development is predominantly residential. There are a number of
small retail high streets also located around the development; Queens Cresent, Fortress Road and
Kentish Town Road. Within a 20 minute walk of the development area are two nurseries, seven
primary schools and six secondary schools.

Trip Patterns

The current area trip share by mode made by residents is shown below in Table 1.2

Table 1. Londoners' trips by borough of residence, and % shares by main mode, average day
                            (7 day week), 2015/16 to 2017/18.1

                   National        Underground/      Bus/        Taxi/     Car/       Cycle   Walk    All
               Rail/Overground         DLR           Tram        Other   Motorcycle                  modes

Camden               3.3               16.8           12.9        3.0       12.7       3.2    48.0   100.0

Inner                5.7               12.9           16.0        2.4       20.9       3.8    38.3   100.0
London

Table 1 shows the trips per day completed by Camden residents, broken down by how they travel.
The same information for the residents of Inner London is also shown for comparison. The
sustainable, active and efficient mode share (walking, cycling and public transport) for residents of
Camden Council is 84.2 per cent. The target for Camden council is to increase this to 88 per cent
by 2021. Camden residents have a much higher walking mode share than the inner London total,
indicating that the majority of trips made from Camden are on foot. Underground/DLR is the
second most popular mode, followed by Bus/Tram and Car/Motorcycle.

Given that this development is likely to be in part residential, the number of trips per day can be
expected to increase. If they follow a similar pattern to the existing mode share, approximately half
of the residents from the development are likely to be walking to their destinations.

1   Source: LTDS 2016/17 Strategic Analysis, TfL City Planning
2   Source: LTDS 2016/17 Strategic Analysis, TfL City Planning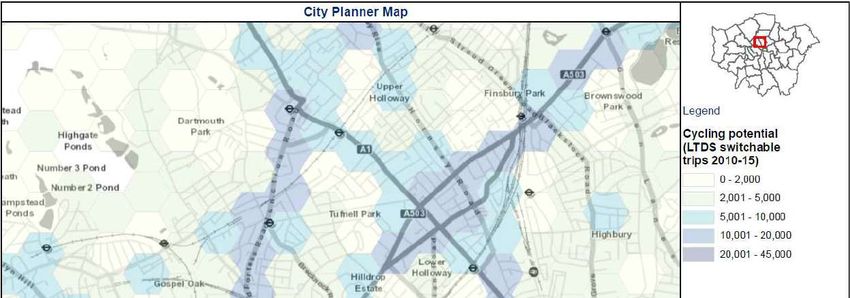
10

Healthy Streets and Vision Zero

Healthy Streets Approach

TfL and the Mayor have launched the Healthy Streets Approach3, which aims to improve air quality,
reduce congestion and make attractive places to live, work and do business. There are 10 Healthy
Streets indicators,4 which put people and their health at the heart of decision making, and aim to
result in a more inclusive city where people choose to walk, cycle and use public transport. TfL
expects all developments to deliver improvements that support the 10 Healthy Streets indicators,
in line with draft new London Plan Policy T2. 5

TfL will expect all elements of this scheme, including land use, density, layout, public realm,
vehicular circulation, infrastructure for walking and cycling – to contribute positively to modal shift
and minimise car dependency. A significant element of Healthy Streets is about people spending
time in streets and other public space, and how that space functions for them, as well as the
experience of moving through a street. The Healthy Streets approach should be considered in any
masterplanning, as such, resources for planning and construction can be found on the TfL
website.6

Vision Zero

Vision Zero is the Mayor’s assertion that no death or serious injury on London’s transport networks
is acceptable or inevitable. TfL has a target to eliminate all deaths and serious injuries from
London’s transport by 2041. The Vision Zero plan takes an internationally recognised approach to
road danger reduction, based on the principle that life and health should not be compromised by
the need to travel.7 The goal is to ensure that a collision doesn’t happen in the first place, or, if it
does occur, it is sufficiently controlled to not cause death or serious injury.

The approach will focus around the following five areas of action:
    •   Safer speeds – encouraging speeds appropriate to the streets of a busy and populated city
    •   Safer streets - designing an environment that is forgiving of mistakes
    •   Safer vehicles – reducing risk posed by the most dangerous vehicles
    •   Safer behaviours – reducing the likelihood of making mistakes or behaving in a way that is
        risky for yourself and other people
    •   Post-collision response – learning from collisions and improving

3 http://content.tfl.gov.uk/healthy-streets-for-london.pdf
4 http://content.tfl.gov.uk/guide-to-the-healthy-streets-indicators.pdf
5 https://www.london.gov.uk/what-we-do/planning/london-plan/new-london-plan/draft-new-london-plan/
6 https://tfl.gov.uk/info-for/urban-planning-and-construction/urban-planning-and-construction-resources
7 http://content.tfl.gov.uk/vision-zero-action-plan.pdf
11
Mayor’s Transport Strategy Indicators
The Mayor’s Transport Strategy (MTS)8 sets out the Mayor’s policies and proposals to reshape
transport in London over the next two decades. The MTS outcome indicators are a measure of how
a particular area is currently performing against these priorities. They are created by combining
scored datasets determined to be representative of each outcome. The indicators can be used to
explore the outcome spatially and compare areas. The indicators are a representation only. A
higher score represents a higher relative priority location for that indicator, so if an area scores
highly in the Active indicator, this indicates that it is a priority to increase the level of active travel.
London has been divided into 350m diameter hexagons to show the average score for an area.
Indicators are calculated by averaging the scores of the contributing datasets over these 0.11km2
hexagons. Scores are assigned (from 0 to 5) from London wide percentile ranks, therefore the
scores represent relative priorities with 5 being the highest priority and 0 being the lowest priority.
MTS indicators have been calculated for the area and include:
• Active – Walking and cycling current levels and potential
• Safe – Casualty rates and reported crime risk
• Green - NO2 and PM10 levels
• Efficient – Freight levels and car dependency
• Connected - Public Transport Access Levels (PTALs) and 45 minute employment
catchments
• Inclusive – Step free accessibility differential
• Quality – Bus demand, provision and performance
• Sustainable – Car dependency and Public Transport Acces Levels (PTALs)
• Unlocking Development – Projected population and employment growth (2041)
8 https://tfl.gov.uk/corporate/about-tfl/the-mayors-transport-strategy12
MTS Indicators have been calculated for the site, borough and sub-region and are tabulated in
Table 2 below. Details of the datasets used for the indicators can be found in Appendix 1.
Table 2. MTS Outcome Indicator scores for the proposed development site, The London borough
of Camden, and the central sub region within London.
Priority scores from 0-5
Where 5 is the highest priority and 0 is the lowest priority
MTS Outcomes Area
Indicators
Central Sub-Region Camden Site9
Active 3.5 3.5 3.8
Safe 1.6 1.4 1.5
Green 4.4 4.3 4.3
Efficient 2.2 2.2 1.7
Connected 0.7 0.7 0.4
Inclusive 3.8 4.3 4.8
Quality 3.2 3.1 3.4
Sustainable 1.4 1.6 1
Unlocking
Development 2.9 2.8 1.8
As shown in Table 2, the highest priorities for the site are Inclusive, Green, Active and Quality.
9 The site here is defined as the area surrounding the development as shown in Figure 213 The Active indicator demonstrates the current levels of walking and cycling, given that this is shown as a high priority for the borough and the site, this means that more walking and cycling can be encouraged. As mentioned above, the cycling mode share in the area is relatively low for Inner London, therefore this presents an opportunity to encourage more cycling. Although the car/motorcycle mode share in Table 1 is relatively low, the Green indicator shows that the air quality in the area is a high priority. The Inclusive outcome indicator shows the difference in travel time and accessible jobs from step free and not step free routes. This has been shown to be a high priority in the area. The Quality indicator shows the level of bus service in the area. Given its industrial background, this development is likely not currently sufficiently served by the bus network. More detail on the bu service is detailed in the Public Transport section of this report.
14

Walking and Cycling Connections

Walking
Pedestrian Density

Pedestrian density is derived from the London Travel Demand Survey (LTDS). The walking trips and
stages recorded in the LTDS can be used to estimate the amount of walking undertaken by London
residents. The pedestrian density represents the total distance walked per hexagon cell per day.
Figure 2 shows the pedestrian density surrounding the development area at hex level. A higher
pedestrian density indicates that there has been a higher level of walking in that area.

Pedestrian density is highest around Kentish Town and Kentish Town West stations, leading South
down Kentish Town Road, indicating that there is a high level of walking around the stations. This
pedestrian density is among the highest in London. Kentish Town station would likely serve the
development area, therefore this density is likely to increase. There is a relatively low current
pedestrian density around Gospel Oak station.
15
Figure 2. Pedestrian density per day
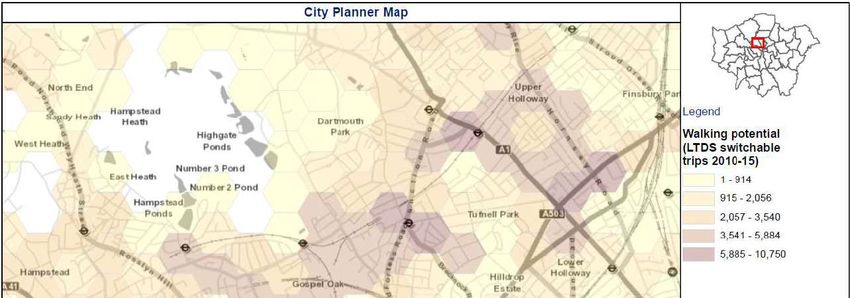
16

Walking potential

Walking potential is also derived from the London Travel Demand Survey (LTDS). The data
represents trips made by London residents which could reasonably be walked all the way, but are
not walked at present. The walking potential surrounding the development area is shown in figure
3.

Walking potential is higher in the places where pedestrian density is currently low, including around
Gospel Oak station and Tufnell Park station. This indicates that there are trips in the proximity of
these stations that are using motorised transport but could feasibly be walked. This walking
potential is amongst the highest in London.
17
Figure 3. Walking Potential per day
18
Cycling
Current Cycle flows

Current cycle flows are modelled by TfL’s strategic model; Cynemon, using a sample of count data.
More information on Cynemon can be found in appendix III. Figure 4 below shows the cycling flow
for the development area. From this diagram it is clear that there are a large number of cycle trips
made around the development area, particularly along Kentish Town road. Within the context of
London these flows are at a medium to high level.

Figure 4. Cycle flow 2014 – AM peak
19
Cycling Potential

Cycling potential is derived from the London Travel Demand Survey (LTDS) and the routes are
assigned to the network using Cynemon. More information can be found in Appendix III.

Figure 5 shows a map of the cycling potential around the proposed development. Cycling potential
represent trips made by London residents which could reasonably be cycled but are not cycled at
present.

There is high cycling potential on Kentish Town Road and Fortess Road, potentially to connect
people to Kentish Town and Kentish Town West stations. This cycling potential is amongst the
highest in London. There is much lower potential in the residential regions to the West of the
development.
20
Figure 5. Cycling Potential per day
21

Future Changes to the network

TfL maintains a dataset of proposed and committed strategic transport schemes that will make
changes to the network. Figure 6 below shows that one of these schemes is a proposed Cycle
Quietway, shown in pink. This route is planned to run between Kentish Town station and Gospel
Oak station; a public consultation of this scheme is expected in early 2020. If approved, it is likely
that work will commence in 2021.
22
Figure 6. Proposed future cycle schemes
23

Safety and Vision Zero

When considering walking and cycling connections, it is also important to consider the safety of the
area in question. TfL collects all modal casualty data, Figure 7 below shows the total count of killed
or seriously injured (KSI) casualties from 2014 to 2016.

From this map, it is clear that Kentish Town Road is a hotspot for casualties. This figure follows a
similar pattern to the pedestrian density shown in Figure 2. Given the Mayoral aspiration within
Vision Zero, this is a significant safety issue in the proximity of the development.
24

Figure 7. All modes KSI casualties
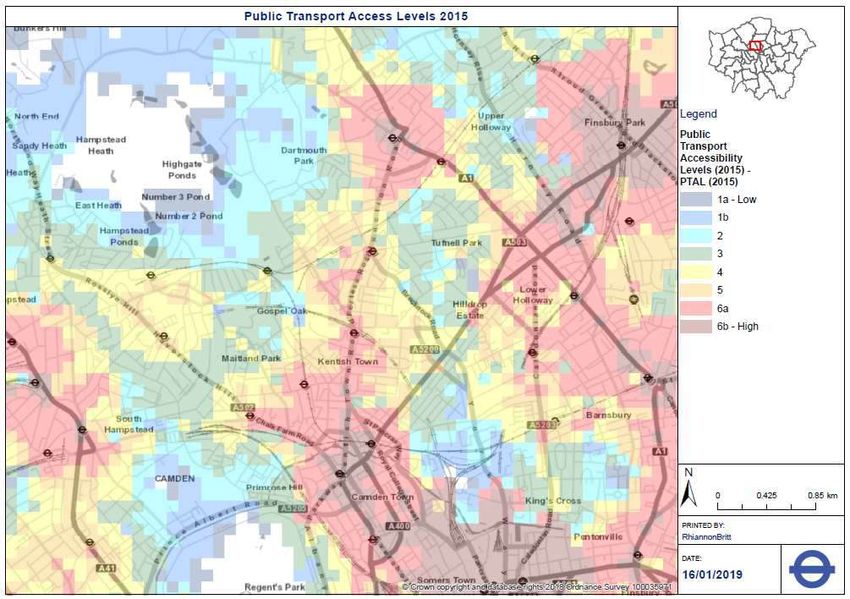
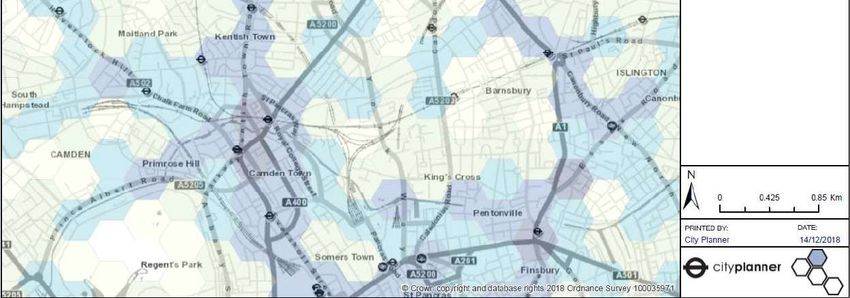
Public Transport
Public Transport Access Levels

Public Transport Access Level (PTAL) is a measure of the connectivity of an area to public
transport. The Public Transport Access Index (PTAI) is the calculated index behind categorised
PTAL values. Figure 8 below shows the PTAL values for the development and surrounding area.

The development area itself has a high access level to public transport. In particular, the east of the
development has a very high PTAL due to its proximity to Kentish Town station. The west of the
development has a lower PTAL rating.

Figure 8. Public Transport Access Levels (2015)
Buses
Bus Services

The mode share shown for trips in Table 1 shows that buses are an important mode for Camden
residents. Therefore, it is important to understand the current bus service to the development.
Figure 9 below shows the bus frequency map for the area during the morning peak.

Gordon House Road, Highgate Road and Kentish Town Road border the north east of the
development and are well served by the bus network. The south west of the development contains
smaller residential roads that are less well served by the bus network.

The development area is served by 8 buses per hour to the north, and 16 buses per hour to the
east. Kentish Town Road to the south east of the development is the highest served road in the
area with 34 southbound buses per hour.

Figure 9. Map showing bus frequencies per hour during the morning peak (07:00 – 10:00).
Bus Demand

Along with the bus frequency, it is important to consider the volume of people using these routes.
Bus loadings in the AM peak, shown in figure 10 below, show how many people kilometres are
travelled. People kilometres are calculated by summing the bus passenger loading (number of
people) multiplied by the route length to calculate total people km on the bus network for the hex
cell. The corridor along Kentish Town Road from Kentish Town Station has a high number of
boardings, amongst the top 7% in Central and Inner London.

Figure 10. People kilometres by bus AM peak 2016 (07:00 – 10:00).
Underground and Rail

The Planning Framework area includes four stations:
       •   Gospel Oak – served by the Overground Network
       •   Tufnell Park – served by the Northern Line
       •   Kentish Town – served by the Northern Line and Thameslink
       •   Kentish Town West – served by the Overground Network

Step-free access

A full step-free tube map can be accessed from TfL’s website.10 Of the four stations surrounding
the development, Gospel Oak is the only station to have step-free access. Trains from this station
are able to be accessed by a manual boarding ramp. The other stations surrounding the
development are currently not on the step-free network. Transport for London are working on a
programme of improvements to the network as shown in figure 11.

Figure 11. TfL programme of improvements to step-free network. (July 2019)

10   https://tfl.gov.uk/transport-accessibility/wheelchair-access-and-avoiding-stairs
Underground The Northern line Underground Stations; Tufnell Park and Kentish Town serve the development area. As the underground network makes up a large proportion of the mode share for Camden residents, it is vital to understand current crowding on the line, and how a development might impact this. Figure 12 below shows the crowding map for the AM peak. As shown below, the crowding on trains stopping at Tufnell Park and Kentish Town Stations is at the highest level across the underground, with over five people standing per meter squared. This shows that there is no extra capacity on the Northern Line at these stations. Figure 12. Underground and DLR Crowding map in the AM peak 2011 (07:00 – 10:00).
National Rail

Kentish Town, Kentish Town West and Gospel Oak Stations are all served by National Rail. The
crowding map for rail lines is shown in figure 13 below.

   Figure 13. National Rail and Tram Crowding map in the AM peak 2011 (07:00 – 10:00).

Figure 13 shows that in the morning peak, trains stopping at Gospel Oak and Kentish Town West
stations are moderately busy, with some standing capacity available. The Kentish Town
Overground Line has slightly more standing capacity, in sharp contrast to the Underground
counterpart.

Table 3 shows the origin destination data for trips boarding and alighting at Kentish Town West and
Gospel Oak stations. This table shows that the majority of trips from both stations are to
destinations on the North London Overground Line. Similarly most trips to both stations are made
by trips starting elsewhere on the North London Line.
Table 3. 2013 Weekday AM Peak matrix output, Overground trips. Covers time period from 07:00 to 09:59
Sub Total - Gospel Oak to Barking
Sub Total - North London Line
Sub Total - West London Line
Sub Total - East London Line
Sub Total - Watford DC
Alights
KentishTownWest
GospelOak
Totals
Boards
Sub Total - East London Line 49,032 2,422 87 55 3,441 27 14 54,936
Sub Total - West London Line 2,439 11,916 198 75 3,012 61 1,007 18,434
GospelOak 83 125 0 103 1,219 135 27 1,589
KentishTownWest 54 49 107 0 679 33 11 826
Sub Total - North London Line 9,792 4,430 2,244 1,191 41,662 825 1,009 57,718
Sub Total - Gospel Oak to Barking 92 138 487 114 1,835 5,422 29 7,517
Sub Total - Watford DC 35 1,948 97 37 1,521 30 7,131 10,665
Totals 61,390 20,854 3,114 1,474 51,471 6,365 9,190 149,270
The same data are not available for rail services at Kentish Town Station , however, entry and exit
to and from the station by mode is available in Table 4. The vast majority of trips to and from
Tufnell Park and Kentish Town stations are walked, again highlighting the importance of walking to
this development.
Table 4. Transfers into and out of Kentish Town and Tufnell Park Stations based on survey data up to 2017
Car/Van
Entry/Exit NR/DLR/ Bus/ Car/Van driven Taxi/ Not Total all
from Tram Coach Bicycle Motorcycle Parked away Walked Minicab Stated modes
Kentish
822 471 20 0 7 31 2508 0 83 3942
Town Entry
Kentish
1231 214 0 0 0 0 2521 0 17 3983
Town Exit
Tufnell
0 8 0 0 0 3 211 0 0 222
Park Entry
Tufnell
0 3 0 0 0 0 637 0 0 640
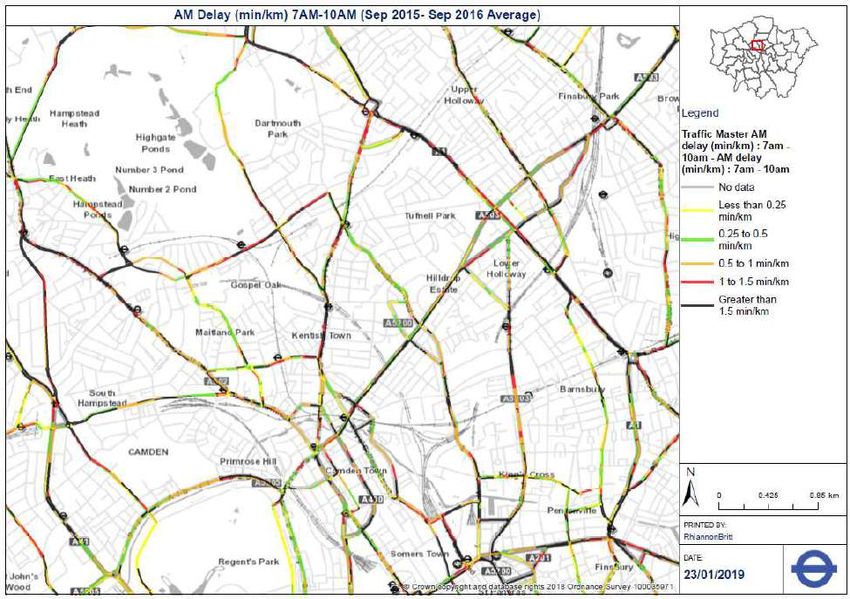
Park ExitHighway Average Vehicle delay The delay on the Integrated Road Network (ITN) surrounding the development is shown below in figure 14. The ITN is a detailed geographic link and node representation of the road network in Great Britain maintained by the Ordenance Survey. This delay measurement is based on the peak time speed compared to the night time speed, measured in minutes per kilometre. Figure 14. AM Peak Delay on the ITN Network 2015-2016 (07:00 – 10:00). There is a high delay on Gordon House Road, Highgate Road, Kentish Town Road and Prince of Wales Road, this delay is amongst the highest in London.
Junction volume to capacity ratio

An alternative way to understand the congestion is by visualising the ‘pinch points’ on the highway
network. Figure 15 looks at the junction volume to capacity ratio for the network surrounding the
development in 2015 AM peak. This ratio was calculated from TfL’s LoHAM model, which uses a
simplified version of London’s road network. The included roads are shown in Appendix IV. The
junction volume to capacity ratio is the ratio of traffic volume to junction capacity expressed as a
percentage. A volume to capacity ratio of greater then 80% will result in increasing delay at the
junction. A ratio of greater than 90% indicates a junction close to capacity with significant delay
likely. From figure 15 it is clear that there is currently high delay at the junction between Gordon
House road and Highgate round at the North East corner of the development.

Figure 15. Junction Volume to Capacity ratio AM Peak 2015 (07:00 – 10:00).
Future Years

Any development must look ahead to future years to understand how the transport pattern may
change. TfL’s suite of forecasting models provides strategic insight into these key changes in
transport. The London Transport Studies (LTS) model is Transport for London’s strategic transport
demand framework. This model is used to forecast demand patterns across the capital in response
to changing socio-economic conditions as well as supply side assumptions. The model has been
employed here to produce transport demand estimates for a 2031 future year based on London
Plan levels of population and employment growth as well as funded commitments for the
transport network. Details of the assumptions that are included in these forecasts are outlined in
Appendices III, IV and V.

Cycling forecast

TfL’s Cynemon model is a strategic cycling model which estimates the number of cyclists, their
routes and journey times across London. Figure 16 shows the predicted change in cyclist flow from
2014 to 2031. As indicated by the blue lines, cycle flows are predicted to increase almost without
exception around the development. In particular, Kentish Town Road and Fortess Road have the
highest increase in cycle trips over the time period.
Figure 16. Cycle flows 2031
Public Transport Forecast
Crowding maps equivalent to those in Figure 12 and 13 above can be predicted for 2031. The
crowding map on the London Underground in figure 17 shows that the crowding at key stations
remains at maximum capacity at >5 standing/m2. The stations before Tufnell Park and Kentish
Town are predicted to all increase in crowding, meaning that this is likely to prevent passengers
from boarding at Tufnell Park and Kentish Town stations.

Figure 17. Forecast Underground and DLR Crowding map in the AM Peak 2031
The National Rail crowding map shown in figure 18 forecasts that there will be a slight decrease in
crowding on trains moving in to Gospel Oak station, freeing up one to two standing spaces per
metre squared. This is most likely due to the line upgrades described in the following section.
Crowding on trains passing through Kentish Town West remain moderately crowded in line with
2011 levels. There is an increase in crowding from Kentish Town into Central London.

Figure 18. Forecast National Rail and Tram Crowding map in the AM Peak 2031
Future changes to the network
 Rail Services

 A number of upgrades to the Northern Line and London Overground services are scheduled to be
 in place by 2031.These are taken into account in the above forecasts and shown in Table 5.

Table 5. Upgrades to Northern and Overground lines expected between 2011 and 2031

 Line                 Description                                                   Status
 Northern             PPP Upgrade Phase 1 (Signalling upgrades)                     Complete

 Northern             PPP Upgrade Phase 2 (revised service                          Not complete
                      patterns)
 London               Gospel Oak – Barking Electrification and                      Partially
 Overground           Longer Trains (4 car)                                         complete
 London               Overground – extent all Class 378’s to 5 car                  Complete
 Overground
 London               Overground SLC3 – East London Line Phase                      Complete
 Overground           2b to Clapham Junction

 The Northern Line service changes include signalling upgrades and revised service patterns,
 however these will not have an impact on the capacity of the Northern Line. Therefore, as
 mentioned previously, shifts to other modes, particularly active travel, will be essential.

 The Overground (North London Line) upgrades however, will increase the frequency to 10 trains
 per hour through Gospel Oak and Kentish Town West stations. This will be an increase of two
 trains per hour on current levels. This will have an impact on capacity, allowing for an additional
 4,200 passengers.

 Stations

 Kentish Town, Gospel Oak and Kentish Town West Overground stations appear to have no
 significant capacity issues , and there has been no congestion relief schemes developed in the
 recent past. There are no current plans to upgrade infrastructure or capacity of these stations.

 It is worth noting that Network Rail’s Anglia Route Study11 stated the following:
 Kentish Town West – “Very narrow steps, new steps could be provided relatively easily.”
 Gospel Oak – “Interchange between Overground services is the key issue. New steps have recently
 been provided to give extra capacity.”

 11   https://cdn.networkrail.co.uk/wp-content/uploads/2016/11/Anglia-Route-Study-UPDATED-1.pdf
Highways forecast: A Junction volume to capacity ratio plot can also be forecast for year 2031, shown here in Figure 19. This shows a slight increase in congestion in junctions around the area, with the Gordon House Road and Highgate Road junction remaining congested. Figure 19. Forecast Junction Volume to Capacity ratio AM Peak 2031
Conclusion

    Report
  Summary
MTS
              Area
Outcomes                 Current context                                Conclusion
              Priority
Indicators
                         Pedestrian density in the surrounding area
                         is high to the east but lower to the west.
                                                                        Walking and cycling should
                         Walking Potential is high where current
Active        High                                                      be encouraged through
                         pedestrian density is low. Current cycling
                                                                        provision of infrastructure
                         levels are relatively low, but are forecast
                         to increase

                         There is a small hotspot of KSI incidents      Actively design to avoid
Safe          High
                         around Kentish Town station                    incidents

                         There very high levels of air pollution
              Very                                                      Development should reduce
Green                    surrounding the development, some of
              High                                                      current levels
                         the highest levels in London
                                                                        Discourage the use of cars
                     There is high congestion in the area, it is
                                                                        and promote active modes.
                     not clear how much this is due to freight
Efficient     Medium                                                    Take into account where
                     levels, and how much this is due to private
                                                                        freight routes may pass
                     car ownership
                                                                        close to the development
                         Area is very well connected due to the         Development should seek
                         bus, tube and rail links. However the          to encourage the use of
              Very
Connected                Northern line is at full capacity, therefore   other modes, particularly
              Low
                         more demand will increase waiting times        active modes, in line with
                         at stations                                    the MTS
              Very       There is a lack of step free access in this    Development should have
Inclusive
              High       area                                           step free access
                         Bus frequency to the area means that bus       Where possible encourage
Quality       High
                         loading is often high                          shift to active travel
                         The development area has high PTAL
                         levels, particularly to the East of the
              Very                                                      Discourage the use of cars
Sustainable              development. There is not a high
              Low                                                       and promote active modes
                         dependency on cars from Camden
                         residents
                                                                        Pedestrian and cycle
                     Projected population and employment
                                                                        enhancement is key to
Unlocking            growth is relatively low compared to the
              Medium                                                    unlocking the development
Development          rest of London, but a high priority for the
                                                                        given the public transport
                     Council
                                                                        constraints
Appendices
Appendix I: Data descriptions of the MTS indicators
Mayoral Transport Strategy (MTS) outcome indicators are created by combining scored datasets determined
to be representative of each outcome. The indicators can be used to explore the outcome spatially and
compare areas. The indicators are a representation only. A higher score represents a higher relative priority
location. Indicators are calculated by averaging the scores of the contributing datasets for each hex cell.
Scores are assigned (from 0 to 5) from GLA wide percentile ranks. When multiple hex cells are combined the
scores of the contributing datasets are averaged for the selection. Table Ia below shows how each of the
indicators is calculated.
Table Ia. MTS Indicator description
MTS Indicator Data description
The Active outcome indicator is the combination of scored Modelled cycle flow (AM
MTS Active 2014), Cycling potential (LTDS switchable trips 2010-15), Pedestrian density (2005-
Outcome 16), Walking potential (LTDS switchable trips 2010-15), Residents completing 2 x 10
min active travel trips (average day 2005/06 to 2015/16).
The Safe outcome indicator is the combination of scored All modes total casualties
MTS Safe Outcome
(2014 to 2016) and Street Crime Rate (2014-15).
MTS Green The Green outcome indicator is the combination of scored N02 levels (μg/m3, 2020)
Outcome and PM10 levels (μg/m3, 2020).
The Efficient outcome indicator is the combination of scored Modelled freight flow
MTS Efficient
(AM 2012), Car/van accessibility per household (ONS Census 2011) and Modelled
Outcome
car/taxi flow (AM 2012).
The Connected PT outcome indicator is the combination of scored Average PTAI
MTS Connected PT 2015, Jobs accessible in a 45 min journey 2011 (Jobs 2011 PT 2011), Population
Outcome accessible in a 45 min journey 2011 (Popn. 2011 PT 2011) and Households
accessible in a 45 min journey 2011 (HH2011, PT 2011).
The Inclusive PT outcome indicator is the combination of scored Average travel time
MTS Inclusive PT
2015 step free vs. not step free % diff, Jobs accessible 2015 step free vs. not step
Outcome
free % diff and Population accessible 2015 step free vs. not step free % diff.
The Quality PT outcome indicator is the combination of scored Bus oyster boardings
MTS Quality PT
(15/16), Bus scheduled km (AM 11/11/2016) and Bus speed change % (AM 14/15-
Outcome
16/17).
The Sustainable Travel outcome indicator is the combination of scored Car/van
MTS Sustainable
accessibility per household (ONS Census 2011), Modelled car/taxi flow (AM 2012)
Travel Outcome
and Average PTAI 2015.
MTS Unlocking The Unlocking Development outcome indicator is the combination of scored
Development Population change 2011 to 2041 (LTS v7.1) and Employment change 2011 to 2041
Outcome (LTS v7.1).Appendix II: Data Dictionary
Table IIa below shows
Pedestrian The LTDS collects travel pattern data from ~17,000 persons a year including details of all
Density trips undertaken the day before the interview. Pedestrian stages from survey years 2005 to
2016 have been included in this dataset. The data is aggregated by summing stage lengths
per cell, is weighted to represent all Londoners, and uplifted for route wiggle and non-
residents. When multiple hex cells are combined the data is averaged. The data is sorted
descending with highest rank (1) and highest percentile (1) assigned to the cell with the
greatest pedestrian density.
Walking Walking potential is derived from the London Travel Demand Survey (LTDS). The data
Potential represents trips made by London residents which could reasonably be walked all the way
but are not walked at present. The LTDS collects travel pattern data from ~17,000 persons
a year including details of all trips undertaken the day before the interview. Pedestrian
stages from survey years 2010 to 2015 have been included in this dataset. The data is
aggregated by plotting walking trips along the road network (ITN) and summing the length of
these trips per cell. The trips have been weighted to represent all of London. When
multiple hex cells are combined the data is summed. The data is sorted descending with
the highest rank (1) and highest percentile (1) assigned to the cell with the greatest walking
potential.
Cycling The LTDS collects travel pattern data from ~17,000 persons a year including details of all
potential trips undertaken the day before the interview. Cycle stages from survey years 2010 to 2015
have been included in this dataset. The trips have been weighted to represent all of
London. The Cynemon assigned link data is aggregated by summing the total distance
cycled per cell (cyclists x distance). When multiple hex cells are combined the data is
summed. The data is sorted descending with the highest rank (1) and highest percentile (1)
assigned to the cell with the greatest cycling potential
KSI The data is collected for the whole of London. Further information about casualty data can
Casualties be found at: https://tfl.gov.uk/corporate/safety-and-security/road-safety/london-collision.
Data has been aggregated by summing the number of casualties per hex cell. When multiple
hex cells are combined the data is summed. The data is sorted descending with the highest
rank (1) and highest percentile (1) assigned to the cell with the greatest casualty count. The
dataset has 15,041 cells (whole of GLA).
PTAL The Public Transport Access Index (PTAI) is the calculated index behind categorised PTAL
values. For any selected place, PTAI suggests how well the place is connected to public
transport services. A location will have a higher PTAI if; It is at a short walking distance to
the nearest stations or stops, waiting times at the nearest stations or stops are short, more
services pass at the nearest stations or stops, there are major rail stations nearby, or any
combination of these. For this dataset overall PTAI is aggregated by averaging (area
weighted) PTAI values within each hex cell. When multiple cells are combined the data is
averaged. The data is sorted ascending with the highest rank (1) and highest percentile (1)
assigned to the cell with the lowest PTAI.
Average Network of Interest ITN links for London showing average speed, delay and journey time
vehicle stats for the AM, Inter and PM Peak periods. The data is based on weekday TrafficMaster
delay GPS journey time data for the 2015-16 annualised data. The delay measurement is the peak
speed compared to the night time speed (10pm to 6am free flow) measured in minutes per
km. Where a link has no night time observations the speed limit has been used as a
measure of free flow.Appendix III: Cynemon forecasting assumptions
TfL’s Cynemon model is a strategic cycling model which estimates the number of cyclists, their routes and
journey times across London. Its development was based on TfL count and travel diary data sources
combined with mobile phone app data and bespoke research.
Cynemon is a strategic model, and therefore has been developed to represent strategic movements of
cyclists and journey times at a total route level. The model should not be expected to validate well in every
area at a very local level and whenever Cynemon is used for a new project, the model should be reviewed
and refined to ensure it is fit for the purposes required. The reasonable level of expectation from Cynemon
is that it is able to estimate the likely route choices of cyclists, and journey time from an origin to a
destination. Due to the uncertainty associated with model outputs, it is advisable that ranges are reported
rather than point values based on an understanding of the confidence associated with the various input
assumptions.
The development of the base year cycling demand made use of various observed data, such as London
Travel Demand Survey (LTDS), 2011 census journey to work, cycle hire data, and other origin-destination
datasets. In order to forecast the growth in cycling demand, there are three main contributing aspects:
• Background growth due to increases in population and employment
• Policy impacts:
o Route-based schemes, eg Cycle Superhighways, cycle lanes, Quietways
o Trip-end-based (or an area-based) schemes, eg cycle parking
• Growth due to other factors:
o The ‘push’ factors from increased cost and/or journey time in other modes
o Unexplained factor, such as general trend, that are not directly observed
The estimation of new trips due to policy impacts made use of the information from the Analysis of Cycling
Potential . The analysis looked at trips that are currently made by other modes (eg cars, public transport) but
have the potential to be cycled in the future, termed as ‘Potentially Cyclable Trips’ (PCT).
The cycling growth due to the ‘push’ from the increased cost/journey time in public transport and car use
was estimated using the cycling demand elasticities derived from the initial development of the New
Demand Model (NDM).
The growth as a result of some factors that currently cannot easily be explained by detailed observed data
was estimated using the ‘backcasting’ methodology. This method used the known data and cycling growth
between 2004 and 2014 and estimated cycling growth due to ‘unexplained’ factors.Figure A Cynemon Forecast Demand Development Process The following steps concisely explain the development of the forecast demand: • The base year demand (2014) was factored up to the forecast year (eg 2021) using increases in population (by age) and employment • The demand for Potentially Cyclable Trips (PCT) were developed using public transport and cars forecast demand from Railplan and London Highway Assignment Model (LoHAM) respectively, as well as the PCT information derived from London Travel Demand Survey (LTDS) data. These trips become the ‘pool’ of potential trips that can be cycled • Scheme impacts from cycling infrastructure were estimated using a methodology adapted from CYPET. New trips generated by the schemes were extracted from the PCT demand • Estimation of new cycling trips due to ‘push’ factors from increases in public transport and highway cost and journey time. These new trips were also extracted from the PCT demand • The backcasting exercise was carried out to determine the likely cycling growth due to unexplainable factors • The growth due to unexplained factors was applied and added to the overall cycling growth
Appendix IV: LoHAM Network

TfL’s suite of forecasting models includes a highway model; LoHAM. This model is able to predict
future traffic flow in London. Figure A below shows the road network that is included in this
modelling.

Figure B             Road network included in LoHAM modelling
Apendix V: Forecasting assumptions for Strategic Model Suite

Forecasting Assumptions
The following summarises the forecasting assumptions for the LTS model, which underpins public transport
and highway modelling.

Network and economic forecasting assumptions
The London Plan core reference case includes funded public transport and highway schemes consistent with
the 2017 TfL Business Plan12. A summary of key schemes is provided below:
       •   Current view of funded National Rail schemes, HLOS programme, Thameslink programme, HS2,
           West Anglia and Great Western improvements.
       •   The opening of the Elizabeth Line in 2019, the Northern Line Extension, and Tube upgrades to the
           Victoria Line and Four-Line Modernisation programme.
       •   DLR, Trams, London Overground and bus service improvements.
       •   TfL’s Healthy Streets portfolio including cycling infrastructure schemes and the introduction by
           2019 of the Central London Ultra Low Emission Zone (ULEZ).
Wider assumptions have been made about policies relating to aspects such as fares, fuel costs and car
parking, and they key economic assumptions are detailed in Table B1.

 Table B1 Key
 forecasting
 assumptions

     Assumption                                              Comments                                          Source

                    Work place parking supply is expected to decrease from 2015 to 2041 and parking charges
 Parking supply
                    are expected to increase significantly reflecting recent trends and expected continued     TfL
 and charges
                    pressure on parking

                    Car ownership is expected to decrease in line with increasing population densities to an
 Car ownership                                                                                                 TfL
                    average of 0.29 cars per person in 2041

 Economic           Highway and public transport economic assumptions are taken from WebTAG December
                                                                                                               DfT
 assumptions        2015 guidance

 Public
                    The Mayor’s Fares Freeze applies to TfL fares, with other fares assumed to increase with
 Transport                                                                                                     TfL
                    inflation until 2020. An inflation-linked increase is assumed from 2021.
 fares

12   http://content.tfl.gov.uk/tfl-business-plan-december-2017-.pdf
Planning data forecasting assumptions
The core reference case included the latest GLA projections13 with a spatial distribution that reflects the
2017 Strategic Housing Land Availability Assessment (SHLAA)14 and a 2017 long term labour market
projection15. These GLA projections form the basis of the draft London Plan, and the core reference case
has been updated to include these projections of population and employment forming the London Plan core
reference case.
Table B2 provides detail on the new GLA population and employment projections and comparison to the
previous projections included in the core reference case for the draft MTS Outcomes Summary report.
Employment projections are provided for the Central Activities Zone (CAZ) and the North Isle of Dogs
(NIOD), the remainder of inner London, and outer London. Population projections are provided for inner and
outer London.
Table B2
Population and
employment
distribution and
forecast growth
Previous GLA projection London Plan GLA projection
Population (millions)
2015 2041 2015-2041 (% growth) 2015 2041 2015-2041 (% growth)
Inner 3.4 4.3 24% 3.5 4.4 25%
Outer 5.2 6.2 20% 5.2 6.4 23%
Total 8.6 10.5 22% 8.7 10.8 24%
Employment (millions)
2015 2041 2015-2041 (% growth) 2015 2041 2015-2041 (% growth)
CAZ and NIOD 2 2.5 24% 2.1 2.7 28%
Inner (rest of) 1.3 1.7 27% 1.4 1.8 29%
Outer 2.1 2.5 16% 2.1 2.5 16%
Total 5.5 6.7 22% 5.6 6.9 24%
13
https://data.london.gov.uk/dataset/projections
14 https://www.london.gov.uk/what-we-do/planning/london-plan/new-london-plan/evidence-base
15 https://data.london.gov.uk/dataset/long-term-labour-market-projectionsContact Strategic Analysis City Planning Email davidchristie@tfl.gov.uk Phone 02030548451
You can also read