Minneapolis-St. Paul-Bloomington, Minnesota-Wisconsin - COMPREHENSIVE HOUSING MARKET ANALYSIS - HUD User
←
→
Page content transcription
If your browser does not render page correctly, please read the page content below

COMPREHENSIVE HOUSING MARKET ANALYSIS
  Minneapolis-St. Paul-Bloomington,
              Minnesota-Wisconsin

U.S. Department of Housing and Urban Development,
Office of Policy Development and Research
As of June 1, 2019

Share on:
Minneapolis-St. Paul-Bloomington, Minnesota-Wisconsin Comprehensive Housing Market Analysis as of June 1, 2019                                                                  Executive Summary 2

Executive Summary
Housing Market Area Description
Known as the “Twin Cities,” the Minneapolis-St. Paul-Bloomington,
MN-WI Housing Market Area (hereafter, the Minneapolis HMA)
is coterminous with the metropolitan statistical area of the same
name and includes 14 counties in Minnesota and 2 in Wisconsin.
The “twin cities” of Minneapolis and St. Paul are the largest cities
in the HMA and are the primary cities in Hennepin and Ramsey
Counties, respectively. For purposes of this analysis, the HMA is
divided into two submarkets: (1) the Central Counties submarket,
which includes Hennepin and Ramsey Counties, and (2) the
Suburban Counties submarket, which includes Anoka, Carver,
Chisago, Dakota, Isanti, Le Sueur, Mille Lacs, Scott, Sherburne,
Sibley, Washington, and Wright Counties in Minnesota, and Pierce                                         Tools and Resources
and St. Croix Counties in Wisconsin.
                                                                                                          Find interim updates for this metropolitan area, and select geographies nationally,
                                                                                                          at PD&R’s Market-at-a-Glance tool.
The current population of the HMA is estimated at 3.67 million.                                           Additional data for the HMA can be found in this report’s supplemental tables.
                                                                                                          For information on HUD-supported activity in this area, see the Community Assessment Reporting Tool.

                                                                           Comprehensive Housing Market Analysis Minneapolis-St. Paul-Bloomington, Minnesota-Wisconsin
                                                                                                     U.S. Department of Housing and Urban Development, Office of Policy Development and Research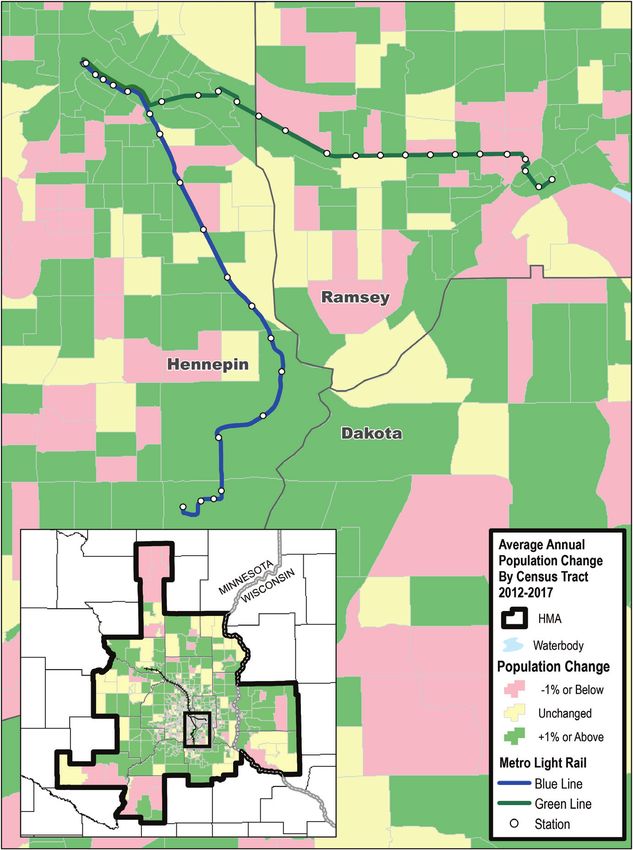
Minneapolis-St. Paul-Bloomington, Minnesota-Wisconsin Comprehensive Housing Market Analysis as of June 1, 2019                                                                        Executive Summary 3

Market Qualifiers
Economy                                                             Sales Market                                                                   Rental Market
         Strong: Economic conditions remain                                   Slightly Tight: Relatively low levels of                                       Slightly Tight: Despite record-high
         strong in the Minneapolis HMA,                                       new single-family home construction                                            levels of rental housing development
         although the rate of job growth                                      have not kept pace with demand since                                           since 2010, rental housing market
slowed considerably during the past year.                            the mid-2010s; particularly acute is the shortage                             conditions in the HMA have been slightly tight
                                                                     of houses for sale at entry-level price points.                               as compared with balanced conditions during
                                                                                                                                                   2010, due to strong rental household growth.
Nonfarm payrolls totaled 2.01 million during the                     Sales housing market conditions in the Minneapolis                            The overall rental housing market in the
12 months ending May 2019, with growth of 9,300                      HMA are currently slightly tight, with an estimated                           Minneapolis HMA is slightly tight, with an estimated
jobs, or 0.5 percent, well below the 1.3-percent                     2.4-month supply of homes for sale. In the Central                            vacancy rate of 4.7 percent, down from 7.6 percent
growth rate, or 25,300 jobs, added during the                        Counties submarket, sales housing conditions                                  in April 2010. Similar conditions exist throughout
previous 12-month period. By contrast, from                          are slightly tight, and in the Suburban Counties                              the HMA with current estimated vacancy rates of
2010 through 2017, payrolls grew by an average                       submarket, conditions are more balanced. During                               5 percent or less in both submarkets. The apartment
of 34,500 jobs annually, an average annual                           the 12 months ending May 2019, 70,750 new                                     market is tight, with a vacancy rate of 2.9 percent
growth rate of 1.9 percent. The unemployment                         and existing homes were sold in the HMA, 950                                  as of the first quarter of 2019, up from 2.8 percent
rate averaged 2.8 percent during the 12 months                       sales above the 69,800 home sales recorded a                                  a year earlier. The average apartment asking rent
ending May 2019, down from 2.9 percent during                        year earlier. At the same time, the average sales                             was $1,305, nearly 5 percent above the average
the previous 12-month period. During the 3-year                      price for all home sales was $298,300, nearly 5                               asking rent a year earlier. During the 3-year forecast
forecast period, nonfarm payroll growth is                           percent higher than the average sales price a year                            period, demand is estimated for 20,775 new units;
                                                                     earlier. During the 3-year forecast period, demand
expected to continue at an average annual                                                                                                          the 13,850 units currently under construction will
                                                                     is estimated for 24,600 homes; the 2,430 homes
rate of 0.5 percent.                                                                                                                               satisfy a portion of that demand during the first
                                                                     currently under construction will satisfy a portion
                                                                                                                                                   2 years of the forecast period.
                                                                     of that demand.

                                                                                                                      3-Year Housing Demand Forecast
TABLE OF CONTENTS                                                                                                                                                      Sales Units                Rental Units
Economic Conditions 4                                                                                                            Total Demand                              9,550                      15,250
Population and Households 10                                           Central Counties Submarket
                                                                                                                                 Under Construction                          780                      10,850
Home Sales Market Conditions 14                                                                                                  Total Demand                             15,050                      5,525
                                                                       Suburban Counties Submarket
Rental Market Conditions 22                                                                                                      Under Construction                        1,650                      3,000
Terminology Definitions and Notes 29                                                                                             Total Demand                            24,600                      20,775
                                                                       Minneapolis HMA
                                                                                                                                 Under Construction                       2,430                      13,850
                                                                      Notes: Total demand represents the estimated production necessary to achieve a balanced market at the end of the forecast period. Units are under
                                                                      construction as of June 1, 2019. The forecast period is June 1, 2019, to June 1, 2022.
                                                                      Source: Estimates by the analyst

                                                                           Comprehensive Housing Market Analysis Minneapolis-St. Paul-Bloomington, Minnesota-Wisconsin
                                                                                                         U.S. Department of Housing and Urban Development, Office of Policy Development and Research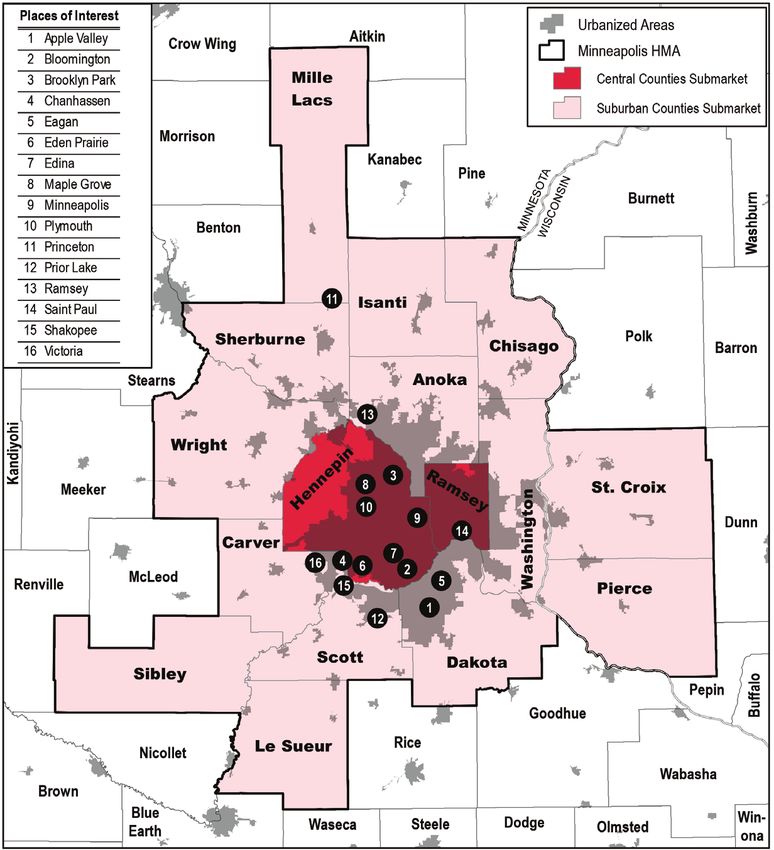
Minneapolis-St. Paul-Bloomington, Minnesota-Wisconsin Comprehensive Housing Market Analysis as of June 1, 2019                                                                          Economic Conditions 4

Economic Conditions                                                                                     Figure 1. Current Nonfarm Payroll Jobs in the Minneapolis HMA, by Sector
                                                                                                                                                     Local 8%    Mining, Logging, & Construction 4%
                                                                                                                                     State 3%
Largest sector: Education and health services                                                                                   Federal 1%
                                                                                                                                                                                       Manufacturing 10%

                                                                                                                     Other Services 4%

   During the 12 months ending May 2019, the rate of payroll job growth                                                                             Government
                                                                                                                                                                                                 Wholesale 5%
                                                                                                                                                       12%
   in the Minneapolis HMA fell to the lowest annual rate since early 2011.
                                                                                                          Leisure & Hospitality 9%
                                                                                                                                                                           Trade 14%                   Retail 9%

Primary Local Economic Factors—
                                                                                                                                                              Total
                                                                                                                                                             2,010.1
                                                                                                                                                 Education
A Stable Base of Employers                                                                                                                        & Health
                                                                                                                                                  Services                                      Transportation & Utilities 4%
                                                                                                                                                    17%
The Minneapolis HMA is the largest metropolitan area in the state of Minnesota                                                                                                                Information 2%
                                                                                                                           Health 15%
and includes the state capital (in St. Paul). Because of these attributes, the                                                                                                          Financial Activities 7%
HMA relies on several industries and sectors that provide generally stable
employment, including (state) government, trade, and health care, which are                                                          Education 2% Professional & Business Services 16%

three of the four largest sectors or subsectors in the HMA (Figure 1). Included                         Notes: Total nonfarm payroll is in thousands. Percentages may not add to 100 percent due to rounding. The
in the government sector is the University of Minnesota, which is the third                             current date is June 1, 2019.
                                                                                                        Source: U.S. Bureau of Labor Statistics
largest employer in the HMA, with 26,450 direct jobs (Table 1). The University
of Minnesota, with five campuses statewide, including its largest campus in
                                                                                                                           Table 1. Major Employers in the Minneapolis HMA
Minneapolis, east of downtown and the Mississippi River, had an estimated
economic impact (statewide) of approximately $8.6 billion annually and                                    Name of Employer                          Nonfarm Payroll Sector                       Number of Employees
supported more than 77,000 jobs as of 2017 (University of Minnesota). State
                                                                                                          Allina Health System                      Education & Health Services                             27,650
government payrolls averaged 65,800 during the 12 months ending May 2019,
                                                                                                          Target Corp.                              Wholesale & Retail Trade                               26,700
a gain of 500 jobs, or nearly 1 percent from a year earlier.                                              University of Minnesota                   Government                                             26,450
The wholesale and retail trade sector is currently the third largest employment                           HealthPartners                            Education & Health Services                            22,500
sector in the HMA. Opened in 1992, the Mall of America (MOA) is in suburban                               Fairview Health Services                  Education & Health Services                            22,000
Bloomington, Minnesota, south of Minneapolis in Hennepin County. The MOA                                  Wells Fargo & Co.                         Financial Activities                                   20,000

includes 5.6 million square feet of retail space and is the largest single retail and                     UnitedHealth Group                        Education & Health Services                             15,750
                                                                                                          CHS Inc.                                  Manufacturing                                           12,150
entertainment destination in North America (Mall of America). The MOA includes
                                                                                                          U.S. Bancorp                              Financial Activities                                   12,000
more than 520 retail stores, more than 60 dining options, an indoor theme park,
                                                                                                          Land O’Lakes, Inc.                        Manufacturing                                          10,000
and a 1.3-million-gallon aquarium. The MOA generates more than $2 billion in
                                                                                                        Note: Excludes local school districts.
economic impact for the state of Minnesota annually and employs more than                               Source: Moody’s Analytics.

                                                                           Comprehensive Housing Market Analysis Minneapolis-St. Paul-Bloomington, Minnesota-Wisconsin
                                                                                                     U.S. Department of Housing and Urban Development, Office of Policy Development and Research
Minneapolis-St. Paul-Bloomington, Minnesota-Wisconsin Comprehensive Housing Market Analysis as of June 1, 2019 Economic Conditions 5
11,000 workers year-round, increasing to 13,000 workers during peak seasons. Table 2. 12-Month Average Nonfarm Payroll Jobs (1,000s)
The MOA is located directly south of the Minneapolis International Airport and in the Minneapolis HMA, by Sector
is the southern terminus of the Metro Transit Blue Line light rail. 12 Months 12 Months
Ending Ending Absolute Percentage
Change Change
May 2018 May 2019
The education and health services sector is the largest nonfarm payroll sector
Total Nonfarm Payroll Jobs 2,000.7 2,010.1 9.3 0.5
in the HMA and the only sector to have job growth every year since 2000. Goods-Producing Sectors 277.7 282.5 4.8 1.7
Since 2000, jobs have increased an average of 3.1 percent annually, compared Mining, Logging, & Construction 80.8 82.9 2.1 2.6
with 0.6-percent average annual growth for total nonfarm payrolls. Steady Manufacturing 196.8 199.6 2.8 1.4
Service-Providing Sectors 1,723.0 1,727.5 4.5 0.3
population growth in the HMA contributes to demand for jobs in this service- Wholesale & Retail Trade 284.9 286.7 1.7 0.6
providing sector, and major healthcare providers are 4 of the 10 largest Transportation & Utilities 75.3 75.4 0.1 0.1
employers in the HMA. Information 38.0 37.4 -0.6 -1.5
Financial Activities 148.5 150.2 1.7 1.2
The U.S. Bank Stadium contributes to jobs in the leisure and hospitality sector Professional & Business Services 324.9 325.1 0.2 0.1
by spurring tourism; recent examples include the National Collegiate Athletics Education & Health Services 334.5 335.1 0.5 0.2
Leisure & Hospitality 188.9 190.0 1.1 0.6
Association (NCAA) “Final Four” men’s basketball tournament playoffs in April Other Services 79.2 79.1 -0.1 -0.1
2019 and Super Bowl LII in February 2018. Super Bowl LII attracted 100,000 Government 248.9 248.6 -0.3 -0.1
visitors to the HMA and included an economic impact estimated at $450 million. Notes: Based on 12-month averages through May 2018 and May 2019. Numbers may not add to totals due to
rounding. Data are in thousands.
Figures for the NCAA Final Four suggest more than 90,000 visitors and a $140 Source: U.S. Bureau of Labor Statistics
million economic impact. In addition, the stadium has spurred investments
estimated at $1.1 billion in the near-eastside area of downtown Minneapolis, Figure 2. Available Jobs in the Seven-County Twin Cities Region
where the stadium is sited. 90,000
Available Jobs
80,000
Current Conditions—Nonfarm Payrolls 70,000
60,000
Economic conditions in the Minneapolis HMA have been strong since 2010, 50,000
although the rate of job growth declined significantly during the past year. 40,000
During the 12 months ending May 2019, nonfarm payroll jobs increased 30,000
by 9,300, or 0.5 percent from a year earlier, to 2.01 million (Table 2). By 20,000
comparison, jobs grew 1.3 percent during the 12-month period ending May 10,000
2018. The primary reason for slowed job growth is a lack of qualified workers; 0
4Q 008
4Q 009
2Q 08
2Q 009
4Q 010
2Q 10
4Q 012
4Q 15
4Q 016
2Q 012
2Q 015
4Q 013
4Q 014
2Q 16
4Q 18
2Q 13
2Q 014
18
4Q 017
2Q 017
4Q 011
2Q 11
as of the fourth quarter of 2018, approximately 76,550 jobs were available,
20
20
20
20
20
20
20
20
2
2
2
2
2
2
2
2
2
2
2
2
2
2
2Q
more than 11 percent higher than available jobs a year earlier (Figure 2). 2Q = second quarter. 4Q = fourth quarter.
Significant job expansions have become less common in the HMA as Note: Data are for the seven-county Twin Cities region including Anoka, Carver, Dakota, Hennepin, Ramsey,
Scott, and Washington Counties.
employers have been discouraged by a lack of qualified workers. Source: Minnesota Department of Employment and Economic Development, Job Vacancy Survey
Comprehensive Housing Market Analysis Minneapolis-St. Paul-Bloomington, Minnesota-Wisconsin
U.S. Department of Housing and Urban Development, Office of Policy Development and ResearchMinneapolis-St. Paul-Bloomington, Minnesota-Wisconsin Comprehensive Housing Market Analysis as of June 1, 2019 Economic Conditions 6
Job growth in the goods-producing sectors significantly exceeded the service- Figure 3. Sector Growth in the Minneapolis HMA,
providing sectors during the most recent 12 months. The two fastest-growing 2011 to Current
sectors were the mining, logging, and construction and the manufacturing
Total Nonfarm Payroll Jobs
sectors, which increased 2.6 percent and 1.4 percent, with growth of 2,100 Goods-Producing Sectors
and 2,800 jobs, respectively. The mining, logging, and construction sector has Mining, Logging, & Construction
Manufacturing
grown 4.9 percent annually, on average, since 2011, nearly three times as fast as
Service-Providing Sectors
total nonfarm payrolls in the HMA (Figure 3). Modest increases in sales housing Wholesale & Retail Trade
construction since 2011 and significant increases in multifamily construction Transportation & Utilities
Information
have contributed to job growth in this sector. During 2018, residential building Financial Activities
permits for single-family and multifamily residences were at the highest levels Professional & Business Services
Education & Health Services
since 2006, contributing to increased jobs in the construction subsector. Growth Leisure & Hospitality
in the manufacturing sector included an expansion by Winnebago Industries, Other Services
Government
which added approximately 75 manufacturing jobs at its Eden Prairie (Hennepin -10 -5 0 5 10 15 20 25 30 35 40 45 50 55
County) site in late 2018. Minnetronix Medical Incorporated, a medical equipment Change in Jobs (%)
manufacturer located in St. Paul, added approximately 100 jobs during 2018
Note: The current date is June 1, 2019.
and expects to increase employment by 30 to 40 jobs annually during the Source: U.S. Bureau of Labor Statistics
next 3 years. The Minneapolis HMA includes more than 40 medical device
manufacturers with more than 100 employees each (Minnesota Department of
Figure 4. 12-Month Average Unemployment Rate
Employment and Economic Development). Service-sector job growth was led by in the Minneapolis HMA and the Nation
the financial activities and the wholesale and retail trade sectors, which added
1,700 jobs each, or gains of 1.2 and 0.6 percent, respectively. The number of jobs Minneapolis HMA Nation
9.7
in the leisure and hospitality sector increased by 1,100, or 0.6 percent. Declining 10.0
sectors during the past year include the information sector, the government 9.0
7.8
8.0
sector, and the other services sector, which recorded job losses of 600, 300,
Unemployment Rate
7.0
and 100 jobs each, or 1.5 percent, 0.1 percent, and 0.1 percent, respectively. 6.0
5.0
Current Conditions—Unemployment (%)
4.0
During the 12 months ending May 2019, the unemployment rate in the 3.0
2.0
Minneapolis HMA averaged 2.8 percent, down from 2.9 percent a year earlier,
1.0
and well below the 3.8-percent national rate (Figure 4). The unemployment 0.0
rate in the Minneapolis HMA peaked at 7.8 percent during the summer of 2010,
Ma 0
Ma 6
Ma 5
Ma 8
Ma 9
Ma 04
Ma 2
Ma 03
Ma 07
Ma 01
Ma 0
Ma 5
Ma 6
Ma 8
9
Ma 2
Ma 3
Ma 4
Ma 7
Ma 11
y-0
y-0
y-0
y-0
y-0
y-0
y-1
y-1
y-1
y-1
y-1
y-1
y-1
y-1
y-1
y-
y-
y-
y-
y-
shortly after the end of the Great Recession, but has declined in all but 1 year
Ma
since. The rate has been below 5.0 percent since 2013 and is currently only Note: 12-month moving average.
slightly higher than the recent low of 2.7 percent in 2000. Source: U.S. Bureau of Labor Statistics
Comprehensive Housing Market Analysis Minneapolis-St. Paul-Bloomington, Minnesota-Wisconsin
U.S. Department of Housing and Urban Development, Office of Policy Development and ResearchMinneapolis-St. Paul-Bloomington, Minnesota-Wisconsin Comprehensive Housing Market Analysis as of June 1, 2019 Economic Conditions 7
Historic Trends
2003 Through 2006 2007 Through 2010
From 2003 through 2006, job growth averaged 1.0 percent, or 17,300 jobs This period encompassed the onset of the Great Recession, during which time
added annually. By comparison, national nonfarm payroll jobs grew an average the national economy contracted and impacted economic conditions in the
of 1.1 percent annually. Growth averaging 18,900 jobs annually in the service- Minneapolis HMA. Nonfarm payrolls in the HMA fell by an average of 22,300
providing sectors offset an average decline of 1,700 jobs annually in the goods- annually or 1.2 percent; by contrast, nationally, payroll jobs declined an average of
producing sectors because manufacturing jobs fell by 1,900, or 0.9 percent, 1.1 percent. All sectors except the education and health services sector in the HMA
annually. Manufacturing sector layoffs were widespread in the HMA, and declined during this period with the most significant losses in the goods-producing
impacted jobs in food, machinery, and medical equipment manufacturing. In the and trade sectors; these sectors declined by annual averages of 15,600 and
service-providing sectors, the education and health services sector added an 6,800 jobs, or 5.8 and 2.5 percent, respectively, during the period. In the goods-
average of 9,200 jobs annually, with growth averaging more than 4.0 percent. producing sectors, the losses were nearly evenly split, averaging 7,700 annually
The professional and business services sector added 5,200 jobs, or 1.9-percent in the mining, logging, and construction sector, and averaging 7,900 annually
average annual growth, and the leisure and hospitality sector added 3,300 jobs in the manufacturing sector, declines averaging 10.5 and 4.0 percent annually,
annually, or 2.1 percent. Figure 5 shows the 12-month average nonfarm payroll respectively. Residential building permitting had begun to fall sharply during 2005
count in the Minneapolis HMA from 2000 to the current date. and remained low during the period from 2007 through 2010. In the manufacturing
sector, job dislocations were varied and numerous during this period; during
Figure 5. 12-Month Average Nonfarm Payrolls in the Minneapolis HMA 2008, Graco closed a plant in Minneapolis that manufactured industrial valves,
National Recession Nonfarm Payrolls eliminating 280 jobs. ADC, a manufacturer of telephone apparatuses, closed
plants in Eden Prairie (Hennepin County, Minnesota) and Shakopee (Scott County,
2,100
Minnesota), eliminating 200 total jobs. Food manufacturing jobs, medical device
Nonfarm Payrolls (in Thousands)
2,000
manufacturing jobs, and others also declined. The education and health services
sector grew an average of 7,900 jobs, or 3.1 percent, only slightly slower than
1,900 growth during the previous period.
1,800 2011 Through 2017
Nonfarm payrolls began to increase in the HMA in February 2011. Nonfarm
1,700 payrolls rose an average of 34,500 annually from 2011 through 2017, averaging
1.9 percent. Goods-producing jobs grew at a 2.5-percent annual rate, faster
1,600
than the 1.8-percent rate of growth for service-providing jobs; however,
Ma 0
Ma 6
Ma 5
Ma 08
Ma 9
Ma 04
Ma 2
Ma 03
Ma 07
Ma 01
Ma 0
Ma 5
Ma 6
Ma 8
9
Ma 2
Ma 3
Ma 4
Ma 7
Ma 11
service sector jobs increased an average of 28,100 annually, or 1.8 percent,
y-0
y-0
y-0
y-0
y-0
y-1
y-1
y-1
y-1
y-1
y-1
y-1
y-1
y-1
y-
y-
y-
y-
y-
y-
Ma
Note: 12-month moving average.
compared with 6,400 jobs added, or 2.5 percent, on average, in the goods-
Sources: U.S. Bureau of Labor Statistics; National Bureau of Economic Research producing sector. In the goods-producing sector, jobs in the mining, logging,
Comprehensive Housing Market Analysis Minneapolis-St. Paul-Bloomington, Minnesota-Wisconsin
U.S. Department of Housing and Urban Development, Office of Policy Development and ResearchMinneapolis-St. Paul-Bloomington, Minnesota-Wisconsin Comprehensive Housing Market Analysis as of June 1, 2019 Economic Conditions 8
and construction sector expanded by 3,600 annually, or 5.5 percent, primarily the Suburban Counties submarket, and 2 percent commute to areas outside the
in the construction subsector; net in-migration into the HMA rose strongly and 16-county HMA. By comparison, 41 percent of workers who live in the Suburban
residential construction increased to meet the housing needs of new residents. Counties submarket commute into the Central Counties submarket for work,
The construction of U.S. Bank Stadium, which opened in 2016, southeast of whereas 55 percent work in the Suburban Counties submarket, and 4 percent
downtown Minneapolis and adjacent to the combined portion of the Blue and commute to jobs outside of the HMA (U.S. Census Bureau, estimates as of July 1,
Green Metro Transit train lines, created an estimated 8,000 construction jobs 2015; Table 4). Anoka and Dakota Counties, which are directly to the north and
during its 2.5-year construction period. the south of the Central Counties submarket, respectively, combine to account for
The education and health services sector and the professional and business approximately 48 percent of the jobs in the Suburban Counties submarket.
services sector led gains in the service-providing sector. The two sectors
grew by averages of 8,300 and 7,000 jobs annually, or 2.8 and 2.4 percent, Table 3. Estimated Percent Share of Covered Employment
respectively. Numerous expansions at hospitals and healthcare providers in by Submarket During 2018
the HMA occurred, including Fairview Health Services in Princeton (Sherburne Central Counties Suburban Counties
County, Minnesota), and Fairview Southdale Hospital in Edina (Hennepin County, 66 34
Minnesota), as well as Allina Health System’s new “Mother-Baby Center” in St. Source: U.S. Bureau of Labor Statistics, with estimates by the analyst
Paul. Additional growth occurred in the leisure and hospitality and the wholesale
and retail trade sectors, which grew by 4,300 jobs and 3,600 jobs annually,
average growth rates of 2.5 and 1.3 percent, respectively. The government Table 4. Jobs by Place of Worker Residence
sector added an average of 600 jobs, or 0.2 percent, annually with job growth Worker Residence
for local governments averaging 1,300 jobs annually, more than offsetting Central Counties Suburban Counties
declines in federal and state government jobs. The information sector was the (%) (%)
only sector to lose jobs from 2011 through 2017, falling an average of 300 jobs Location
Central Counties 87 41
annually, or 0.8 percent. of Primary Suburban Counties 11 55
Job
Outside the HMA 2 4
Source: U.S. Census Bureau, 2015 Journey to Work
Commuting Patterns
The Central Counties submarket is the employment center in the HMA, accounting Employment Forecast
for approximately 66 percent of all jobs in the HMA during 2018 (Table 3). That During the 3-year forecast period, nonfarm payrolls are expected to increase
figure is down slightly, from 68 percent during 2010 and 70 percent during 2001 at an average annual rate of 0.5 percent, with growth likely hindered by a lack
as employers have become increasingly likely to relocate to less expensive parts of qualified workers to fill jobs. Construction sector jobs will continue to grow
of the HMA. Approximately 87 percent of workers who live in the Central Counties because of continued demand for housing going forward. Manufacturing sector
submarket work in either Hennepin or Ramsey County, 11 percent commute to jobs are likely to remain stable despite TreeHouse Foods’ announcement in May
Comprehensive Housing Market Analysis Minneapolis-St. Paul-Bloomington, Minnesota-Wisconsin
U.S. Department of Housing and Urban Development, Office of Policy Development and ResearchMinneapolis-St. Paul-Bloomington, Minnesota-Wisconsin Comprehensive Housing Market Analysis as of June 1, 2019 Economic Conditions 9
2019 to close a plant in Minneapolis that manufactures snacks, thus eliminating development of a new technology hub in Minneapolis that is expected to create
120 jobs. Job growth is expected to continue in the education and health services 100 jobs by 2021. New York-based financial-technology startup company DailyPay,
sector, but at lower rates than recently. Jobs are expected to be added at the Inc., selected Minneapolis as its second location, and plans to hire 100 workers by
University of Minnesota Health Center and Regions Hospital in St. Paul, which are 2020. Offsetting these growth announcements, Thrivent Financial announced the
both undertaking expansions, although Blue Cross and Blue Shield of Minnesota closure of its Brightpeak Financial division and is expected to eliminate 60 jobs in
recently announced the elimination of approximately 60 jobs at its location Minneapolis. The continued decline in the number of unemployed residents is of
in Eagan (Dakota County). Some expansions are expected in the professional some concern as a shortage of available labor, for both skilled and unskilled jobs,
and business services sector. Technology-consulting firm Wipro announced the may dampen future economic growth.
Comprehensive Housing Market Analysis Minneapolis-St. Paul-Bloomington, Minnesota-Wisconsin
U.S. Department of Housing and Urban Development, Office of Policy Development and ResearchMinneapolis-St. Paul-Bloomington, Minnesota-Wisconsin Comprehensive Housing Market Analysis as of June 1, 2019 Population and Households 10
Population and Households Great Recession, population growth fell slightly, to an average of 30,550 annually,
or 0.9 percent, and net in-migration fell to an average of 2,750 people annually,
Current population: 3.67 million or only 9 percent of the increase in population.
The rate of population growth in the Minneapolis HMA has been
consistent since 2000; however, the allocation of population growth 2010 to Current
between the two submarkets has shifted significantly since 2010. Starting in 2010, when the HMA began an ongoing, 9-year period of job growth,
net in-migration increased strongly, averaging 9,950 people annually from 2010
Population Trends to 2014, and increasing to 14,350 people annually from 2014 to the current
As of June 1, 2019, the population of the Minneapolis HMA was estimated at more date. Despite the increase in net in-migration, the rate of population growth has
than 3.67 million. Population growth has averaged 1.0 percent annually since April remained stable, at 1 percent annually because net natural change has declined.
1, 2010, unchanged from the rate during the period from April 1, 2000, to April From 2010 to 2014, net in-migration contributed nearly 30 percent of total
1, 2010 (Table 5). Net in-migration has increased significantly as a share of total population growth in the HMA—a rate that has risen to nearly 40 percent since
population growth since 2010, while population growth has accelerated in the 2014. Figure 6 shows components of population growth in the HMA since 2000.
Central Counties submarket and slowed in the Suburban Counties submarket. Notably, from 2010 to 2018, net in-migration was primarily international migration,
which accounted for more than 90 percent of migrants into the Minneapolis HMA
Table 5. Minneapolis HMA Population and Household Quick Facts
2010 Current Forecast
Figure 6. Components of Population Change in the Minneapolis HMA,
Population Population 3,348,859 3,674,000 3,772,000 2000 Through the Forecast
Quick Facts Average Annual Change 31,700 35,450 32,650
Net Natural Change Net Migration Population Growth
Percentage Change 1.0 1.0 0.9
45,000
2010 Current Forecast 40,000
35,000
Household Households 1,299,635 1,427,000 1,465,000
30,000
Quick Facts Average Annual Change 13,900 13,950 12,500
25,000
Percentage Change 1.1 1.0 0.9 20,000
Notes: Average annual changes and percentage changes are based on averages from 2000 to 2010, 2010 to 15,000
current, and current to forecast. The forecast period is from the current date (June 1, 2019), to June 1, 2022. 10,000
Sources: 2000 and 2010—2000 Census and 2010 Census; current and forecast—estimates by the analyst
5,000
0
2000 to 2010 -5,000
From 2000 to 2006, the population in the HMA grew an average of 32,400
06 06
05 5
09 9
04 4
t
07 7
03 3
08 8
01 1
10 0
02 2
or t
16 6
15 5
14 4
13 3
7
Cu 018 2018
11 1
12 2
as
-F n
20 -200
20 -200
20 -200
20 -200
20 -200
20 -200
20 -200
20 -200
20 -201
20 201
20 201
20 -201
20 -201
20 -201
20 201
20 201
nt rre
20 -20
ec
rre Cu
-
-
-
annually, or 1.0 percent, and net in-migration contributed 17 percent of this growth,
-
-
00
1 7
-
20
or 5,600 people, on average, each year. The remaining population growth, totaling
2
26,800 people on average each year, came from net natural change. From 2006 to Notes: Net natural change and net migration totals are average annual totals over the time period. The
forecast period is from the current date (June 1, 2019), to June 1, 2022.
2010, encompassing declining economic conditions in the HMA resulting from the Sources: U.S. Census Bureau; current to forecast—estimates by the analyst
Comprehensive Housing Market Analysis Minneapolis-St. Paul-Bloomington, Minnesota-Wisconsin
U.S. Department of Housing and Urban Development, Office of Policy Development and ResearchMinneapolis-St. Paul-Bloomington, Minnesota-Wisconsin Comprehensive Housing Market Analysis as of June 1, 2019 Population and Households 11
(U.S. Census Bureau, Population Estimates Program). Although immigrants from Central Counties Submarket
Mexico are the largest contributor to the foreign-born population in the HMA,
The population of the Central Counties submarket is currently estimated at 1.84
immigrants from Asia including the Hmong and immigrants from Africa, notably
million, or 50 percent of the population in the HMA (Figure 8). The population of
from Somalia and Ethiopia, are significantly represented in the HMA as well.
the submarket has risen an average of 19,300 annually since 2010, a growth rate
Age Cohort Trends averaging 1.1 percent; this rise represents a sharp increase from the previous
decade, when the population increased an average of only 3,375 annually, or
Local officials indicate a decline in the share of the population in the prime
0.2 percent. Average annual net natural change in the submarket has declined
working age, defined as persons age 18 through 64, is contributing to lower
since 2010, and net in-migration has accounted for all the increased population
economic growth in the HMA. The data supports this; Figure 7 shows the
growth. Since 2010, net in-migration to the submarket has averaged 7,350
proportion of the population in various age cohorts, estimated in 2010, 2014,
people annually. By comparison, from 2000 to 2010, net out-migration from the
and 2017. The fastest growth is estimated to have occurred in the over age-
submarket averaged 9,125 people annually. Recent economic growth has had a
65 cohort; the population age 18 through 39 has declined modestly, and the
significant impact in the Central Counties submarket, and numerous development
population age 40 through 64 has declined slightly faster. Combined, the prime
initiatives focused in the downtowns of Minneapolis and St. Paul have made
working age population in the HMA has declined from 64 percent to 62 percent
the submarket more attractive to residents. In 2014, Metro Transit, the public
of the total population between 2010 and 2017.
transportation system in the HMA, opened the Green Line, which runs parallel
Figure 7. Population by Age in the Minneapolis HMA Figure 8. Current Population by Submarket
2010 2014 2017 Central Counties Suburban Counties
35
30
25
Population
20
(%)
50% 50%
15
10
5
0
Under 18 18-39 Years 40-64 Years 65 Years and Over
Note: The current date is June 1, 2019.
Source: Estimates by the analyst
Source: 2010, 2014, and 2017 American Community Survey, 1-year data
Comprehensive Housing Market Analysis Minneapolis-St. Paul-Bloomington, Minnesota-Wisconsin
U.S. Department of Housing and Urban Development, Office of Policy Development and ResearchMinneapolis-St. Paul-Bloomington, Minnesota-Wisconsin Comprehensive Housing Market Analysis as of June 1, 2019 Population and Households 12
Map 2. Average Annual Population Change by Census Tract
to Interstate 94 and University Avenue for much of its length and connects in the Minneapolis HMA, 2012–2017
downtown Minneapolis to downtown St. Paul. Between 2010 and 2017, the
population of the census tracts adjacent to the Green Line and the Blue Line,
which opened in 2004 and connects downtown Minneapolis to the Minneapolis
International Airport and the MOA, increased at an average annual rate of
2.3 percent, more than twice as fast as the HMA’s growth rate of 1.0 percent
(American Community Survey, 5-year data; Map 2).
Suburban Counties Submarket
The population of the Suburban Counties submarket is also currently estimated
at 1.84 million. Unlike in the Central Counties submarket, where the rate of
population growth has increased compared with the previous decade, the rate
of population growth has declined since 2010, although this decline has slowed
since 2015. Population growth in the submarket averaged 28,300 annually, or
1.9 percent from 2000 to 2010; since 2010, the average rate of growth declined
to 0.9 percent annually, or an average of only 16,200 people. From 2000 to 2006,
net in-migration to the submarket averaged 19,550 people annually, contributing
to average population growth of 34,100 people annually, or 2.3 percent. From
2006 through 2011, including the period of economic decline and the start of
the recovery in the HMA, net in-migration into the submarket fell dramatically,
averaging 2,900 people annually, and the rate of population growth more than
halved, falling to 1.0 percent, or growth averaging 17,100 people annually. As
economic conditions continued to improve, net in-migration into the Suburban
Counties submarket fell to an average of 2,850 people annually from 2011 to
2015, and population growth slowed to an average of only 0.8 percent annually,
or 14,300 people. Population growth has accelerated to an average of 1.1 percent
since 2015, however, as housing costs have risen in the areas closer to the
economic core of the HMA. Net in-migration to the submarket has increased
to an average of 8,750 people annually, since 2015.
Household Trends
The Minneapolis HMA contains an estimated 1.43 million households, with
slightly more than 52 percent residing in the Central Counties submarket, where
the average household size is relatively small; approximately 48 percent in the
Suburban Counties submarket, where families represent a larger share of the Source: 2012–2017 American Community Survey, 5-year data
Comprehensive Housing Market Analysis Minneapolis-St. Paul-Bloomington, Minnesota-Wisconsin
U.S. Department of Housing and Urban Development, Office of Policy Development and ResearchMinneapolis-St. Paul-Bloomington, Minnesota-Wisconsin Comprehensive Housing Market Analysis as of June 1, 2019 Population and Households 13
total population. By tenure, an estimated 69.5 percent of households in the Forecast
HMA are homeowners, down from 71.6 percent in 2010 (Figure 9). The decline
The anticipated slowdown in economic growth during the 3-year forecast period
in homeownership is largely a result of the housing crisis in the late 2000s,
is expected to result in slowed population growth. The population of the HMA is
with both new and existing households more likely to rent since 2010 than in
expected to reach 3.77 million by June 1, 2022, growth of 0.9 percent, or 32,650
the previous decade. Since 2010, household growth has averaged 1.0 percent
annually. By submarket, population growth rates are expected to average 0.9
annually in the HMA, or 13,950 new households annually, relatively unchanged
percent annually in the Central Counties submarket and 0.8 percent annually
from 1.1 percent annual growth, or 13,900 households annually during the previous
in the Suburban Counties submarket. Approximately 52 percent of the forecast
decade. Since 2010, renter households in the HMA have increased 1.8 percent
population growth is expected to occur in the Central Counties submarket
annually, on average, compared with owner household growth averaging 0.7
(Figure 10). Households are expected to expand by an average of 0.9 percent
percent annually. During the previous decade, renter households rose an average
annually in each submarket and the HMA, with annual increases of 6,650 in the
of 1.5 percent annually, and owner households grew an average of 1.0 percent
Central Counties submarket and 5,850 in the Suburban Counties submarket,
annually. By submarket, households have increased an average of 1.0 percent
totaling 12,500 households added annually in the HMA.
in each submarket since 2010, equal to 7,225 households added, on average,
in the Central Counties submarket, and 6,700 households added annually in the
Suburban Counties submarket. Figure 10. Share of Forecast Population Growth by Submarket
Figure 9. Households by Tenure and Homeownership Rate Central Counties Suburban Counties
in the Minneapolis HMA
Owner Renter Homeownership Rate
1,600,000 73.0
72.6
1,400,000 72.5
1,200,000 72.0
71.6 48% 52%
Homeownership Rate
1,000,000 71.5
Households
800,000 71.0
(%)
600,000 70.5
400,000 69.5 70.0
200,000 69.5 Note: The forecast period is from June 1, 2019, to June 1, 2022.
Source: Estimates by the analyst
0 69.0
2000 2010 Current
Sources: 2000 and 2010–2000 Census and 2010 Census; current—estimates by the analyst
Comprehensive Housing Market Analysis Minneapolis-St. Paul-Bloomington, Minnesota-Wisconsin
U.S. Department of Housing and Urban Development, Office of Policy Development and ResearchMinneapolis-St. Paul-Bloomington, Minnesota-Wisconsin Comprehensive Housing Market Analysis as of June 1, 2019 Home Sales Market Conditions 14
Home Sales Market Conditions potential sellers to list their home, although many homeowners are concerned
they will not find another home to buy. Rising costs for land, materials, and labor
Sales Market—Minneapolis HMA are identified as hindrances to increasing new home production in the HMA.
Market Conditions: Slightly Tight Home Sales
Home sales, including new and existing single-family homes, townhomes,
Sales housing market conditions in the HMA have tightened since and condominiums, totaled 70,750 during the 12 months ending May 2019, an
2010 because of stronger population growth and a shortage of increase of 930 sales or 1.3 percent above the sales total from a year earlier
available inventory for sale. (Metrostudy, A Hanley Wood Company). Figure 11 shows home sales by type in
the HMA. The increase in sales occurred despite a significant decline in real
Current Conditions estate owned (REO) sales, which fell by 1,075 sales, or more than 31 percent. Both
The home sales market in the Minneapolis HMA is currently slightly tight, with an
new home sales and regular (non-distressed) resales rose during the past year,
estimated 0.9-percent vacancy rate, down from 1.9 percent in April 2010, when
increasing 9 percent and 2 percent, to 6,300 and 62,100 sales, respectively.
conditions were slightly soft (Table 6). During May 2019, there was a 2.5-months’
supply of single-family detached homes for sale and a 2.1-months’ supply of Figure 11. 12-Month Sales Totals by Type in the Minneapolis HMA
condominium units for sale; a year earlier, the corresponding figures were Regular Resale Sales
New Sales REO Sales
supplies of 2.4 months and 2.1 months (Minneapolis Area Realtors® [MAR]). 90,000
MAR further reports that home sales are hampered by a lack of supply, 80,000
particularly acute at the lower price levels. Current prices for both new and 70,000
existing home sales are at all-time highs, which would typically incentivize 60,000
Sales Totals
50,000
40,000
Table 6. Home Sales Quick Facts in the Minneapolis HMA 30,000
Minneapolis HMA Nation 20,000
Vacancy Rate 0.9% NA 10,000
Months of Inventory 2.4 3.3 0
6
8
9
7
0
5
6
8
9
2
3
4
7
Total Home Sales 70,750 6,003,000
1
y-0
y-0
y-0
y-0
y-1
y-1
y-1
y-1
y-1
y-1
y-1
y-1
y-1
y-1
Home Sales
Ma
Ma
Ma
Ma
Ma
Ma
Ma
Ma
Ma
Ma
Ma
Ma
Ma
Ma
1-Year Change 1.3% -1.8%
Quick Facts New Home Sales Price $433,500 $410,400 REO = real estate owned.
1-Year Change 2% 0% Source: CoreLogic, Inc., with adjustments by the analyst
Existing Home Sales Price $284,700 $310,200
1-Year Change
Mortgage Delinquency Rate
5%
0.7%
2%
1.4% Home Sale Prices
NA = data not available. The average home sales price in the Minneapolis HMA during the 12 months
Notes: Vacancy rate is as of the current date, June 1, 2019. Home sales and prices are for the 12 months
ending May 2019. Months of inventory and mortgage delinquency data are as of May 2019.
ending May 2019 was $298,300, approximately $14,050, or 5 percent, higher
Sources: Home sales and prices—Metrostudy, A Hanley Wood Company; delinquency rate—CoreLogic, Inc. than the average sales price a year earlier, and more than 9 percent above the
Comprehensive Housing Market Analysis Minneapolis-St. Paul-Bloomington, Minnesota-Wisconsin
U.S. Department of Housing and Urban Development, Office of Policy Development and ResearchMinneapolis-St. Paul-Bloomington, Minnesota-Wisconsin Comprehensive Housing Market Analysis as of June 1, 2019 Home Sales Market Conditions 15
prerecession high of $273,400 in 2006. By sales type, the average price of new Housing Affordability
home sales was $433,500, and for regular resale homes, the average sales price
Homeownership in the Minneapolis HMA is moderately affordable, although
was $286,700, gains of 2 percent and 4 percent from a year earlier, respectively.
affordability has generally trended downward since early 2013. Excess inventory,
Both sales prices represent record highs for the HMA. Figure 12 shows average
present in the HMA during 2010 and 2011, has been mostly absorbed and
home sales prices, by type of sale, in the Minneapolis HMA.
low levels of inventory have put upward pressure on purchase prices since
Figure 12. 12-Month Average Sales Price by Type of Sale in the Minneapolis HMA the mid-2010s. The National Association of Home Builders (NAHB) and Wells
Fargo Housing Opportunity Index (HOI) for the HMA, which represents the
New Sales Regular Resale Sales REO Sales
500,000 share of homes sold that would have been affordable to a family earning the
450,000 local median income, was 78.6 during the first quarter of 2019, down slightly
400,000 from 78.9 percent a year earlier (Figure 13). During the most recent quarter,
Average Sales Price
350,000 84 metropolitan areas out of 239 metropolitan areas measured, or 35 percent
300,000 of the metropolitan areas in the nation, had greater housing affordability than
($)
250,000 the HMA. From 2009 through 2012, the HOI for the Minneapolis HMA was
200,000 comparatively high, averaging 85.0 during the period, although affordability
150,000 has since declined with home sales prices rising faster than incomes despite
100,000
increased production of single-family homes, townhomes, and condominiums.
6
8
9
7
0
5
6
8
9
2
3
4
7
1
y-0
y-0
y-0
y-0
y-1
y-1
y-1
y-1
y-1
y-1
y-1
y-1
y-1
y-1
Ma
Ma
Ma
Ma
Ma
Ma
Ma
Ma
Ma
Ma
Ma
Ma
Ma
Ma
REO = real estate owned. Figure 13. Minneapolis HMA Housing Opportunity Index
Source: CoreLogic, Inc., with adjustments by the analyst
90
REO Sales and Delinquent Mortgages 85
NAHB Opportunity Index
During the 12 months ending May 2019, REO sales totaled 2,375, nearly one- 80
third fewer than the 3,450 REO sales a year earlier, and a fraction of the peak
of 19,350 in 2009 (CoreLogic, Inc., with adjustments by the analyst). As a 75
proportion of all resale sales, REO sales contributed 4 percent during the current 70
12-month period, down from 5 percent a year ago and well below the 41-percent
65
figure in 2009. As of May 2019, approximately 0.7 percent of all mortgages in
the HMA were seriously delinquent or transitioned into REO status, down from 60
0.9 percent a year earlier and well below the high of 6.3 percent in January
08
09
10
15
16
18
19
12
13
14
7
11
1
20
20
20
20
20
20
20
20
20
20
20
20
2010. (CoreLogic, Inc.). The current rate in the HMA is slightly lower than the
1Q
1Q
1Q
1Q
1Q
1Q
1Q
1Q
1Q
1Q
1Q
1Q
0.8-percent rate for the state of Minnesota and nearly one-half the national 1Q = first quarter. NAHB = National Association of Home Builders.
rate of 1.4 percent. Source: NAHB/Wells Fargo
Comprehensive Housing Market Analysis Minneapolis-St. Paul-Bloomington, Minnesota-Wisconsin
U.S. Department of Housing and Urban Development, Office of Policy Development and ResearchMinneapolis-St. Paul-Bloomington, Minnesota-Wisconsin Comprehensive Housing Market Analysis as of June 1, 2019 Sales Market—Central Counties Submarket 16
In December 2018, the city of Minneapolis adopted “Minneapolis 2040,” its most Figure 14. Average Annual Sales Housing Permitting Activity
recent comprehensive plan for housing and development. It includes 14 goals in the Minneapolis HMA
and 100 policy proscriptions and was developed from a recognition that long- Single-Family Homes/Townhomes Condominiums
term projections suggest the HMA will need to add approximately 14,000 new 30,000
housing units annually to keep up with expected population growth and housing
25,000
demand. The plan includes a proposal to eliminate single-family zoning entirely
in the city of Minneapolis, allowing duplex and triplex units to be built throughout 20,000
the city, as well as a proposal to allow three- to six-story buildings along certain 15,000
transit corridors. Both are designed to encourage additional sales housing
10,000
development, particularly of higher density projects. As of June 1, 2019, the plan
has been approved by the Minneapolis City Council, but has not been approved 5,000
by the Metropolitan Council, the local regional planning office that recently offered 0
amendments to the document.
00
06
05
08
04
09
02
03
07
01
10
15
16
18
19
12
13
14
17
11
20
20
20
20
20
20
20
20
20
20
20
20
20
20
20
20
20
20
20
20
Construction Activity Notes: Includes single-family homes, townhomes, and condominiums. 2019 includes data through May 2019.
Sources: U.S. Census Bureau, Building Permits Survey; 2000 through 2017—final data and estimates by the
analyst; 2018 and 2019—preliminary data and estimates by the analyst
Construction of single-family homes and condominiums in the Minneapolis HMA,
as measured by units permitted, has increased modestly since recent low levels,
Table 7. Demand for New Sales Units in the Minneapolis HMA
but remains low compared with levels of construction during the previous decade. During the Forecast Period
During the 12 months ending May 2019, approximately 8,825 single-family homes
Sales Units
and condominiums were permitted in the HMA, slightly above the 8,800 units Demand 24,600 Units
permitted a year earlier. During 2003 and 2004, the number of sales housing Under Construction 2,430 Units
units permitted averaged 26,150 annually, and fell sharply, declining 35 percent Note: The forecast period is June 1, 2019, to June 1, 2022.
annually, to 4,625 units permitted during 2008. From 2008 through 2011, the Source: Estimates by the analyst
number of sales housing units permitted remained low, averaging 4,325 annually,
before increasing modestly, averaging gains of 13 percent annually, to 9,250
homes permitted during 2017. Figure 14 shows sales housing permitting activity
Sales Market—Central Counties
in the Minneapolis HMA. Submarket
Forecast Current Conditions
During the 3-year forecast period, demand is estimated for 24,600 new single- The sales housing market in the Central Counties submarket is slightly tight, with
family homes, townhomes, and condominiums in the HMA (Table 7). The 2,430 an estimated sales vacancy rate of 0.8 percent, down from 2.1 percent in April
homes currently under construction will satisfy some of this demand. Demand is 2010 (Table 8). The current homeownership rate in the submarket is estimated
expected to be strongest during the first year because of existing, unmet demand, at 60.7 percent, down from 63.3 percent in 2010 because of strong renter
which is likely to carry over into the second and third year of the forecast period. household growth. The foreclosure crisis shifted some owners into rental housing
Comprehensive Housing Market Analysis Minneapolis-St. Paul-Bloomington, Minnesota-Wisconsin
U.S. Department of Housing and Urban Development, Office of Policy Development and ResearchMinneapolis-St. Paul-Bloomington, Minnesota-Wisconsin Comprehensive Housing Market Analysis as of June 1, 2019 Sales Market—Central Counties Submarket 17
Table 8. Home Sales Quick Facts in the Central Counties Submarket to prerecession levels. During the 12 months ending May 2019, regular resales
Central Counties Minneapolis totaled 28,900, nearly 2 percent more than the 28,400 sales recorded a year
Submarket HMA earlier. Regular resales averaged 26,500 during 2005 and 2006 before falling
Vacancy Rate 0.8% 0.9% to a recent low of 12,350 sales during 2011. Since 2011, regular resales have
Months of Inventory 2.1 2.4 recovered and averaged 27,750 sales annually from 2015 through 2017. REO sales
Home Sales
Total Home Sales 31,700 70,750 totaled 1,200 during the 12 months ending May 2019, more than 30 percent fewer
1-Year Change 0.3% 1.3% than were reported a year earlier; REO sales at this time accounted for nearly
Quick Facts New Home Sales Price $511,200 $433,500
4 percent of all existing home sales. REO sales reached a recent peak of 9,900
1-Year Change -1% 2%
sales during 2009, when they accounted for 41 percent of all existing home sales.
Existing Home Sales Price $308,000 $284,700
Figure 15 shows home sales by type in the Central Counties submarket.
1-Year Change 4% 5%
Mortgage Delinquency Rate 0.7% 0.7% Figure 15. 12-Month Sales Totals by Type in the Central Counties Submarket
Notes: Vacancy rate is as of the current date, June 1, 2019. Home sales and prices are for the 12 months
ending May 2019. Months of inventory and mortgage delinquency data are as of May 2019. New Sales Regular Resale Sales REO Sales
Sources: Home sales and prices—Metrostudy, A Hanley Wood Company; delinquency rate—CoreLogic, Inc. 35,000
30,000
in the late 2000s and early 2010s; the rate of seriously delinquent mortgages and 25,000
mortgages that transitioned into REO status peaked in the submarket in January
Sales Totals
20,000
2010, at 5.8 percent of all outstanding mortgage loans. Despite strengthening
15,000
economic conditions, many new residents in the submarket continue to rent
10,000
rather than own due in part to the relatively high cost of sales housing and
5,000
scarcity of available sales housing units in the submarket. During the 12 months
ending May 2019, approximately 31,700 homes were sold, slightly more than the 0
31,600 home sales a year earlier; the average sales price was $318,500, nearly 4
6
8
9
7
0
5
6
8
9
2
3
4
7
1
y-0
y-0
y-0
y-0
y-1
y-1
y-1
y-1
y-1
y-1
y-1
y-1
y-1
y-1
Ma
Ma
Ma
Ma
Ma
Ma
Ma
Ma
Ma
Ma
Ma
Ma
Ma
Ma
percent more than the average sales price a year earlier.
REO = real estate owned.
Source: CoreLogic, Inc., with adjustments by the analyst
Home Sales
New home sales in the Central Counties Submarket totaled 1,625 sales during the Sales Prices
12 months ending May 2019, nearly 9 percent more than the 1,475 sales reported Although new home sales totals remain low compared with prerecession levels,
a year earlier (Metrostudy, A Hanley Wood Company). New home sales fell by new home sales prices are much higher than prerecession levels. During the
an average of 25 percent annually from 2006 through 2011, when a recent low 12 months ending May 2019, the average new home sales price was $511,200,
level of 910 new sales occurred. Since 2011, new home sales have increased approximately 1 percent below the $516,900 average sales price a year earlier,
modestly, with growth averaging 7 percent annually, to 1,400 sales during 2017 but nearly 43 percent higher than the prerecession high of $358,600 in 2008.
although new home sales activity remains well below the peak levels of the mid- New home sales prices reached their recent low average of $298,800 during
2000s. Regular (non-distressed) resale home sales have, by contrast, recovered 2010 but increased significantly beginning the following year with average gains
Comprehensive Housing Market Analysis Minneapolis-St. Paul-Bloomington, Minnesota-Wisconsin
U.S. Department of Housing and Urban Development, Office of Policy Development and ResearchMinneapolis-St. Paul-Bloomington, Minnesota-Wisconsin Comprehensive Housing Market Analysis as of June 1, 2019 Sales Market—Central Counties Submarket 18
of 13 percent annually from 2011 through 2014, when the average new home condominium sales remain below the levels in 2005 and 2006, when 9,850 and
sales price was $493,600. Since 2014, new home sales prices have been stable, 9,075 sales occurred, which represented 30 and 29 percent of total sales in the
averaging $509,300 annually during 2015, 2016, and 2017. Regular resale home HMA, respectively. Current average condominium sales prices are also below
sales’ average prices have also surpassed prerecession levels, and averaged prerecession values, which averaged a relatively stable $241,900 annually during
$310,100 during the 12 months ending May 2019, more than 3 percent above the 2005, 2006, and 2007, before declining to a low level of $167,700 during 2011.
average sales price a year earlier. Regular resale average prices reached a recent
low during 2009, when the average was $244,100. Prices for regular resale homes Construction Activity
remained modest during 2010, 2011, and 2012, averaging $253,100 during each of Single-family home construction, as measured by the number of building permits
those 3 years. After 2012, appreciation in regular resale prices occurred, averaging authorized, has trended upward since 2010, but is below prerecession highs.
slightly more than 3 percent annual growth, to $293,000 during 2017. Figure 16 Single-family homes permitted averaged 3,325 homes annually from 2001
shows average sales prices in the Central Counties submarket by sales type. through 2004, declined to an average of 2,800 homes annually during 2005 and
2006, and then fell sharply, with declines averaging 33 percent annually, to a
Figure 16. 12-Month Average Sales Price by Type of Sale
in the Central Counties Submarket recent low level of 790 homes permitted during 2009. The subsequent recovery
in single-family permitting has been more modest than the decline, with gains
550,000
New Sales Regular Resale Sales REO Sales averaging 13 percent annually, to 2,150 homes permitted during 2017. During
500,000 the 12 months ending May 2019, approximately 2,100 single-family homes have
450,000 been permitted in the submarket, down slightly from 2,125 homes permitted a
Average Sales Price
400,000 year earlier (preliminary data; Figure 17). Permitting of condominium units also is
350,000
($)
300,000
250,000 Figure 17. Average Annual Sales Housing Permitting Activity
200,000 in the Central Counties Submarket
150,000
100,000 Single-Family Homes/Townhomes Condominiums
6,000
6
8
9
7
0
5
6
8
9
2
3
4
7
1
y-0
y-0
y-0
y-0
y-1
y-1
y-1
y-1
y-1
y-1
y-1
y-1
y-1
y-1
Ma
Ma
Ma
Ma
Ma
Ma
Ma
Ma
Ma
Ma
Ma
Ma
Ma
Ma
5,000
REO = real estate owned.
Source: CoreLogic, Inc., with adjustments by the analyst 4,000
3,000
Condominium Sales Activity 2,000
Sales of condominium and other attached units are notably more prevalent
in the Central Counties submarket than in the Suburban Counties submarket. 1,000
Sales of new and existing condominium units averaged 8,975 during the 12 0
months ending May 2019, nearly 29 percent of all new and existing sales in the
00
06
05
08
04
09
02
03
07
01
10
15
16
18
19
12
13
14
17
11
20
20
20
20
20
20
20
20
20
20
20
20
20
20
20
20
20
20
20
20
submarket, and an increase of 2 percent from condominium sales totals a year
Notes: Includes single-family homes, townhomes, and condominiums. 2019 includes data through May 2019.
earlier. Also, during the 12 months ending May 2019, the average sales price Sources: U.S. Census Bureau, Building Permits Survey; 2000 through 2017—final data and estimates by the
was $229,000, or 6 percent above the average sales price a year earlier. Total analyst; 2018 and 2019—preliminary data and estimates by the analyst
Comprehensive Housing Market Analysis Minneapolis-St. Paul-Bloomington, Minnesota-Wisconsin
U.S. Department of Housing and Urban Development, Office of Policy Development and ResearchYou can also read