FY 2018/19 RESULTS PRESENTATION - 12 December 2019 - Metro AG
←
→
Page content transcription
If your browser does not render page correctly, please read the page content below

FY 2018/19
RESULTS PRESENTATION
12 December 2019

DISCLAIMER AND NOTES
To the extent that statements in this presentation do not relate to historical or current facts, they constitute forward-looking statements.
All forward-looking statements herein are based on certain estimates, expectations and assumptions at the time of publication of this presentation and
there can be no assurance that these estimates, expectations and assumptions are or will prove to be accurate. Furthermore, the forward-looking
statements are subject to risks and uncertainties that could cause actual results, performance or financial position to differ materially from any future
results, performance or financial position expressed or implied in this presentation. Many of these risks and uncertainties relate to factors that are beyond
METRO AG's ability to control or estimate precisely. The risks and uncertainties which these forward-looking statements may be subject to include
(without limitation) future market and economic conditions, the behavior of other market participants, invest in innovative sales formats, expand in online
and multichannel sales activities, integrate acquired businesses and achieve anticipated cost savings and productivity gains, and the actions of government
regulators. Readers are cautioned not to place reliance on these forward-looking statements. METRO AG does not undertake any obligation to publicly
update any forward-looking statements or to conform them to events or circumstances after the date of this presentation.

This presentation is intended for information only and should not be treated as investment advice or recommendation. It is not, and nothing in it should be
construed as an offer for sale, or as a solicitation of an offer to purchase or subscribe to, any securities in any jurisdiction. Neither this presentation nor
anything contained therein shall form the basis of, or be relied upon in connection with, any commitment or contract whatsoever. This presentation may
not, at any time, be reproduced, distributed or published (in whole or in part) without prior written consent of METRO AG.

Not all figures included in this presentation have been audited and certain figures may also deviate substantially from information in the consolidated
financial statements of METRO AG, thus, may not be fully comparable to such financial statements. The hypermarket business for sale is reported as a
discontinued operation as of 30 September 2018 due to the ongoing sales process. Following the signing of the contract for the disposal of a majority stake
in METRO China to Wumei Technology Group, METRO China has been reported as discontinued operation as of 30 September 2019. METRO will retain only
20% stake in METRO China. The discontinued segment primarily includes Real, majority of METRO China and some other individual companies or assets. All
following explanations of the business development will focus on the continued operations unless stated otherwise

This presentation includes supplemental financial measures which are or may be non-GAAP financial or operative measures. These measures should not be
viewed in isolation as alternatives to financial measures presented in accordance with IFRS. Other companies that disclose similarly titled measures may
calculate them differently. All amounts are stated in million euros (€ million) unless otherwise indicated. Amounts below €0.5 million are rounded and
reported as 0. Rounding differences may occur.

2   12/12/2019   © METRO AG.

RECAP: CONTINUOUS JOURNEY TO SIMPLIFY AND
REPOSITION METRO AS A WHOLESALER

           METRO is transforming into a fully focused Wholesale company

           We steadily optimize our portfolio to further strengthen our B2B profile

           Intensified focus has lead to rising LFL momentum, strongly driven by sales growth with Horeca and Trader

          Building a wholesaler 360° provides the potential for even stronger differentiation and further growth

          Today’s results show progress and deliver proof across all of these dimensions

3   12/12/2019   © METRO AG.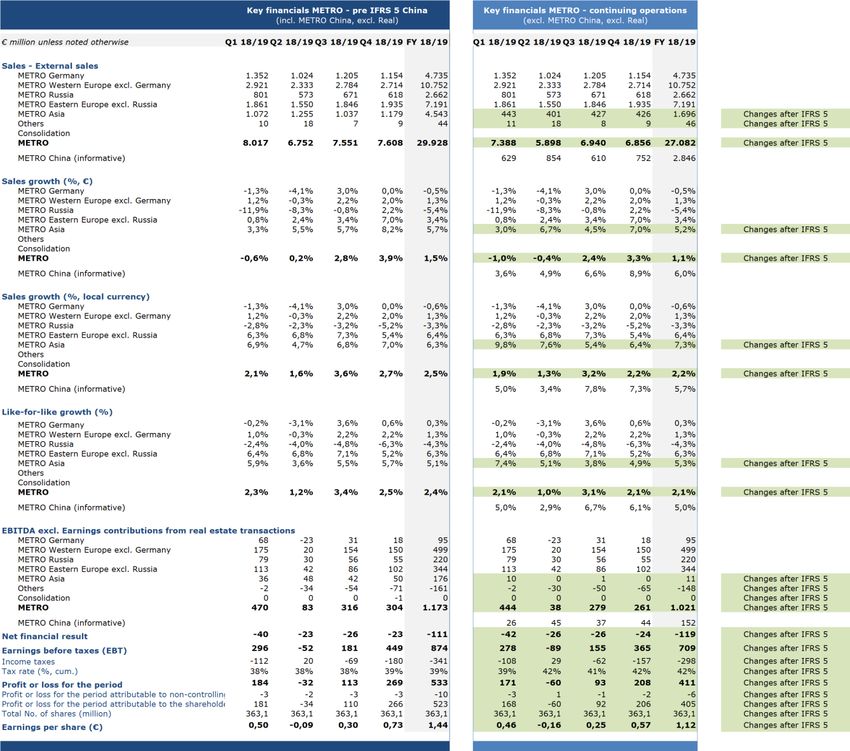
OUR ORIGIN IS
                                                 WHOLESALE                IS OUR FUTURE

                                                                INTENSIFICATION
                                                                Year of Extension

                     2017/18                                  2018/19

                                                      1. Business model extension further strengthened customer focus

                               ACTIVATION              2. Sustainability priorities for us and our customers sharpened
                        Becoming a pure Wholesaler
                                                              3. All financial targets achieved or outperformed

                                                            4. Significant progress on portfolio simplification and

                                                                   funds for further acceleration unlocked

4   12/12/2019   © METRO AG.
Guidance view (continuing operations incl. China)

SUCCESSFUL EXTENSION OF BUSINESS MODEL…

                                                                                                                     Store
                            Horeca                                                                                   +0.7%                                   Products
                                                                                                                     LfL
                            +4.5%
                                                                                                                     Delivery
                                                                                                                     ~+10%
                          Trader1                                                                                    Total

                          +5.1%
                                                                                                                     Franchise                              Marketplace

                                                                                                                     +15%
                                                                                                                     Franchise partners

                                                                                                                                               Addressing all customer needs
     Customer focus drives repeated                                                            Additional channels solidify
                                                                                                                                               through a full suite of wholesale
     like-for-like growth with target                                                        customer loyalty and revitalize
                                                                                                                                               products, services and solutions
                  groups                                                                                the store
                                                                                                                                                    constitutes our USP

1:   Trader countries: Bulgaria, Czech Republic, India, Pakistan, Poland, Romania, Serbia, Slovakia (excl. Russia)

5       12/12/2019      © METRO AG.
… BASED ON DEEP AND SUSTAINABLE RELATIONSHIPS

                      Market Size           1

                                                                                                             >125k daily Horeca
                          301                         294
                                                                                                             visits in our stores
                                         60

                       Western Eastern                Asia
                                                                                                             >65k daily Trader visits
                       Europe Europe

                                                        452                                                  >50k daily customer
                         207             174
                                                                                                             contacts with our sales
                                                                                                             force employees
                      Western         Eastern           Asia
                      Europe          Europe

   Operating in fragmented,                                                                           Benefiting from recurring revenues                                                                     Making sustainable operations
growing markets, offering further                                                                     through contract-like customer                                                                            a priority for us and our
    opportunities for growth                                                                                      relationships                                                                                        operations
Source: own data based on internal management system
1. EURb, sell-out value 2018, MCC countries. Note: WE incl. DE, EE incl. RU, Asia without CN; MCC countries excl. countries with pure play FSD operations (e.g. CFF) HoReCa market according to Euromonitors definition excluding social foodservice. Trader market including traditional grocery
retailers, forecourt and CVS. Source: Euromonitor

6     12/12/2019         © METRO AG.
SUSTAINABILITY PRIORITIES DEFINED AND
RECOGNIZED
        Clear priorities for us & our customers                                                                  …repeatedly recognized by institutions

                                        impact on customer’s businesses

        Prio 1: Partnering for Food Waste solutions
    •       Partnership with Too Good To Go. Helping to tackle food waste
            for restaurants and canteens
        Prio 2: Conscious proteins                                                                                  Industry       Prime Status C+    Index member
                                                                                                                  Leader Europe     (Rank D- to A+)
    •       Insect pasta to support conscious protein consumption and
            decrease of conventional meat intake, supported by NX Food1
    •       Roll-out of Beyond Meat Burger in 15 countries
                                                                                                                     Climate           Water            Forest
        Prio 3: Organic and Responsible Products
    •       Offering a sustainable assortment to our customers
    •       Sustainable raw material sourcing policies (fish & seafood,                                             Rating A-        Rating B-        To come in
            paper & wood in place, while palm oil, soy, social standards in                                        (Rank F to A)    (Rank F to A)        2020
            implementation); meat and fruit & vegetable under
            development

Find our latest report below: reports.metroag.de
    1   NX Food – A hub of METRO, operating in the field of food innovation and food tech https://nx-food.com/

7        12/12/2019      © METRO AG.
Guidance view (continuing operations incl. China)

GUIDANCE ACHIEVED IN UPPER END OF RANGE

                Sales growth1                      P         LfL sales growth1                        P                    EBITDA                         P

                                                                                                               €1,242 m
                             1-3%                                          1-3%                                                         - 2.6%
                                                                                                                                        excl. VTO costs
                                          2.5%                                           2.4%

                                                                                                                                        - 4.2%
             1.5%                                                                                                            2-6%
                                                             1.3%
                                                                                                                            decline1

          FY 17/18        FY 18/19      FY 18/19           FY 17/18      FY 18/19       FY 18/19                FY 17/18   FY 18/19    FY 18/19
                          Guidance                                       Guidance                                          Guidance

    •     Upper end of guidance range                  •   Upper end of guidance range,                    •    Upper end of guidance range if
                                                           highest Wholesale LfL growth in                      adjusted for ~€20 m EUR VTO costs
    •     Growth driven by Eastern Europe                  a decade
          (excl. Russia) and Asia                                                                          •    Germany, Western Europe, Asia
                                                       •   Western Europe, Eastern                              with EBITDA growth
    •     Western Europe with solid growth                 Europe, Asia with growth above PY
                                                                                                           •    “Others” below PY due to cost of
                                                       •   Russia with trend improvement                        digitalization / IT
1   At constant FX and before portfolio measures

8       12/12/2019   © METRO AG.
Guidance view Pre IFRS 5

 ACCELERATING AND RELIABLE MOMENTUM CLEARLY
 VISIBLE IN LONG-TERM SALES TRENDS
                                                                                                                            Horeca outperforming…                                                       …rapidly increasing Delivery3 sales…

                                                                                                        Horeca LfL sales growth (METRO Wholesale)                                              Delivery as % of sales (METRO Wholesale)
                                                                                                                                                                         4.2%                                                                       18%
                                                                                                                                                                        Excl. CN                                                                   Excl. CN

                                                                                                                                          4,1%                           4,5%                                                                       20%
                                                                                                           3,5%            3,9%                          3,7%                                                                             18%
                                                                                                                                                                                                                                16%
                                                                                                                                                                                                  11%            13%

             Consistently positive Wholesale LfL growth

LfL sales growth (METRO Wholesale)                                                                       FY 14/15 FY 15/16 FY 16/17 FY 17/18 FY 18/19                                          FY 14/15 FY 15/16 FY 16/17 FY 17/18 FY 18/19

       Mid-term ambition                                              3.0%2
       3%                                                             2,4%
                                                       1,3%                                                …consistently improved Trader development…
         0,9%                           0,9%                                                                                                                                                                        …growing Food sales
                         0,6%
                                                                                                        LfL sales growth (METRO Wholesale) Trader Countries1                                   LfL food sales growth (METRO Wholesale)
                                                                                                                                                                                                                                                    2.8%
       FY 14/15 FY 15/16 FY 16/17 FY 17/18 FY 18/19                                                                                                                      5,1%                                                                      Excl. CN
                                                                                                                                          4,5%           4,6%
                                                                                                                                                                                                                                                    3,1%
                                                                                                                                                                                                  2,1%                          2,1%      1,9% 4
                                                                                                                                                                                                                 1,7%

                                                                                                                          -0,1%
                                                                                                           -1,7%
                                                                                                         FY 14/15 FY 15/16 FY 16/17 FY 17/18 FY 18/19                                          FY 14/15 FY 15/16 FY 16/17 FY 17/18 FY 18/19

 1   Trader LfL excl. Russia: Bulgaria, Czech Republic, India, Pakistan, Poland, Romania, Serbia, Slovakia
 2   Excluding Russia 3 Delivery definition has been changed in the Annual report to exclude transportation after checkout and pick up, for this slide it is still included   4   Financial view before IFRS 5

 9       12/12/2019      © METRO AG.
ACHIEVEMENT OR OUTPERFORMANCE OF ALL
FINANCIAL TARGETS – €0.70 DPS PROPOSED

          Sales growth and EBITDA – upper end of guidance                  P

          Real estate gains – ~€100 m better than originally expected      P
                                                                               €0.70 dividend
                                                                                  proposed
                                                                                (€0.70 17/18)
          D&A, net financial result, tax rate – better than expected       P

          EPS ~€0.20 better than expected (mostly real estate)             P

          Cash flow – NWC, capex savings, real estate gains drive growth   P

10   12/12/2019   © METRO AG.
MILESTONE TRANSACTIONS REAL AND CHINA
Transaction summary Key benefits
– sale of hypermarket business
Portfolio simplification – one sales line P
• Entered into MoU and exclusive negotiations for the sale of
Hypermarket business with SCP Group and x+bricks
• 100% stake to be sold
• Transaction expected to be signed end of January 2020
Wholesale focus – 70% Horeca & Trader sales P
– sale of majority stake in METRO China
Grow Horeca & Trader – accelerate momentum P
• Sale of majority stake in METRO China to Wumei signed
• Values METRO China at €1.9 bn EV (>12x EV/EBITDA)
• METRO to retain 20% stake and participate in valuation upside Unlock >€1.5 bn1 – grow business, reduce
leverage P
• Closing expected Q2 calendar year 2020
1 as per Sep 19 accounts.
11 12/12/2019 © METRO AG.FY 2018/19 IN A NUTSHELL – SOLID YEAR
Business model • Focus drives repeated growth with target groups
extension • Omnichannel revitalizes the store and drives loyalty
strengthened • Wholesale 360: Addressing all customer needs
customer focus constitutes our USP
• Clear priorities: food waste,
Sustainability
organic & responsible products, conscious proteins
priorities
sharpened • Recognized through top ratings by key institutions,
e.g. DJSI, CDP, ISS Oekom
2018/19
Intensification All financial
targets • Sales and EBITDA in upper end of guidance range
Extension of our
wholesale model achieved or • €1.44 EPS; €0.70 DPS proposed to shareholders
outperformed
Significant • Majority stake in METRO China sold to Wumei
progress on
• Real - expected signing end of January 2020
portfolio
simplification • >€1.5 bn proceeds1 expected to be unlocked to grow
business
1 as per Sep 19 accounts.
12 12/12/2019 © METRO AG.02 FINANCIAL PERFORMANCE 13 12/12/2019 © METRO AG.
Guidance view (continuing operations incl. China)

SALES TO EBITDA – 9M TRENDS CARRY OVER INTO
FULL YEAR
  €m / %
                                                                 Q4                     Q4                      FY            FY              Like-for-like growth
                                                               2017/18                2018/19                2017/18       2018/19
                                                                                                                                              • Acceleration of like-for-like growth driven by
 Like-for-like growth                                             1.7%                    2.5%                  1.3%        2.4%                most regions
     thereof Food                                                  2.2%                   3.4%                   2.0%       3.1%              Reported growth
 Reported growth                                                  -1.7%                   3.9%                  -1.4%       1.5%              • Negative FX effects predominantly from
                                                                                                                                                Turkey and Russia
 Growth in local currency                                         1.5%                    2.7%                  1.5%        2.5%
                                                                                                                                              • Sales grew by 2.5% in local currency
                                    1
 Delivery Sales Share                                               18%                    19%                   17%        18%               EBITDA excl. real estate
 EBITDA excl. RE gains                                              322                    304                  1,242       1,173             • EBITDA well within guidance range
                                                                                                                                              • Operational improvement in France, Pro à
     thereof FX                                                                              6                               -17
                                                                                                                                                Pro and Germany
 EBITDA margin excl. RE gains                                     4.4%                    4.0%                  4.2%        3.9%              • Negatively affected by ~€20 m VTO costs in
                                                                                                                                                Q4
 Real estate gains                                                  121                    323                       128     388
                                                                                                                                              Real estate gains
 Total EBITDA                                                       443                    627                  1,370       1,561
                                                                                                                                              • FY 18/19 expectation of c.€250-300 m in
                                                                                                                                                real estate gains has been overachieved due
                                                                                                                                                to earlier execution of two projects in China

1.Including   METRO China. New definition of delivery, which excludes transportation after check out and pick up .

14   12/12/2019         © METRO AG.
Guidance view (continuing operations incl. China)
MAJORITY OF REGIONS GROW SALES AND EBITDA
Germany Western Europe
FY FY FY FY
€m / % €m / %
2017/18 2018/19 2017/18 2018/19
3,1%
Sales 4,761 4,735 2,4% Sales 10,609 10,752
2,0%
Like-for-like growth 0.9% 0.3% Like-for-like growth -0.4% 1.3%
1,3%
Reported growth 0.3% -0.5% Reported growth 1.7% 1.3%
EBITDA excl. RE gains 91 95 EBITDA excl. RE gains 491 499
EBITDA margin 1.9% 2.0% FY 2017/18 FY 2018/19 EBITDA margin 4.6% 4.6%
Constant FX to PY 4 Like-for-like growth Thereof: Food Constant FX to PY 8
Russia Eastern Europe Asia
FY FY FY FY FY FY
€m / % €m / % €m / %
2017/18 2018/19 2017/18 2018/19 2017/18 2018/19
Sales 2,815 2,662 Sales 6,952 7,191 Sales 4,298 4,543
Like-for-like growth -7.0% -4.3% Like-for-like growth 6.1% 6.3% Like-for-like growth 4.0% 5.1%
Reported growth -16.3% -5.4% Reported growth 1.0% 3.4% Reported growth -1.4% 5.7%
1
EBITDA excl. RE gains 256 220 EBITDA excl. RE gains 363 344 EBITDA excl. RE gains 162 176
EBITDA margin 9.1% 8.3% EBITDA margin 5.2% 4.8% EBITDA margin 3.8% 3.9%
1
Constant FX to PY -30 Constant FX to PY -11 Constant FX to PY 14
1 Adjusted for c. €10m one-time gain from Ceconomy in 2017/18
15 12/12/2019 © METRO AG.Guidance view (continuing operations incl. China)
REAL ESTATE – EXCEPTIONALLY STRONG YEAR; PARTLY
DUE TO EARLIER EXECUTION OF PROJECTS IN CHINA
2018/19 (€388 m gains) 2019/20 and beyond
Germany, Spain,
India China 2019/20 Thereafter
Eastern Europe
• Spillover from 2017/18 • Project development in • Early execution of two • Preponed transactions • Sustainable level of
Germany project development and value real estate gains (post
• Project development transactions out of crystallization of China IFRS 16 application) of
• Sale-and-leaseback in M&A scope with portfolio in transaction ~€100 m p.a.
• EBITDA gain ~€38 m Spain and Eastern Wumei1 with Wumei
Europe • Various projects in
• EBITDA gain ~€120 m • Preponement Europe and Asia in
• EBITDA gain ~€230 m significantly decreased preparation
2019/20 pipeline to
~€10 m
1One real estate property is excluded from the SPA with Wumei, the price will be paid directly to METRO Group. The second location is within the transaction scope with Wumei, whereby the sales price of the property
will be paid to the company, but cash flow of the property sale will be included in the sales price from Wumei
16 12/12/2019 © METRO AG.Guidance view (continuing operations incl. China)
EPS INCREASE DRIVEN BY EBITDA GROWTH AND
BETTER REFINANCING
Q4 Q4 FY FY D&A
€m / %
2017/18 2018/19 2017/18 2018/19 • Increase in D&A driven by higher IT-
EBITDA 443 627 1,370 1,561 investments with shorter useful life
D&A -141 -155 -547 -577
Net financial result
• Improvement in interest and investment
EBIT 302 472 823 985 result due to better refinancing
Interest and investment result -38 -27 -128 -112 Tax
Other financial result 0 4 -2 2 • In line with expected 37-39%
• Last year exceptionally good tax rate due to
Net financial result -38 -23 -130 -111
one-time effects coming from tax law
EBT 264 449 693 874 changes and revised risk evaluation
• Current year positively impacted by high
Tax rate -35% -39%
real estate gains in low tax rate countries,
Net income 199 266 443 1 523 compensated by write-off of deferred tax
assets related to planned efficiency
EPS in € 0.55 0.73 1.22 1.44 measures
EPS
• Significant EPS increase due to earlier
execution of two real estate transactions in
China and better net financial result
1Lease contracts previously based on Euro had to be converted into Turkish Lira, resulting in retrospective adjustment
of deferred taxes assets and liabilities
17 12/12/2019 © METRO AG.€0.70 DPS PROPOSED; REPORTED EPS IMPACTED BY
IMPAIRMENT IN DISCONTINUED OPERATIONS
Q4 Q4 FY FY EPS from continuing operations
€/%
2017/18 2018/19 2017/18 2018/19
• Significant EPS increase due to earlier
EPS from continuing operations execution of two transactions in China and
0.55 0.73 1.22 1.44 better net financial result
incl. METRO China
Proposed DPS
Proposed DPS 0.70 0.70
• Proposed dividend of €0.70 based on
continuing operations EPS, resulting in 49%
EPS from disc. Operations incl. payout ratio
-0.28 -0.59 -0.30 -1.79
real
EPS from discontinued operations
Reported EPS 0.27 0.14 0.92 -0.35
• Decrease is predominantly driven by
impairment on hypermarket business
Reported EPS pre impairment 1.05 0.76
Reported EPS
• Decrease in reported EPS only due to
development of EPS from discontinued
operations
• Before impairment, reported EPS is at €0.76
18 12/12/2019 © METRO AG.Guidance view (continuing operations incl. China)
SALES AND EBITDA GROWTH REFLECTED IN SOLID
CASH GENERATION
Q4 Q4 FY FY Change in NWC
€m / %
2017/18 2018/19 2017/18 2018/19 • Last year was supported by seasonal tailwinds
and a one time negative impact the year
EBITDA 443 627 1,370 1,561
before
Change in NWC 546 469 179 45 • Positive result this year has been driven once
1 again by stock optimization
Capex -208 -182 -5522 -455
Capex
FCF 781 914 997 1,152
• Continuous investment into IT and
FCF Conversion in % 73% 74% digitalization together with decreased number
of store openings (NSOs CY: 6 and PY: 14)
Net Debt 2,710 2,382
FCF
Net Debt Continuing operations • Overall increase by €155 m to 74%
3,102 2,858
(METRO China in IFRS5) conversion, also supported by real estate gains
Net debt
• Year-on-year improvement due to operating
and investing cash flow development
• Higher real estate gains
• NWC optimization
• Focused investments
1 Capex excl. M&A and finance leases 2 Capex definition has been adjusted to fully exclude finance leases, previously this only excluded finance lease extensions
19 12/12/2019 © METRO AG.REFLECTING THE PENDING SALE OF METRO CHINA IN
FINANCIAL REPORTING
Impacts on financial reporting Key financials excl. China
IFRS 5 (discontinued operations)
Guidance Cont.
• China reported as disc. operations from 30 Sep 19 onwards
FY 2018/19 view Operations
• Stop of regular depreciation from 1 Oct 2019 onwards (incl. China) (excl. China)
• Detailed reconciliation in appendix as well as on homepage Sales 29,928 27,082
Sales growth (LC) 2.4% 2.2%
Group view Sales growth (like-for-like) 2.5% 2.1%
• Impacts all group financial statements EBITDA 1,173 1,021
• Balance sheet 17/18 not adjusted; all other statements both Real estate gains 388 338
years adjusted Depreciation -577 -531
Net financial result -111 -119
Segment view Tax rate (12M) 39% 42%
• METRO Asia, ‘Others’ and Consolidation affected EPS 1.44 1.12
• Remaining segments unchanged
20 12/12/2019 © METRO AG.FY 2018/19 IN A NUTSHELL – SOLID FINANCIAL
PERFORMANCE
• Solid 9M trends carryover into FY
2018/19 good
• Majority of regions grow sales and EBITDA
financial year
• Sales & EBITDA growth reflected in cash generation
Exceptionally • Partially driven by earlier execution of China projects
strong year for • Sale of China preponed crystallization of pipeline
real estate • Nonetheless, €100 m sustainable level of earnings
from FY2020/21
2018/19
• EPS increase driven by EBITDA and refinancing
Intensification EPS growth
Extension of our
• €0.70 DPS proposed; in line with dividend policy
and stable DPS
wholesale model • Reported EPS impacted by impairment in disc. ops.
Solid • China reported as discontinued operations
underlying • Underlying operational trends are solid, irrespective
business of the reporting view
21 12/12/2019 © METRO AG.Continuing operations only (METRO China in IFRS 5)
FINANCIAL AND NON FINANCIAL IMPACTS IN 2019/20
• Closing expected in Q2 2020 with ~€3 EPS gain
China
• METRO to retain 20% stake; effects not accounted for in outlook >€1.5 bn1 in
net
proceeds
• Sale of 100% of Hypermarket business expected
Real
• Expected signing end of January 2020; closing expected in FY 2019/20
• 19/20 pipeline €10 m post value crystallization in China transaction
Real estate gains
• Sustainable level of real estate gains (post IFRS 16 application) of ~€ 100m from 20/21
• Organizational rightsizing: €60 to 80 million one-time expenses in 2019/20
Efficiency measures
• Long-term annual savings in the mid-double-digit million range
• IFRS 16 replaces current applicable standards IAS 17 and IFRIC 4
IFRS 16 • METRO applies ‘full retrospective method’ with adaption of previous year starting in 19/20
(leases) • Expected effects continuing business: c. €2.6 bn net debt increase; c. €0.4 bn EBITDA increase
• METRO will provide booklet with restated FY18/19 financials ahead of Q1 FY19/20
1 as per Sep 19 accounts.
22 12/12/2019 © METRO AG.Continuing operations only (METRO China in IFRS 5)
UNDERLYING OPERATIONAL MOMENTUM TO CONTINUE
EBITDA share Sales1,2 EBITDA2
(rounded, in %)
2018/19 2019/20 2018/19 2019/20
+2.1% +1.5-3.0% € 1,021m
Western Europe Reap
60
Germany benefits
Gain
Eastern Europe
market 35
Asia share
Russia Reposition 20
Others -15
1 Figures shown relate to like-for-like sales growth.
2 At constant FX and before portfolio measures and transformation costs.
23 12/12/2019 © METRO AG.03 STRATEGIC UPDATE 24 12/12/2019 © METRO AG.
HORECA AND TRADER MAKE UP 70% OF SALES AND
DRIVE GROWTH

                             Horeca                                                                                                                                               Trader
                                                                                            48%                                       22%                               +5.1% LfL growth
               +4.2%1 LfL growth
                                                                                           Horeca                                     Trader
                Restaurants, cafés,                                                                                                                                    Traders, kiosks,
                caterers, hotels, canteens                                                                                                                             mom-and-pop-shops, kiranas

                Customers are predominantly                                                                                                                          An independent entrepreneur
                independent with single or few                                                                                                                       running his own retail business.
                locations                                                                                           30% SCO                                          Supplying consumers nearby

           Customer sales shares FY 2018/194
            Western Europe                                       Germany                                                Asia3                                 Eastern Europe                                         Russia

                                                                                                                                                                                                                        16%

                                                                            46%                                               40%                                          37%
            16%        65%
                                                                                                                                                                                                                           30%
                                                                                                                     31%
                                                                    13%                                                                                             31%

1Like-for-like sales FY 2018/19 excluding China 2 Trader countries (Bulgaria, Czech Republic, India, Pakistan, Poland, Romania, Russia, Serbia, Slovakia) excl. Russia 3Excluding China 4Like for like sales FY 2018/19. Number of countries reviewed the
customer branches, hence the sales shares have changed in Germany, Eastern Europe and Russia

25   12/12/2019      © METRO AG.
WE DRIVE LASTING SUCCESS WITH CLEAR +1%p NPS
PRIORITIES FOR HORECA CUSTOMERS improvement1
Activate passionate and
Lead in assortment relevance Lead in product quality
purpose driven teams
Salesforce Own brand Quality
~6,500 sales force Cooperation with chefs,
assurance
employees customers & suppliers >600 people
~10 customer contacts 17% sales share3 working daily to
/ sales force employee ensure on the
+6%2 growth quality of the
/ day
~24% share in FSD3 assortment
Own business day Local products Traceability
Celebrates business Close collaboration with Transparency along the
owners by advertising regional suppliers to entire value chain
them on an online fulfil local needs and Turkey, Germany and
platform with special address trend to buy other countries
ideas & offers local products
>300k businesses
Please scan QR code for
>650k specials demonstration
1 NPS score with Horeca customers compound growth over quarters FY 2018-19, excluding China 2 Like-for-like sales FY 2018/19 for Horeca excl. China 3 Like-for-like sales FY 2018/19, excl. China and acquisitions
26 12/12/2019 © METRO AG.WE DRIVE LASTING SUCCESS WITH CLEAR +9%p NPS
improvement1
PRIORITIES FOR TRADER CUSTOMERS
Becoming the wholesale price Achieve recurring revenues
Customer success focus
and cost leader through partnership
Equip customers to Low price, 3 mechanics
differentiate from competition Trader Franchise
• EDLP3 on regular articles
• Core assortment ~7,500 stores in 18/19
• BMPL4 to reward price
• Specialized range & local products +15% vs 17/18
per volume approach
• Generating footfall through dedicated 3-4x more visits with
• 25% margin guarantee on
solutions up to 2.5x higher
Own Brand2
basket than non-
franchisees
Strip down to sell up ~€ 490m sales in
18/19
• Processes are optimized: easy in –
easy through – easy out One of the fastest
growing strategic
• No frills – low cost pillars for METRO
• Massification, pallet presentation &
shelf ready boxes
1 NPS score with Trader customers compound growth over quarters FY 2018-19 , excluding China 2 As a reference from our Own Brand approach in Poland. 3 Every Day Low Prices 4. Buy More Pay Less
27 12/12/2019 © METRO AG.WHOLESALE 360 – BROADENING THE BUSINESS
TO BECOME THE SERVICE AND SOLUTION PARTNER
Allocation of spend in Hospitality SME
Clear and truly unique selling proposition of 9%
generating significant value for our customers
Other1
More insights enabled by data will lead to
35%
unbeatable sector knowledge
25% Goods
Utilities
Partnering up with our customers at such a strong &
level will implant METRO into their business Leases
METRO as signature brand that stands for true &
honest contribution to the success of SMEs
Staff
31%
Source: Eurostat
1Other includes e.g. Marketing, Transportation
28 12/12/2019 © METRO AG.WE ADDRESS ALL CUSTOMER NEEDS WITH A SUITE OF
PRODUCTS, SERVICES AND SOLUTIONS
Food and non-food products that
make restaurateurs and retailers
successful. With 100% quality and Prerequisite for good
Strategic cooperation local focus advice: understanding.
allows integrated We know the challenges
solutions – for example, of our customers and
professional kitchen respond with
appliances on preferential individualized consulting
terms Products
To help our customers For us, more than just a
achieve their goals, we nice ‘extra’. Useful tools
are breaking new ground increase efficiency and
Marketplace
– and offering financial create added value. For
support, for example retailers, restaurateurs
and guests
Everything restaurateurs need, on 1
platform. From drinking straws to
dining sets. METRO MARKETS makes
it possible
29 12/12/2019 © METRO AG.WE HAVE ADDED MANY LOCAL OFFERINGS IN 2018/19
Products
Analyse & optimise the menu
Marketplace
MENU KIT
30 12/12/2019 © METRO AG.FY 2018/19 IN A NUTSHELL – SUCCESSFUL EXTENSION
OF BUSINESS MODEL
• Horeca and Trader: 70% of sales and drive growth
Customer focus
• Horeca: +4.2% in 18/191
pays off
• Trader: +5.1% in 18/192
Clear priorities
for Horeca • Activate passionate and purpose-driven teams
customers • Lead in assortment relevance and product quality
(mostly Western Europe • +1%p improvement of NPS score
and Germany)
2018/19 Clear priorities
• Becoming the wholesale price leader and cost leader
Intensification for Trader
customers • Achieve recurring revenues through trader franchise
Extension of our
wholesale model (mostly Eastern Europe, • +9%p improvement of NPS score
Russia, parts of Asia)
• Broaden the business; become the #1 partner
Wholesale 360 • We address all customer needs and have successfully
business model launched many offerings in 2018/19, e.g.
extension Gourvenience, Pentagast, METRO Markets
1 Like-for-like sales FY 2018/19 excluding China 2 Trader countries (Bulgaria, Czech Republic, India, Pakistan, Poland, Romania, Russia, Serbia, Slovakia) excl. Russia
31 12/12/2019 © METRO AG.04 OUTLOOK & GUIDANCE 32 12/12/2019 © METRO AG.
OUTLOOK FOR 2019/20

                                              Guidance1                                                                                      Topics on our agenda for next year

                                                                                                                                  Finalize milestone transactions
                                              FY 2018/19                            FY 2019/20                                    •          Real: closing FY 2019/20

               Sales                                                                                                              •          METRO China: closing expected by Q2 2020, ~€3 EPS
          growth in local                            2.2%                          1.5-3% growth                                             gain
             currency
                                                                                                                                  •          Jointly >€1.5bn proceeds2 expected

             LfL growth                              2.1%                          1.5-3% growth
                                                                                                                                  Adjust HQ structures accordingly
                                                                                                                                  •          Lean and efficient holding structure to reflect portfolio
                                                                                      On PY level                                            rationalization and wholesale purification

            EBITDA excl.                                                           Russia to decline
             real estate                          €1,021m                            €20-30m;
               gains                                                               compensated by                                 Accelerate operational momentum
                                                                                   Western Europe
                                                                                    and Germany                                   •          Further sharpen Horeca & Trader value proposition
                                                                                                                                  •          Wholesale 360 roll-out

1   At constant FX and before transformation costs, portfolio measures and IFRS16. Continuing operations only (METRO China in IFRS 5).   2   as per Sep 19 accounts.

33     12/12/2019      © METRO AG.
TRANSACTION PROCEEDS TO ACCELERATE GROWTH OF
CORE…
Horeca3 1 Investment in business
Goal: accelerate sales growth, drive
+4.2% sustainable EBITDA growth
>€1.5 bn 2 Returns to shareholders
Goal: sound shareholder return in balance
Trader1 expected net proceeds from transactions2 with operational needs
+5.1% 3 Deleverage
Goal: funds from operations (FFO)
/ Adj. net debt ≥ 21%4
Consistent high growth …to be accelerated by expected
…in line with our
momentum in target net proceeds from two milestone
capital allocation framework
customer groups… transactions…
1Trader countries: Bulgaria, Czech Republic, India, Pakistan, Poland, Romania, Serbia, Slovakia (excl. Russia) 2 Preliminary, based on Sep 19 accounts; subject to closing accounts 3 Like for like sales FY 2018/19 , excl. China 4 S&P threshold; at
minimum required to be in line with expectations to maintain credit rating.Funds from operations (FFO) as per S&P methodology mainly includes: EBITDA + fictitious depreciation share of operating lease expense + interest expense + income taxes +
minor further adjustments. Adjusted net debt as per S&P methodology mainly includes: financial debt – cash & cash equivalents (after a haircut on trapped cash) + NPV of operating leases (at 7.0%) + pensions (net of deferred taxes applicable) +
minor further adjustments
34 12/12/2019 © METRO AG.…WITH AMBITION TO CLOSE THE GAP TO PREVIOUS
EBITDA LEVELS IN NEXT 3 YEARS
• Reap benefits of successful and established Horeca-focused strategy
Organic growth • Capitalize on market share gains in Trader-focused countries
• Realize return on wholesale 360 and related digital activities
• Operating in growing but highly fragmented markets, benefiting from favorable consumer trends
Acquisitions • Acquisition of Pro à Pro resulted in both organic growth and realization of synergies
• Serves as blueprint for further densification in Horeca-focused markets
• Administrative structures already repeatedly adjusted during 10 years of transformation
Cost savings • Currently reviewing holding structures with the ambition to generate long-term annual savings in
the mid-double-digit million range
35 12/12/2019 © METRO AG.TO SUM IT UP
Portfolio simplification leading • METRO China sold to Wumei; sale of hypermarket business well advanced
to a pure wholesale profile • Announcement of efficiency measures to right size structures
Horeca and Trader focus lead to • Highest LfL-growth in a decade1; Horeca +4.5%2, Trader +5.1%3
LFL growth with rising momentum • Extension of business model to ‘360-approach’ to address all customer needs
All financial targets have been • Sales and EBITDA growth in upper end of guidance range
achieved or outperformed • €1.44 EPS; €0.70 DPS proposed to shareholders
• Operational trends continue4: 1.5-3% sales growth, EBITDA stable
Next financial year 2019/20 will
continue in similar fashion • Expected >€1.5 bn net proceeds5 one-time gain from China and real and roughly
~€3 EPS from China
We gear up to further accelerate • Investing proceeds in line with capital allocation framework to grow momentum
growth and earnings momentum • Compensate EBITDA dilution with cost savings, organic growth and acquisitions
METRO made considerable progress in transforming into a focused Wholesale company
The sale of METRO China and real will provide the funds to accelerate the growth and earnings momentum
1 Wholesale like-for-like growth. 2 Guidance view (continuing operations incl. China)
3 Trader countries: Bulgaria, Czech Republic, India, Pakistan, Poland, Romania, Serbia, Slovakia (excl. Russia) 4 At constant FX and before portfolio measures and transformation costs. 5 as per Sep 19 accounts.
36 12/12/2019 © METRO AG.EVENTS AND FINANCIAL CALENDAR
Upcoming Financial Conferences
events calendar 2019/20
2019/20
15 Jan 2020 Trading statement Q1 15 Jan 2020 German Investment
17 Dec 2019 Roadshow Frankfurt
(CFO) – Commerzbank 13 Feb 2020 Quarterly statement Q1 seminar –
New York, Commerzbank
14 Feb 2020 AGM
22 Jan 2020 German Corporate
7 May 2020 Quarterly report H1
conference – Frankfurt,
7 Aug 2020 Quarterly statement Q3 UniCredit/Kepler
Cheuvreux
37 12/12/2019 © METRO AG.Q&A
Olaf Koch, CEO Christian Baier, CFO
38 12/12/2019 © METRO AG.05 APPENDIX 39 12/12/2019 © METRO AG.
APPENDIX OVERVIEW

                                Guidance   view and continuing operations for:
                                     •      Sales to EBITDA
                                     •      EBITDA to EPS
     Quarterly performance
                                     •      FCF
                                     •      METRO Asia and “others”
                                     •      Sales by quarter (group currency, local currency and Like-for-like)

                                Key financials from reconciliation file
                                     •    Reginal view
                                Continuing operations
         Full year 2018/19
                                     •    Profit and loss statement
                                     •    Balance Sheet
                                     •    Cash Flow

                                Guidance view and continuing operations for:
                                     •    Operational metric – Sales share, FSD and Own Brand shares
                                Continuing operations
                   Others            •    Key statistics - Sales, stores, selling space and employees numbers
                                     •    Capex and capex allocation
                                     •    Real estate
                                     •    External financing

40   12/12/2019   © METRO AG.
01 QUARTERLY
PERFORMANCE
41 12/12/2019 © METRO AG.Guidance view (Pre IFRS 5 China) Continuing operations only SALES AND EBITDA IN Q4 €m / % Q4 2017/18 Q4 2018/19 €m / % Q4 2017/18 Q4 2018/19 Like-for-like growth 1.7% 2.5% Like-for-like growth 1.3% 2.1% thereof Food 2.2% 3.4% thereof Food 1.8% 3.0% Reported growth -1.7% 3.9% Reported growth -2.3% 3.3% Growth in local currency 1.5% 2.7% Growth in local currency 1.1% 2.2% Delivery Sales Share 18% 19% Delivery Sales Share 17% 18% EBITDA excl. RE gains 322 304 EBITDA excl. RE gains 278 261 thereof FX 6 thereof FX 5 EBITDA margin excl. RE gains 4.4% 4.0% EBITDA margin excl. RE gains 4.2% 3.8% Real estate gains 121 323 Real estate gains 121 273 Total EBITDA 443 627 Total EBITDA 399 533 42 12/12/2019 © METRO AG.
Guidance view (Pre IFRS 5 China)                                          Continuing operations only

EBITDA TO EPS IN Q4

 €m / %                                         Q4 2017/18   Q4 2018/19   €m / %                                 Q4 2017/18      Q4 2018/19
EBITDA                                                443       627       EBITDA                                       399          533
D&A                                                  -141       -155      D&A                                          -131         -144
EBIT                                                  302       472       EBIT                                         269          389
     Interest and investment result                   -38       -27        Interest and investment result              -40          -29
     Other financial result                             0        4         Other financial result                        1           4
Net financial result                                  -38       -23       Net financial result                          -38         -24
EBT                                                   264       449       EBT                                          230          365
Tax rate                                              23%       40%       Tax rate                                     23%          43%
Net income                                            199       266       Net income                                   176          206
EPS in €                                             0.55       0.73      EPS in €                                     0.48         0.57

43    12/12/2019   © METRO AG.
Guidance view (Pre IFRS 5 China) Continuing operations only
FCF IN Q4
€m / % Q4 2017/18 Q4 2018/19 €m / % Q4 2017/18 Q4 2018/19
EBITDA 443 627 EBITDA 399 533
Change in NWC 546 469 Change in NWC NA NA
Capex1 -208 -182 Capex1 190 168
FCF 780 914 FCF NA NA
1 Capex excl. M&A and finance leases
44 12/12/2019 © METRO AG.Continuing operations only
SALES TO EBITDA
(1/4)
METRO Germany METRO Western Europe
€m / % Q4 2017/18 Q4 2018/19 €m / % Q4 2017/18 Q4 2018/19
Sales 1,154 1,154 Sales 2,659 2,714
Like-for-like growth -0.3% 0.6% Like-for-like growth -0.7% 2.2%
Reported growth -0.9% 0.0% Reported growth -0.1% 2.0%
EBITDA excl. RE gains 16 18 EBITDA excl. RE gains 156 150
EBITDA margin 1.4% 1.6% EBITDA margin 5.9% 5.5%
Real estate gains 0 0 Real estate gains 38 0
Total EBITDA 16 18 Total EBITDA 194 150
45 12/12/2019 © METRO AG.Continuing operations only
SALES TO EBITDA
(2/4)
METRO Russia METRO Eastern Europe
€m / % Q4 2017/18 Q4 2018/19 €m / % Q4 2017/18 Q4 2018/19
Sales 604 618 Sales 1,809 1,935
Like-for-like growth -6.6% -6.3% Like-for-like growth 6.5% 5.2%
Reported growth -16.1% 2.2% Reported growth -1.9% 7.0%
EBITDA excl. RE gains 52 55 EBITDA excl. RE gains 107 102
thereof FX 5 thereof FX 1
EBITDA margin 8.6% 8.9% EBITDA margin 5.9% 5.3%
Real estate gains 0 0 Real estate gains 11 179
Total EBITDA 52 55 Total EBITDA 118 281
46 12/12/2019 © METRO AG.Guidance view (Pre IFRS 5 China) Continuing operations only
SALES TO EBITDA
(3/4)
METRO Asia METRO Asia
€m / % Q4 2017/18 Q4 2018/19 €m / % Q4 2017/18 Q4 2018/19
Sales 1,089 1,179 Sales 399 426
Like-for-like growth 7.3% 5.7% Like-for-like growth 10.3% 4.9%
Reported growth 5.2% 8.2% Reported growth 5.6% 7.0%
EBITDA excl. RE gains 41 50 EBITDA excl. RE gains -2 0
thereof FX 0 thereof FX -1
EBITDA margin 3.8% 4.3% EBITDA margin -0.5% 0.1%
Real estate gains 5 127 Real estate gains 5 77
Total EBITDA 47 177 Total EBITDA 3 77
47 12/12/2019 © METRO AG.Guidance view (Pre IFRS 5 China) Continuing operations only
SALES TO EBITDA
(4/4)
Others Others
€m Q4 2017/18 Q4 2018/19 €m Q4 2017/18 Q4 2018/19
Sales 9 9 Sales 9 9
EBITDA excl. RE gains -49 -71 EBITDA excl. RE gains -49 -65
thereof FX thereof FX 0
Real estate gains 66 17 Real estate gains 66 17
Total EBITDA 17 -54 Total EBITDA 17 -48
48 12/12/2019 © METRO AG.SALES BY QUARTER 2018/19 Change (EUR) Change (local currency) Like-for-like % Q1 Q2 Q3 Q4 Q1 Q2 Q3 Q4 Q1 Q2 Q3 Q4 METRO -1.0% -0.4% 2.4% 3.3% 1.9% 1.3% 3.2% 2.2% 2.1% 1.0% 3.1% 2.1% METRO Wholesale Germany -1.3% -4.1% 3.0% 0.0% -1.3% -4.1% 3.0% 0.0% -0.2% -3.1% 3.6% 0.6% METRO Wholesale Western Europe 1.2% -0.3% 2.2% 2.0% 1.2% -0.3% 2.2% 2.0% 1.0% -0.3% 2.2% 2.2% METRO Wholesale Russia -11.9% -8.3% -0.8% 2.2% -2.8% -2.3% -3.2% -5.2% -2.4% -4.0% -4.8% -6.3% METRO Wholesale Eastern Europe 0.8% 2.4% 3.4% 7.0% 6.3% 6.8% 7.3% 5.4% 6.4% 6.8% 7.1% 5.2% METRO Wholesale Asia 3.0% 6.7% 4.5% 7.0% 9.8% 7.6% 5.4% 6.4% 7.4% 5.1% 3.8% 4.9% METRO Guidance view (Pre IFRS 5 China) METRO -0.6% 0.2% 2.8% 3.9% 2.1% 1.6% 3.6% 2.7% 2.3% 1.2% 3.4% 2.5% METRO Wholesale Asia 3.3% 5.5% 5.7% 8.2% 6.9% 4.7% 6.8% 7.0% 5.9% 3.6% 5.5% 5.7% 49 12/12/2019 © METRO AG.
02                              FULL YEAR
                                2018/19

50   12/12/2019   © METRO AG.
Guidance view (Pre IFRS 5 China) Continuing operations only KEY FINANCIALS 51 12/12/2019 © METRO AG.
Guidance view (Pre IFRS 5 China)   Continuing operations only

REGIONAL VIEW
                                        Link:
                                        https://www.metroag.de/en/newsroom/publications?q=mcf_investors

                                        #Financial Statement

52   12/12/2019   © METRO AG.
Continuing operations only
PROFIT AND LOSS STATEMENT
P&L CONTINUING OPERATIONS
€ million (unless noted otherwise) continuing operations
17/18 18/19
continuing continuing
operations operations
Sales revenues 26,792 27,082
Cost of sales -22,278 -22,476
Gross profit on sales 4,514 4,606
Other operating income 1,271 1,405
Selling expenses -4,021 -4,092
General administrative expenses -773 -822
Other operating expenses -293 -279
Earnings from impairment of financial assets 0 -14
Earnings share of operating companies recognised at equity 14 24
EBIT 713 828
Earnings share of non-operating companies recognised at equity 0 0
Other investment result 0 -1
Interest income 27 29
Interest expenses -163 -148
Other financial result -2 1
Net financial result -137 -119
EBT 576 709
Income taxes -216 -298
tax rate (in %) 37.5% 42.0%
Profit or loss for the period from continuing operations 359 411
Profit or loss for the period from discontinued operations after taxes
Profit or loss for the period
Profit or loss for the period attributable to NCI
from continuing operations 3 6
from discontinued operations
Profit or loss for the period attributable to shareholders of METRO
from continuing operations 357 405
from discontinued operations
EPS (in €)
from continuing operations (in €) 0.98 1.12
from discontinued operations (in €)
EBITDA excl. Real Estate gains 1,088 1,021
Real Estate gains 128 338
EBITDA 1,216 1,359
D&A -503 -531
EBIT 713 828
53 12/12/2019 © METRO AG.Continuing operations only
BALANCE SHEET1
Assets Equity and Liabilities
€ million FY 17/18 FY 18/19 FY 17/18 FY 18/19
Non-current assets 7,503 6,736 Equity 3,074 2,735
Goodwill 797 785 METRO AG Shareholder interest 3,033 2,703
Other intangible assets 499 562 Non-controlling interests 41 32
Tangible assets 5,314 4,760
Investment properties 97 82 Non-current liabilities 3,427 3,419
Financial assets 88 97 Provisions for post employment benefits plans and similar obligations 468 543
Investments accounted for using the equity method 178 179 Other provisions 126 132
Other financial assets 39 37 Borrowings 2,590 2,498
Other non-financial assets 163 43 Other financial liabilities 56 56
Deferred tax assets 329 191 Other non-financial liabilities 67 71
Deferred tax liabilities 120 119
Current assets 7,703 7,761
Inventories 2,108 1,946 Current liabilities 8,705 8,343
Trade receivables 571 482 Trade liabilities 3,993 3,572
Financial assets 1 4 Provisions 274 168
Other financial assets 561 603 Borrowings 1,420 871
Other non-financial assets 353 279 Other financial liabilities 744 728
Entitlements to income tax refunds 206 190 Other non-financial liabilities 392 233
Cash and cash equivalents 1,298 500 Income tax liabilities 191 169
Assets held for sale 2,605 3,758 Liabilities related to assets held for sale 1,691 2,601
Total 15,206 14,497 15,206 14,497
1 Continuing operations, 2017/18 including METRO China and 2018/19 excluding METRO China
54 12/12/2019 © METRO AG.Continuing operations only
CASH FLOW STATEMENT
€ million FY 17/18 FY 18/19
EBIT 713 828
Cash flow
Depreciation/amortisation/impairment losses/reversal of impairment losses of assets excl.
financial investments 503 532 • The operating cash flow came in at
Change in provisions for post-employment benefits plans and other provisions -202 -47 €0.8 bn, above last year. Mainly driven by
Change in net working capital 141 27
higher real estate gains, positive
Income taxes paid -193 -215
Reclassification of gains (-) / losses (+) from the disposal of fixed assets -137 -356
contribution from net working capital
Other -59 28 • The investing cash flow came down from
Cash flow from operating activities of continuing operations 766 796
-€0.3 bn to 0.05bn EUR driven by higher
Cash flow from operating activities of discontinuing operations 139 157
Cash flow from operating activities 905 953
real estate gains
Acquisition of subsidiaries 0 -1 • The financing cash flow changed from
Investments in property, plant and equipment and in investment property (excl. finance leases)
-408 -258 -€0.6 bn to -€1.1 bn due to higher
Other investments -165 -198 repayment of debt
Investments in monetary assets -1 -9
Disposals of subsidiaries -3 0
Disposal of fixed assets 285 505
Disposal of financial assets 0 7
Cash flow from investing activities of continuing operations -292 46
Cash flow from investing activities of discontinuing operations -89 -136
Cash flow from investing activities -381 -90
Dividends paid -254 -254
Redemption of liabilities from put options of non-controlling interests 0 -2
Proceeds from new borrowings 2,772 6,122
Redemption of borrowings -2,983 -6,844
Interest paid -141 -161
Interest received 20 28
Profit and loss transfers and other financing activities 8 -4
Cash flow from financing activities of continuing operations -587 -1122
Cash flow from financing activities of discontinuing operations -74 -109
Cash flow from financing activities -661 -1231
Total cash flows -137 -368
55 12/12/2019 © METRO AG.FINANCIAL REPORTING AFFECTED BY ACCOUNTING
CHANGES & TRANSACTIONS
• METRO China reported as discontinued operations from 30 Sep 19 onwards
• Impacts all financial statements as well as the segments ‘Asia’ and ‘Others’
• Adjustment of PY balance sheet is visible only in the combined management report
• Stop of regular depreciation for China from 1 Oct 2019 onwards
IFRS 5 • Hypermarket business continues to be reported as discontinued operations
(discontinued operations)
• IFRS 5 impacts METRO Wholesale Asia, Segments Others and Consolidation
• Other regions are not affected
• Please refer to our homepage and appendix for additional details
• IFRS 15 replaces IAS 18 and IAS 11
IFRS 15
• Applied since 1 Oct 2018; no adjustment to previous year‘s figures
(revenue from contracts
with customers) • Application affected some reclassifications in balance sheet and triggered a €33 m sales
reduction (mainly Germany, LFL view has been adjusted)
56 12/12/2019 © METRO AG.03 OTHERS 57 12/12/2019 © METRO AG.
Guidance view (Pre IFRS 5 China)                                       Continuing operations only

OPERATIONAL METRICS

                                                                  METRO Guidance (Pre IFRS 5 China) Continuing operations
                                                                          2017/18        2018/19      2017/18         2018/19
     Food Share in Total sales                                               88%            89%           88%            89%
     Non food share in Total sales                                           12%            11%           12%            11%

     FSD (excl. TAC/PU) in Total sales                                        17%           18%           16%               17%
                                            1
     Own Brand Share in Like-for-like sales                                   17%           17%           17%               17%

1   Share in like-for-like sales, excluding acquisitions

58    12/12/2019   © METRO AG.
Continuing operations only
METRO WHOLESALE – KEY STATISTICS
Sales Stores 2017/18 2018/19
€m FY 2017/18 FY 2018/19 FY 2017/18 FY 2018/19 Stores 675 678
Germany 4,761 4,735 103 103 Selling space ('000 sqm) 4,665 4,728
Austria 768 760 12 12 Ø store size (sqm) 6,806 6,973
Belgium 734 737 17 17 Ø Sales / sqm (EUR) 5,629 5,729
France 4982 5114 98 98 Employees (FTE) 104,912 101,654
Italy 1741 1722 49 49
Netherlands 777 767 17 17
Portugal 379 398 10 10
Spain 1229 1253 37 37
Western Europe (w/o Germany) 10,609 10,752 240 240
Russia 2,815 2,662 93 94
Bulgaria 379 395 11 11
Croatia 221 226 9 10
Czech Republic 1,073 1,062 13 13
Hungary 470 471 13 13
Kazachstan 73 80 6 6
Moldova 91 102 3 3
Poland 1,406 1,385 29 29
Romania 1,083 1,190 30 30
Serbia 205 195 9 9
Slovakia 427 432 6 6
Turkey 1,000 1,027 33 34
Ukraine 523 627 31 31
Eastern Europe (w/o Russia) 6,952 7,191 193 195
India 776 848 27 27
Japan 265 287 10 10
Pakistan 339 310 9 9
Myanmar 0 2
Classic Fine Food 232 250 0
Asia (incl. CFF) 1,612 1,696 46 46
Others 43 46 0
METRO 26,792 27,082 675 678
59 12/12/2019 © METRO AG.Guidance view (Pre IFRS 5 China) CAPEX AND CAPEX ALLOCATION €m FY 2017/18 FY 2018/19 Expansion 88 20 Remodelling 60 25 FSD 38 31 Maintenance 157 159 Digital/IT 178 204 Others 31 18 Capex (FCF definition) 552 455 M&A 0 1 Financial Lease 47 69 Investments 600 525 60 12/12/2019 © METRO AG.
Continuing operations only

REAL ESTATE1

                                                                                                              1                                                      1
2018/19                                                                                    Total                                          Owned
('000 sqm)                                                                             Stores     Space ('000 sqm)                      Stores         Space ('000 sqm)
METRO                                                                                     678                  4.728                      355                      2.739
  METRO Wholesale               Germany                                                   103                    915                       10                         88
  METRO Wholesale               Western Europe                                            240                  1.531                       84                        745
                                       2
  METRO Wholesale               Russia                                                     94                    688                       90                        665
  METRO Wholesale               Eastern Europe                                            195                  1.391                      153                      1.164
  METRO Wholesale               Asia                                                       46                    202                       18                         77

1 2018/19 figures on space in stores refers to selling space operated by METRO Wholesale i.e. excluding selling space operated by third parties   2   For METRO Russia, shop-in-shop has been
included into the stores space

61   12/12/2019   © METRO AG.
Continuing operations only
FACT SHEET ON EXTERNAL FINANCING
Interest expense Maturity Profile
1
Net debt at business year end External Funding Mix
1
1 Continuing operations, 2017/18 including METRO China and 2018/19 excluding METRO China
62 12/12/2019 © METRO AG.CONTACT
Investor Relations
METRO AG
Metro-Straße 1
40235 Düsseldorf
Germany
T +49 211 6886-1280
F +49 211 6886-73-3759
E investorrelations@metro.de
www.metroag.de
63 12/12/2019 © METRO AG.64 12/12/2019 © METRO AG.
You can also read