2016 China Cross-Border E-Commerce (Export B2B) Report - DHgate.com
←
→
Page content transcription
If your browser does not render page correctly, please read the page content below

2016 China Cross-Border E-Commerce
(Export B2B) Report

   DHGATE.COM | TSINGHUA UNIVERSITY, NATIONAL ENGINEERING LABORATORY FOR E-COMMERCE TECHNOLOGIES
  | CENTRAL UNIVERSITY OF FINANCE AND ECONOMICS, CHINA CENTER FOR INTERNET ECONOMIC RESEARCH1

Table of Contents

                                                     Table of Contents

Preface .............................................................................................................................. 1
1. Cross-Border E-Commerce Development Index for Provincial Level Administrative
Regions in China ................................................................................................................. 3
2. Cross-Border E-Commerce Index for Provincial Level Administrative Regions in China .. 5
   (i) Market Size Index ................................................................................................................... 5
   (ii) Growth Index ......................................................................................................................... 7
   (iii) Penetration Index .................................................................................................................. 9
   (iv) Influential Factor Index ....................................................................................................... 11
3. China’s Cross-Border E-Commerce Development & Distribution Analysis .................... 13
   (a) Regional Development Distribution Analysis ...................................................................... 13
      1. Eastern Region ................................................................................................................. 13
      2. Central Region ................................................................................................................. 14
      3. Western Region ................................................................................................................ 14
   (b) Trade Partners Analysis .................................................................................................... 15
      1、 Major Trade Partners ...................................................................................................... 15
      2、 Analysis of Major Trade Partners ..................................................................................... 16
   (c) Analysis of Product Categories ........................................................................................... 20
      1. Cross-Border E-Commerce (Export B2B)Major Products & Growth .................................. 20
      2. Cross-Border E-Commerce (Export B2B) Major Product Categories Ranking .......................... 21
   (d) “The Belt and Road” Continues to Strive ........................................................................... 22
      1. “The Belt and Road” Major Trade Partners Analysis ............................................................. 23
      2. “The Belt and Road” Related Trade Analysis of Provinces..................................................... 23
      3. “The Belt and Road” Traded Product Categories Analysis ..................................................... 24
4. China’s Cross-Border E-Commerce Development Trends & Prospects .......................... 26
   (i) The Growing Prowess of “Chinese Brands” ............................................................................ 26
   (ii) B2B Model, The Fundamental Pillar of E-Commerce ............................................................ 27
Conclusion ........................................................................................................................ 28
Appendix: Calculation Methodology .................................................................................. 31

         DHGATE.COM | TSINGHUA UNIVERSITY, NATIONAL ENGINEERING LABORATORY FOR E-COMMERCE TECHNOLOGIES
       | CENTRAL UNIVERSITY OF FINANCE AND ECONOMICS, CHINA CENTER FOR INTERNET ECONOMIC RESEARCH 2
Preface

                                           Preface
     In recent years, China’s cross-border digital trade has achieved remarkable progress and
significant growth. In 2015, cross-border e-commerce turnover surged to 5.4 trillion yuan, which is
a year-on-year increase of 28.6%. Of the total transaction turnover, cross-border export e-commerce
trade reached 4.49 trillion yuan, accounting for 83.2% of the total figure; while cross-border import
e-commerce trade amounted to 907.2 billion yuan, accounting for 16.8%. China’s cross-border e-
commerce turnover is projected to surpass 10 trillion yuan at the end of 2018, corresponding with
the projected average growth rate of approximately 23% in the coming three years. On the macro-
level, B2B cross-border e-commerce transactions accounted for 88.5% of total turnover, dwarfing
the turnover generated by B2C cross-border e-commerce transactions, which contributed only 11.5%.
B2B e-commerce continues to be the mainstay of cross-border digital trade.

     B2B exports in China’s cross-border e-commerce sector have been growing rapidly and
consistently at a rate of 50% and above, outpacing the growth rate of exports on the whole (Source:
Customs Statistics), and consequently it plays a significant role in China’s import and export trade.
Meanwhile, there has been an increase in B2B cross-border e-commerce as a proportion of total
export turnover, with 1.3‰ growth in 2013, and 3.5‰ growth in 2015. Therefore, to analyze the size,
rate of growth, structure, and future developments of Chinese cross-border e-commerce through the
perspective of its B2B exports, would be both a symbolic and practical approach.

                                                         2013       2014           2015
                         Cross-border E-Commerce          58.9%       53.7%          59.1%
                              (Export B2B) growth
                 China’s Annual EXPORT GROWTH              7.9%        6.6%          -0.3%
                         Cross-Border E-commerce,          1.3‰        2.7‰          3.5‰
                                 % of Total export

     The 2014-2015 Cross-Border E-commerce Development Index takes into account the
performance of 33 Chinese provincial level administrative regions in cross-border e-commerce in
2014-2015, by examining their respective size, growth, penetration and market support mechanisms.
Apart from highlighting the scale of the cross-border e-commerce market, this index also places an
emphasis on the weightage of each province’s performance on China’s overall cross-border e-
commerce trade, as well as in comparison with the province’s international trade. This index was
created based on actual statistics from Chinese cross-border e-commerce platforms, and calculated

DHGATE.COM   |    TSINGHUA, NELECT |    CUFE, CCIER                                                1
Preface
using a scientific approach, resulting in an objective and authentic reflection of the current situation
and future developments.

     The 2015 Index shows that e-commerce hub provinces Guangdong, Zhejiang and Fujian are the
top 3 performing players in cross-border e-commerce, while Xinjiang, Jilin, Hainan and several other
provinces have undergone remarkable growth. Lastly, Ningxia, Inner-Mongolia, Liaoning and a few
other provinces still have great room for improvement.

DHGATE.COM   |   TSINGHUA, NELECT |      CUFE, CCIER                                                  2
1. Cross-Border E-Commerce Development Index for Provincial
             Level Administrative Regions in China

    In 2015, the Chinese cross-border e-commerce market has continued to grow, albeit at a more
gradual rate, cross-border e-commerce has exerted a large impact (penetration) on each province’s
economic development, resulting in the continual improvement of market support mechanisms
provided by each province for the general e-commerce market landscape. The performance measures
and rank of all provinces’ B2B cross-border e-commerce trade is presented in the following table.

     Table 1: China Provincial Level Administrative Regions Cross-Border E-commerce Index 2015
                              Market     Growth    Penetration   Influential   Cross-Border    Change
 Rank   Province           Size Index     Index         Index        Factor           Index   in Rank
                                                                      Index
    1   Guangdong             100.00       13.31         88.71        73.70           77.77             -
    2   Zhejiang               52.53       11.50         85.19        54.35           51.04             -
    3   Fujian                 22.78       19.87         99.94        25.19           37.87         ↑ 1
    4   Shanghai               25.05        8.42         54.98        54.78           30.69         ↓ 1
    5   Beijing                  9.90      12.46         79.82        64.05           29.81             -
    6   Jiangsu                25.00       15.58         30.81        37.47           25.52         ↑ 1
    7   Henan                    5.36      20.86         74.02         8.06           22.47         ↑ 3
    8   Xinjiang                 0.06     100.00          0.90         7.23           20.93         ↑24
    9   Hunan                    2.27      23.99         69.67         7.01           20.57         ↑ 7
   10   Hebei                    2.53      33.55         38.24        13.97           17.02         ↑ 7
   11   Jiangxi                  2.63      28.00         43.91         7.52           16.45         ↑13
   12   Hubei                    2.20      23.38         42.37        14.64           15.71         ↑ 2
   13   Shandong                 6.71      14.37         37.89        18.15           15.62             -
   14   Anhui                    2.44      17.36         44.68         8.94           14.52         ↓ 3
   15   Sichuan                  1.27      41.97         14.05        16.75           13.51         ↑ 5
   16   Guangxi                  0.89      37.37         15.11         5.24           11.46         ↑12
   17   Tibet                    0.03      49.42          2.74         6.78           11.13         ↑ 6
   18   Jilin                    0.30      22.17         18.32        10.53            9.30         ↓ 6
   19   Hainan                   0.07      33.78          5.27        10.34            8.88         ↑14
   20   Shaanxi                  0.42      13.30         16.50        13.89            7.56         ↓11
   21   Shanxi                   0.12      23.23          6.85         9.59            7.04         ↑ 4
   22   Yunnan                   0.28      28.19          4.15         3.92            7.00         ↓ 7
   23   Chongqing                0.49      23.74          5.39         8.18            6.89         ↓ 4
   24   Taiwan                   0.00      23.46          2.16        16.53            6.78         ↑ 2
   25   Heilongjiang             0.25      20.29          8.00         9.38            6.72         ↓ 4
   26   Tianjin                  0.14      22.88          1.09        14.93            6.36         ↑ 3
   27   Qinghai                  0.06       1.48         26.18         6.72            6.24         ↓21
   28   Gansu                    0.14      16.47          8.96         4.03            5.56         ↑ 2
   29   Guizhou                  0.20      12.32         11.18         3.09            5.11         ↓ 2

DHGATE.COM      |   TSINGHUA, NELECT |   CUFE, CCIER                                                3
30   Liaoning               0.25      17.33            1.00       11.94              4.99       ↓ 8
   31   Inner Mongolia         0.18        1.74         13.87         9.26              4.14       ↓23
   32   Hong Kong              0.72        5.53           2.16       16.53              3.55       ↓14
   33   Ningxia                0.00        1.48           0.00        5.74              0.87       ↓ 2

     The 2015 China Provincial Level Administrative Regions Cross-Border E-commerce Index
indicates that the top 5 provinces for cross-border e-commerce trade activities are Guangdong,
Zhejiang, Fujian, Shanghai and Beijing. Of these five provinces, some were involved in e-commerce
development pilot programs, or they possess an advantageous geographical location. This is the
second consecutive year that Guangdong has been at the top of the table. This is primarily due to
Guangdong’s strategic location along the coast, its massive market size and rapid pace in
development; at the same time, Guangdong has an outstanding e-commerce market landscape and
support environment, it is equipped with an all-rounded set of infrastructure necessary in cultivating
a conducive environment for cross-border e-commerce trade activities – easily allowing it to maintain
its position as a forerunner nationally. Lastly, it must be noted that Guangdong province’s focus and
fostering of the “Internet+” strategy, which aims to improve the industry continually, have reaped
substantial benefits. Looking at the change in rankings, various provinces have performed
exceptionally and risen through the ranks: Xinjiang (up 24 spots), Hainan (up 14 spots), Jiangxi (up
13 spots), Guangxi (up 12 spots). Compared with the overall development of B2B cross-border e-
commerce nationally, the value of export B2B cross-border e-commerce in 8 provinces surpassed the
national average index value in 2014 – trade in Guangdong, Shanghai, Zhejiang, Fujian, Beijing,
Qinghai, Jiangsu, Inner Mongolia amounted to 24.2% of the total figure; in 2015, the number of
provinces surpassing the national average index value increased to 11, amounting to 33.3% of the
total figure, this can be attributed to success for the latecomers to the market. Nevertheless, 50% of
the provinces are still below the average index value in 2014—2015, indicating that there is much
room for improvements in these provinces.

DHGATE.COM   |     TSINGHUA, NELECT |   CUFE, CCIER                                                 4
2. Cross-Border E-Commerce Index for Provincial Level
           Administrative Regions in China, By Categories

(i) Market Size Index
     The market size index reflects the cross-border e-commerce market size in the respective
provinces. They are primarily calculated based on each province’s total number of export B2B
transactions and their respective Gross Merchandise Volume (GMV). The evaluation results with
regards to the market size index are presented in Table 2 below.

             Table 2: China Provincial Level Administrative Regions Cross-Border E-Commerce
                                    Market Size Index & Ranking 2015
       Rank              Province      Market Size Index 2014   Market Size Index 2014   Change In Rank
             1       Guangdong                         100.00                   100.00         -
             2       Zhejiang                           55.72                    52.53         -
             3       Fujian                             30.04                    25.05         -
             4       Shanghai                           22.27                    25.00         -
             5       Beijing                            18.19                    22.78         -
             6       Jiangsu                            10.19                     9.90         -
             7       Henan                               6.32                     6.71         -
             8       Xinjiang                            4.25                     5.36         -
             9       Hunan                               2.17                     2.63        ↑ 1
          10         Hebei                               1.71                     2.53        ↑ 1
          11         Jiangxi                             1.61                     2.44        ↓ 2
          12         Hubei                               1.58                     2.27        ↓ 1
          13         Shandong                            1.46                     2.20        ↓ 1
          14         Anhui                               0.96                     1.27        ↑ 1
          15         Sichuan                             0.63                     0.89        ↑ 2
          16         Guangxi                             0.59                     0.72        ↓ 2
          17         Tibet                               0.45                     0.49        ↑ 2
          18         Jilin                               0.40                     0.42         -
          19         Hainan                              0.35                     0.30        ↑ 2
          20         Shaanxi                             0.25                     0.28        ↑ 5
          21         Shanxi                              0.23                     0.25        ↑ 1
          22         Yunnan                              0.21                     0.25        ↑ 1
          23         Chongqing                           0.20                     0.20        ↑ 1
          24         Taiwan Province                     0.20                     0.18        ↑ 1
          25         Heilongjiang                        0.17                     0.14        ↑ 3
          26         Tianjin                             0.12                     0.14         -
          27         Qinghai                             0.10                     0.12        ↑ 1
          28         Gansu                               0.08                     0.07        ↑ 1
          29         Guizhou                             0.03                     0.06        ↓ 9

DHGATE.COM       |     TSINGHUA, NELECT |       CUFE, CCIER                                               5
30       Liaoning                       0.01                   0.06        ↑ 1
         31       Inner Mongolia                 0.01                   0.03        ↑ 1
         32       Hong Kong                      0.00                   0.00        ↑ 1
         33       Ningxia                        0.00                   0.00        ↓ 1

    Some notable highlights of the market size index:
    1. Guangdong, Zhejiang, Shanghai, Jiangsu, and Fujian provinces took the first five spots in
       the rankings. Of which, Guangdong received a considerably higher index score in
       comparison to other provinces, indicating again the obvious edge it possesses in export B2B
       cross-border e-commerce;
    2. There is no drastic change in the rankings on the market size index of 2014-2015 – there is
       no change in rank for the top 8 spots (Guangdong, Zhejiang, Shanghai, Jiangsu, Fujian,
       Beijing, Shandong, Henan); 90% of the provinces recorded a movement of less than 3 spots
       upwards or downwards. This phenomenon can be attributed to how the development of
       cross-border e-commerce is largely dependent on the region’s own resources and
       dispositions and so drastic changes in market size is unlikely in the short-run;
    3. There is a considerable gap between the market size indexes of different provinces, with less
       than one-fifth of the provinces surpassing the average index value (8.04). Merely by looking
       at the turnover, Guangdong province, which is at the top of the table, has outperformed
       Ningxia, the province with the poorest performance by more than 75000 times. This huge
       discrepancy is driven by the fact that B2B export is largely dependent on the local industry
       scale and regional policies, it is the collective outcome fueled by the market and
       policymaking.

DHGATE.COM    |     TSINGHUA, NELECT |   CUFE, CCIER                                              6
(ii) Growth Index

     The growth index measures and reflects the provinces’ prospects and potential, focusing on and
calculated with the growth rate of the number of export orders and overall turnover. The growth
index evaluation results are presented in Table 3 below.

             Table 3: China Provincial Level Administrative Regions Cross-Border E-Commerce
                                       Growth Index & Ranking 2015
              Rank          Province      Growth Index 2014   Growth Index 2015   Change in Rank
                   1    Xinjiang                     100.03              100.00        ↑27
                   2    Tibet                         66.77               49.42        ↑ 6
                   3    Sichuan                       65.65               41.97        ↑ 8
                   4    Guangxi                       52.33               37.37        ↑17
                   5    Hainan                        52.06               33.78        ↑28
                   6    Hebei                         51.52               33.55        ↑10
                   7    Yunnan                        50.79               28.19        ↓ 4
                   8    Jiangxi                       44.60               28.00        ↑24
                   9    Hunan                         43.93               23.99        ↑22
                   10   Chongqing                     43.16               23.74        ↓ 4
                   11   Taiwan Province               41.09               23.46        ↑ 4
                   12   Hubei                         37.16               23.38        ↑ 6
                   13   Shanxi                        34.83               23.23        ↑ 1
                   14   Tianjin                       33.53               22.88        ↑ 8
                   15   Jilin                         33.21               22.17        ↓ 8
                   16   Henan                         32.21               20.86        ↑13
                   17   Heilongjiang                  28.14               20.29        ↓ 7
                   18   Fujian                        27.62               19.87        ↑ 1
                   19   Anhui                         25.63               17.36        ↓ 6
                   20   Liaoning                      23.85               17.33        ↓11
                   21   Gansu                         22.27               16.47        ↑ 6
                   22   Jiangsu                       22.23               15.58        ↓ 2
                   23   Shandong                      21.00               14.37        ↑ 7
                   24   Guangdong                     20.42               13.31        ↑ 1
                   25   Shaanxi                       19.56               13.30        ↓23
                   26   Beijing                       18.73               12.46        ↓ 2
                   27   Guizhou                       17.74               12.32        ↓10
                   28   Zhejiang                      15.30               11.50        ↓ 2
                   29   Shanghai                      11.20                8.42        ↓17
                   30   Hong Kong                      9.86                5.53        ↓26
                   31   Inner Mongolia                 8.69                1.74        ↓30
                   32   Ningxia                        8.26                1.48        ↓ 9
                   33   Qinghai                        3.04                1.48        ↓28

DHGATE.COM     |   TSINGHUA, NELECT |        CUFE, CCIER                                           7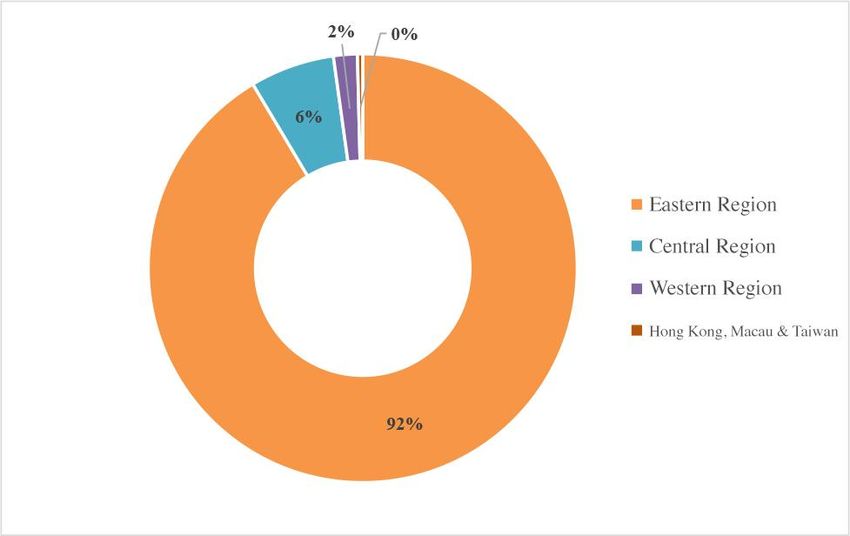
Some notable highlights of the provinces’ growth index:
    1. Xinjiang, Tibet, Sichuan, Guangxi, Hainan took the first five spots in the rankings,
       indicating that these five provinces’ cross-border e-commerce have the best prospects to
       excel;
    2. The provinces that fared better on the growth index are not those with a high market size
       index. This indicates that latecomers have an edge to develop rapidly, allowing their cross-
       border e-commerce sector to progress at an accelerated pace;
    3. The change in rankings on the 2014-2015 growth index are apparent, with more than half of
       the provinces on the table undergoing a change of 10 positions or more. This implies that
       increasing attention is being paid to digital trade as a driver of commerce, resulting in
       respective provinces’ emphasis and efforts in this respect.

DHGATE.COM   |   TSINGHUA, NELECT |   CUFE, CCIER                                                8
(iii) Penetration Index
The penetration index reveals the impact exerted by each province’s cross-border e-commerce
activities, as a weightage on their import and export trade. The assessment results are presented in
Table 4 below.
Table 4: China Provincial Level Administrative Regions Cross-Border E-Commerce
Penetration Index & Ranking 2015
Rank Provinces Penetration Index 2014 Penetration Index 2015 Change in Rank
1 Guangdong 100.00 99.94 ↑ 1
2 Zhejiang 98.78 88.71 ↓ 1
3 Fujian 96.09 85.19 ↑ 1
4 Shanghai 96.00 79.82 ↓ 1
5 Beijing 83.53 74.02 ↑ 2
6 Jiangsu 75.05 69.67 ↑ 2
7 Henan 60.61 54.98 ↓ 1
8 Xinjiang 49.65 44.68 ↑ 1
9 Hunan 38.13 43.91 ↑ 4
10 Hebei 36.87 42.37 ↑ 2
11 Jiangxi 36.34 38.24 ↑ 4
12 Hubei 33.61 37.89 ↓ 2
13 Shandong 30.87 30.81 ↓ 2
14 Anhui 26.50 26.18 ↓ 9
15 Sichuan 23.25 18.32 ↑ 1
16 Guangxi 17.83 16.50 ↑ 1
17 Tibet 16.21 15.11 ↑ 2
18 Jilin 11.25 14.05 ↑ 4
19 Hainan 11.18 13.87 ↓ 5
20 Shaanxi 8.74 11.18 ↓ 2
21 Shanxi 8.17 8.96 ↓ 1
22 Yunnan 7.39 8.00 ↓ 1
23 Chongqing 5.50 6.85 -
24 Taiwan 3.53 5.39 -
25 Heilongjiang 3.43 5.27 -
26 Tianjin 2.77 4.15 -
27 Qinghai 2.24 2.74 -
28 Gansu 1.82 2.16 ↑ 1
29 Guizhou 1.82 2.16 ↓ 1
30 Liaoning 1.35 1.09 ↑ 2
31 Inner Mongolia 0.99 1.00 ↓ 1
32 Hong Kong 0.92 0.90 ↑ 1
33 Ningxia 0.09 0.00 ↓ 1
DHGATE.COM | TSINGHUA, NELECT | CUFE, CCIER 9Some notable highlights of the provinces’ penetration index:
1. Fujian, Guangdong, Zhejiang, Beijing and Henan took the first five spots on the ranking,
signifying that the impact of cross-border e-commerce on their overall trade is the largest.
At the top of the table is Fujian province, its export B2B turnover figure amounts to more
than 50% of its overall export turnover;
2. There are not many changes in ranking on the penetration index, with 80% of the provinces
recording a movement of less than 2 positions, this suggests that cross-border e-commerce
is a gradual process;
3. The provinces that fared poorer on the penetration index are mainly landlocked inland
provinces such as Xinjiang and Ningxia, implying that cross-border e-commerce activities
are affected by geographical location to a certain extent.
DHGATE.COM | TSINGHUA, NELECT | CUFE, CCIER 10(iv) Influential Factor Index
The influential factor index reflects the provinces’ overall market landscape and mechanisms
that support the development of digital trade, thought measures such as infrastructure, logistics
framework, and human resources. The assessment results are presented in Table 5 below.
Table 5: China Provincial Level Administrative Regions Cross-Border E-Commerce
Influential Factor Index & Ranking 2015
Rank Province Influential Factor Influential Factor Change in Rank
Index 2014 Index 2015
1 Guangdong 73.70 72.82 -
2 Beijing 64.05 66.49 ↑ 1
3 Shanghai 54.78 47.10 ↓ 1
4 Zhejiang 54.35 51.75 -
5 Jiangsu 37.47 35.02 -
6 Fujian 25.19 24.17 -
7 Shandong 18.15 19.31 ↑ 1
8 Sichuan 16.75 12.87 ↓ 1
9 Taiwan 16.53 15.57 ↑ 1
10 Hong Kong 16.53 15.57 ↓ 1
11 Tianjin 14.93 14.15 ↑ 2
12 Hubei 14.64 12.39 -
13 Hebei 13.97 13.23 ↑ 1
14 Shaanxi 13.89 10.93 ↓ 3
15 Liaoning 11.94 11.36 ↑ 3
16 Jilin 10.53 15.43 ↑ 1
17 Hainan 10.34 8.53 ↑ 6
18 Shanxi 9.59 9.28 ↑ 4
19 Heilongjiang 9.38 8.74 ↓ 4
20 Inner Mongolia 9.26 8.42 ↓ 4
21 Anhui 8.94 7.57 ↓ 1
22 Chongqing 8.18 8.00 ↓ 1
23 Henan 8.06 6.71 ↓ 2
24 Jiangxi 7.52 5.57 ↑ 2
25 Xinjiang 7.23 6.71 ↓ 1
26 Hunan 7.01 7.40 ↑ 2
27 Tibet 6.78 4.87 ↓ 2
28 Qinghai 6.72 6.50 ↑ 2
29 Ningxia 5.74 4.83 -
30 Guangxi 5.24 4.96 ↓ 3
31 Gansu 4.03 3.26 -
32 Yunnan 3.92 3.42 -
33 Guizhou 3.09 2.09 ↑ 1
DHGATE.COM | TSINGHUA, NELECT | CUFE, CCIER 11Some notable highlights of the provinces’ digital trade influential factor index:
The top five provinces Guangdong, Zhejiang, Beijing, Shanghai, and Jiangsu all have a suitable
environment for the development of digital trade. The logistics industry in the above five provinces
have a higher growth rate, and they constitute a larger portion of the national express delivery
business volume, each amounting to 10% and above, far surpassing the national average value of
3.2%; on average, 4.18% of a region’s total workforce is employed in the e-commerce sector, and in
Beijing this figure has reached 8.5%, far outpacing the national average value of 1.95%; they are also
the forerunners in the country with the highest number of registered domain names and internet
penetration rate. On the other hand, for the five weakest performing provinces, results indicate that
there is a clear potential for the improvement of Guizhou, Qinghai, Ningxia, Gansu and Xinjiang’s
development and market landscape. These provinces require more support mechanisms in the forms
of policymaking, financing and funding, for the establishment of infrastructure, logistics network,
and human resource. Finally, there are no significant changes in the ranking for the influential factor
index. Over 70% of the provinces recorded a movement of less than 2 positions, as the influential
factor index mainly evaluates the impact of external factors on digital trade, with an emphasis on the
infrastructure; there are hard constraints in the establishment of infrastructure, hence there are rarely
drastic changes in the short-run.
DHGATE.COM | TSINGHUA, NELECT | CUFE, CCIER 123. China’s Cross-Border E-Commerce
Development & Distribution Analysis
This section is an analysis on the development of China’s e-commerce (export B2B) sector
through three dimensions: regional development, product classifications, and trade partnerships.
(a) Regional Development Distribution Analysis
1. Eastern Region
The Eastern region consists of 11 provincial level administrative areas including Beijing,
Tianjin, Hebei, Liaoning, Shanghai, Jiangsu, Zhejiang, Fujian, Shandong, Guangdong and Hainan.
Due to strategic factors such as economic progress and advantageous geographical locations along
the coast, the cross-border e-commerce (export B2B) players in the Eastern region account for a vast
majority of the market share, constituting over 90% of both numbers of orders and transaction
turnover. In terms of penetration and support for cross-border e-commerce, they are also ahead of
the Central and Western regions by a large margin (Chart 1). However, in terms of growth, the
average growth rate of turnover for Eastern region provinces in the 2015 is 67.18%, markedly lower
than Central and Western region provinces, indicating that the development of cross-border e-
commerce in the Eastern region has gradually plateaued.
Chart 1 China Cross-Border E-Commerce (Export B2B) Regional Distribution: Size
DHGATE.COM | TSINGHUA, NELECT | CUFE, CCIER 132. Central Region
The Central region is made up of 8 provincial level administrative regions in total, comprised
of Shanxi, Jilin, Heilongjiang, Anhui, Jiangxi, Henan, Hubei, and Hunan. In 2015, provinces in the
Central region constitute 6% of the cross-border e-commerce national transactions turnover, with a
growth rate of 78.47%, making it the fastest growing region for cross-border e-commerce in China
(Chart 2). With respect to penetration and support, the Central region is performing moderately
between the Eastern region and Western region, with plenty of room for improvement.
Chart 2: China Cross-Border E-Commerce (Export B2B) Regional Distribution: Growth
3. Western Region
The Western region consists of 11 provincial level administrative areas including Sichuan,
Chongqing, Guizhou, Yunnan, Tibet, Shaanxi, Gansu, Qinghai, Ningxia, Xinjiang, Guangxi and
Inner Mongolia. In 2015, provinces in the Western region constitute 2% of the cross-border e-
commerce national transaction turnover, with a growth rate of 78.15%, underscored by only the
performance of the Central region, showing great potential.
With respect to the penetration of cross-border e-commerce on the local market and economy,
the weightage of cross-border e-commerce on the overall import and export trade in the Western
region is currently at 6.5%, which pales in comparison to the Eastern region (34.4%) and Central
region (13.2%); this indicates that there is great room for improvement regarding the prevalence and
penetration of cross-border e-commerce in the Western region (Chart 3). Therefore, in the strategic
DHGATE.COM | TSINGHUA, NELECT | CUFE, CCIER 14planning to promote trade and the development of the economy, provinces in the Western region can
achieve rapid growth of international trade by fostering their e-commerce sectors.
Chart 3: China’s Cross-Border E-Commerce (Export B2B) Regional Distribution: Penetration Levels
(b) Trade Partners Analysis
1、 Major Trade Partners
The rapid development of China’s cross-border e-commerce sector is evident not just in its
market size and growth rate, it is also evident in its international trade partnerships. In 2014-2015,
China’s cross-border e-commerce partners span 220 countries and regions around the world,
including both developed and developing nations.
Table 6: China Cross-Border E-Commerce (Export B2B), Top 10 Major Trade Partners
RANK TRADE RANK TRADE RANK TRADE RANK TRADE
VOLUME VOLUME GROWTH VOLUME
1 United States 11 Australia 1 Latvia 11 Spain
2 Russia 12 Ukraine 2 Chile 12 Lebanon
3 Brazil 13 Italy 3 Slovakia 13 Peru
4 Spain 14 Turkey 4 Bulgaria 14 Belgium
5 United Kingdom 15 Poland 5 Slovenia 15 Hungary
6 Canada 16 Kazakhstan 6 Lithuania 16 Greece
7 France 17 Netherlands 7 Korea 17 Austria
8 Israel 18 Sweden 8 Kazakhstan 18 Romania
9 Belarus 19 Czech Republic 9 India 19 Portugal
10 Chile 20 Germany 10 Moldova 20 Estonia
DHGATE.COM | TSINGHUA, NELECT | CUFE, CCIER 15Due to the unique traits of export e-commerce and expertise in the B2B sector, China’s leading
major partners in cross-border e-commerce are comprised mainly of developed countries, this
proclivity is related to the massive market size of developed countries, and their matured environment
conducive for e-commerce. In addition, due to the rapid progress of digital trade in developing
countries, they are also viable partners for China’s cross-border e-commerce sector.
2、 Analysis of Major Trade Partners
1) Europe & America
In 2015, China’s cross-border e-commerce (export B2B) had remarkable progress in the
European and North American regions (see Chart 4). Of which, the growth in North America was
the most significant, with the turnover growth rate for the United States and Canada each amounting
to 50% and above. In Europe, e-commerce is also propelling China’s export trade forward by leaps
and bounds, with countries such as Spain (48.7%), Germany (41.5%), France (37.4%), and the
Netherlands (30%) each achieving a turnover growth rate of 30% and above.
Chart 4: China’s Cross-Border E-Commerce (Export B2B),
Major Trade Partners & Growth (Europe & North America) 2015
With respect to the types of goods sold, Europe and America have a varied distribution in terms
of trade volume and growth (Chart 7). In 2015, the top five best-performing categories of popular
Chinese cross-border e-commerce (export B2B) goods in Europe & North America are consumer
electronics, mobile phones (and accessories), sports & outdoor products, health & beauty, as well as
household furniture & gardening products. Looking solely at the rate of growth, the fastest growing
DHGATE.COM | TSINGHUA, NELECT | CUFE, CCIER 16goods in Europe and America are classified under sports & outdoor products, jewelry & accessories,
shoes & bags, household furniture & gardening products, and digital cameras. On the whole, taking
into account both market size and growth, the fastest growing type of goods for Europe and North
America in 2015 is sports & outdoor products. One particular bestselling product this year is the self-
balancing scooter (hover board).
Table 7: China Cross-Border E-Commerce (Export B2B)
Major Trade Product Categories & Growth (Europe & America)
RANK MARKET SIZE RATE OF GROWTH
1 Consumer Electronics Sports & Outdoor Products
2 Mobile Phones & Accessories Jewelry & Accessories
3 Sports & Outdoor Products Shoes & Bags
4 Health & Beauty Household & Gardening
5 Household & Gardening Digital Cameras, Photography Equipment
2) Oceania
Australia and New Zealand are major markets China exports to. With respect to cross-border e-
commerce, the Australian market is relatively more established and matured compared to the New
Zealand market, with a market that is more than twice the size of New Zealand; however, the rapid
rate of growth for the New Zealand market far outpaced that of their Australian counterpart. The
primary goods exported to Australia and New Zealand are mainly consumer electronics products
(computing, communication, and consumer), fashion apparels & bags, and household products;
apparels, jewelry and other fashion related products had a 60% growth in 2015, in comparison with
the previous year. The cross-border e-commerce (export B2B) preferences of the Oceania region is
presented below in Chart 5 and 6.
Chart 5: China’s Cross-Border E-Commerce (Export B2B), Top 5 Trade Product Categories (Oceania) 2015
DHGATE.COM | TSINGHUA, NELECT | CUFE, CCIER 17Chart 6: China Cross-Border E-Commerce (Export B2B)
Major Trade Product Categories (Oceania) 2015
3) ASEAN Region
The ASEAN region is a fundamental component of the “The Belt and Road” policy, indicating
the great prospects of their market. Malaysia is the fastest growing ASEAN country, with a growth
rate that surpasses even countries in Europe and North America.
Chart 7: China’s Cross-Border E-Commerce (Export B2B),
Growth of Trade Partners 2015 (ASEAN Region)
Chart 8: China’s Cross-Border E-Commerce (Export B2B),
Growth of Trade Product Categories 2015 (ASEAN Region)
DHGATE.COM | TSINGHUA, NELECT | CUFE, CCIER 18Looking solely at the data of product categories exported, consumer electronics (computing,
communication, and consumer) products accounted for 28%, followed by fashion apparels, health &
beauty, and so on. 3C products enjoyed a high weightage of sales turnover as well as a high rate of
growth, while sports & outdoor, health & beauty products all recorded growth rates above 50%.
4) Latin America Region
Brazil, Mexico, Argentina, Chile, Columbia, and Peru are the major markets in Latin America.
Although it’s current turnover is relatively small compared to other region, but the prospect for
growth here is a force to be reckoned with. From the 2015 statistics, the growth in sales volume for
these 6 countries, compared to their performance in the previous year is apparent. The sales volume
in Brazil is the highest, accounting for over 25% of the turnover of the Latin America region,
followed by Mexico and Chile. Apart from Brazil, the total sales volume for most countries in the
Latin America region are still relatively low, however, they do have a significantly higher growth
rate in comparison to Brazil (Chart 9).
Chart 9: China’s Cross-Border E-Commerce (Export B2B),
Growth of Trade Partners (Latin America Region)
With respect to the distribution of product categories, the Latin American market has an
interestingly more culturally distinct profile, categories such as hair products (571%), skincare
products (458%), extreme sports (416%), as well as locksmith tools (312%) all experienced a growth
rate of above 300%, while consumer electronics (141%), hair-removal products (139%) and beauty
& cosmetic products (129%) also enjoyed a growth rate above 100% (Chart 10).
DHGATE.COM | TSINGHUA, NELECT | CUFE, CCIER 19Chart 10: China’s Cross-Border E-Commerce (Export B2B),
Growth of Trade Product Categories 2015 (Latin America Region)
(c) Analysis of Product Categories
The variety of goods traded by China in cross-border e-commerce transactions are getting more
diverse each day, the volume traded and growth rate are also continually shifting as the global trade
environment evolves. In 2014-2015, a majority of the products exported by Chinese cross-border e-
commerce players are concentrated in 23 key categories such as electronics & games, digital
camera/photography equipment, jewelry, watches, fashion apparel and so on.
1. Cross-Border E-Commerce (Export B2B)Major Products & Growth
Chart 11 shows the following trends of China’s cross-border e-commerce (export B2B), in the
major trade products growth and ranking, between 2014-2015:
In 3C (computing, communication, and consumer) products, the selfie-stick is certainly the
bestselling product of 2015. In addition, aerial photography devices, VR glasses are also
popular items that had rapid growth, they are still in the early stages of their product
lifecycle and will continue to grow in popularity;
In outdoor sports, one major product that performed remarkably is the self-balancing
scooter (hover board). As each item’s unit cost is relatively higher, it has also driven
outdoor sports to be one of the fastest growing categories. However, as incidents have
prompted the need for improved product safety, manufacturers will have to make
improvements accordingly, to fulfill any policy requirements;
In lighting, there is a trend of increased emphasis on branding, in addition, as overseas
logistics players have lowered the costs of shipping, pricing can be improved as costs are
lowered; products are delivered in a shorter time, enhancing the overall experience for
DHGATE.COM | TSINGHUA, NELECT | CUFE, CCIER 20consumers.
Bridal Gowns:High quality and good pricing are the key trends in preference. They are
also useful benchmarks for Chinese brands to follow. Apart from traditional European and
American style bridal gowns, those with unique cultural attributes are also potential
products to develop. To design creatively, create complex styles, and to develop
customized products will be China’s edge;
Maternity Items & Children Toys: Continue to diversify products based on market
segmentation catering to different age groups, follow the trends in cartoons and animation
closely. Branding and maintaining high-quality products are the major guidelines for
development in this sector;
Fashion, accessories, shoes and bags: May, September and November are the best-
performing peak seasons in the fashion industry; Major products that perform best in May
are: swimsuits, summer dresses, t-shirts, and undergarments; Products that perform best in
September are: costumes (demand due to Halloween), jeans, and jackets; Products that
perform best in November are: jackets, down jackets, pants, and socks. Between March to
September, sales of sunglasses are also notable. And lastly, hats, scarves, and sunglasses
are the best-performing products that fall under the fashion accessories grouping.
Chart 11: China’s Cross-Border E-Commerce (Export B2B),
Growth of Trade Product Categories & Rank 2015
2. Cross-Border E-Commerce (Export B2B) Major Product Categories Ranking
Taking into account the trade volume and rate of growth for the major product categories, we
have calculated a “Major Product Categories Index”, to reflect the weightage and development
DHGATE.COM | TSINGHUA, NELECT | CUFE, CCIER 21potential in China’s cross-border e-commerce export sector (see Chart 8).
In comparison to the index from 2014, there are quite drastic changes to the rankings of the
product categories in 2015. Jewelry and watches, the weakest performers (in 2014) have soared
towards the top of the table (in 2015), while musical instruments, maternity products, bridal gowns
and other categories all displayed a downward trend. These examples illustrate the vigor and degree
of volatility in the export cross-border e-commerce sector, which also implies that this is an
unconventional realm that is filled with opportunities and transformations.
Table 8: Major Product Categories Size & Growth Ranking 2015
Rank Product Category Index Score 2014 Index Score 2015 Change in Rank
1 Jewelry 1.51 1.70 ↑ 17
2 Watch 1.50 1.46 ↑ 17
3 Fashion Apparels 1.68 1.42 ↑ 12
4 Household & Gardening 1.84 1.34 ↑ 7
5 Mobile Phones & Accessories 1.93 1.21 ↑ 4
6 Hair Products 3.36 1.20 ↓ 5
7 Luggage, Bags & Accessories 1.69 1.20 ↑ 7
8 Toys & Gifts 1.74 1.19 ↑ 5
9 Consumer Electronics 1.57 1.18 ↑ 7
10 Computers & Networking 1.30 1.18 ↑ 11
11 Sports & Outdoor Products 3.11 1.16 ↓ 8
12 Commercial & Industrial 2.20 1.10 ↓ 6
13 Fashion Accessories 2.44 1.08 ↓ 9
14 Health & Beauty 2.29 1.07 ↓ 9
15 Cars, Motorcycles 1.91 1.06 ↓ 5
16 Security & Surveillance 1.39 1.06 ↑ 4
17 Maternity & Baby Products 1.98 1.04 ↓ 9
18 Footwear & Accessories 1.56 1.04 ↓ 1
19 Lighting 1.77 1.03 ↓ 7
20 Musical Instruments 2.00 0.99 ↓ 13
21 Bridal Gowns 3.29 0.94 ↓ 19
(d) “The Belt and Road” Continues to Grow
The “The Belt and Road” initiative is also known as “The Silk Road Economic Belt and the
21st-century Maritime Silk Road” initiative. It focuses on connectivity and cooperation between
China and other global markets, through the oceangoing route from the South China Sea towards the
Indian Ocean, extending to Europe; through ports from the South China Sea to the ports in the Pacific
Ocean; the land-based economic belt forms a corridor that bridges China with the rest of Asia, Europe,
and Russia, and towards the global market.
DHGATE.COM | TSINGHUA, NELECT | CUFE, CCIER 221. “The Belt and Road” Major Trade Partners Analysis
The “The Belt and Road” initiative involves over 60 countries, in which 33 have an increased
turnover of 50% and above in comparison to the previous year; looking solely at the trade volume,
Russia is at the top of the table with the highest turnover and a more consistent growth rate, driven
by goods in 3C (computing, communication, and consumer) electronics, fashion, and household
products primarily. The performance of countries involved in the initiative, with respect to their
market size and growth in cross-border e-commerce (B2B) in 2015, is presented in Table 9 below.
Table 9: 2015 China’s Cross-Border E-Commerce (Export B2B),
Major Trade Partners & Growth: “The Belt and Road” Country
RANK MARKET SIZE MARKET GROWTH
1 Russia India
2 Israel Pakistan
3 Belarus Malaysia
4 Ukraine Albania
5 Turkey Slovakia
6 Poland Turkey
7 Czech Republic Philippines
8 Slovakia Thailand
9 Saudi Arabia Saudi Arabia
10 Latvia Armenia
11 Lithuania Romania
12 Hungary Israel
13 Bulgaria Lithuania
14 India Croatia
15 Estonia Latvia
16 Romania Egypt
17 Singapore Latvia
18 Moldova Slovenia
19 Thailand United Arab Emirates
20 Lebanon Lebanon
2. “The Belt and Road” Related Trade Analysis of Provinces
Different provinces in the “The Belt and Road” initiative have performed with varying degrees
of success in China’s cross-border e-commerce (B2B) sector, with a distribution of market size and
DHGATE.COM | TSINGHUA, NELECT | CUFE, CCIER 23growth. In terms of market size, Guangdong, Zhejiang, Shanghai, Fujian and other major provinces
in cross-border e-commerce continue to rank at the top of the table; in terms of growth, Xinjiang,
Tibet, Hainan, and Yunnan have been undergoing considerable growth despite being latecomers to
the competition (Table 10).
Table 10: 2015 China’s Cross-Border E-Commerce (Export B2B),
Market Size & Growth: “The Belt and Road” Provinces
RANK MARKET SIZE MARKET GROWTH
1 Guangdong Xinjiang
2 Zhejiang Tibet
3 Shanghai Hainan
4 Fujian Yunnan
5 Guangxi Jilin
6 Chongqing Chongqing
7 Shaanxi Guangxi
8 Heilongjiang Fujian
9 Jilin Heilongjiang
10 Liaoning Liaoning
3. “The Belt and Road” Traded Product Categories Analysis
With respect to the distribution of product categories, each province involved in the “The Belt
and Road” initiative all have their own respective propensities and traits, as Chart 12 below illustrates.
Chart 12: “The Belt and Road”: Province Distribution of Product Categories Traded
In Guangdong province, consumer electronics (computing, communication, and consume)
products accounted for approximately 50% of all transactions, followed by sports & outdoor products,
health & beauty, and lighting products; In Fujian province, shoes accounted for 27% of all
DHGATE.COM | TSINGHUA, NELECT | CUFE, CCIER 24transactions, followed closely by sports & outdoor products, fashion apparels and household goods also had a growth rate of 30% and above; In Zhejiang province, the distribution of product categories are more balanced, with health & beauty, household, jewelry, maternity, and fashion apparels making up the key products traded; in the key Northeastern provinces (Liaoning, Jilin, and Heilongjiang), apart from the few abovementioned export-trade oriented and economically-progressive provinces, the three Northeastern provinces have been undergoing overall growth markedly better than the rest of the provinces in China, with a growth rate of more than 80%; sports & outdoor, household goods, health & beauty, toys are a few areas that have been growing rapidly; In Shaanxi, health & beauty, sports & outdoor, commercial & industrial goods are the key products exported, which are also experiencing accelerated growth; In Chongqing, the transaction volume has grown by more than 40%, with the key products exported being automobile accessories, mobile phones, hair accessories and so on; In Xinjiang, transaction turnover has increased by leaps and bounds. Major products include those in consumer electronics, household goods, and fashion apparel; in Yunnan, transaction turnover has also more than doubled, with key products being in health & beauty accounting for over 30% of its total turnover, other categories including fashion apparel, hair accessories, household goods, toys and so on also fared well; Lastly, in Hainan, health & beauty also accounted for over 30% of its total turnover, followed by 3C electronics, fashion apparels and so on. DHGATE.COM | TSINGHUA, NELECT | CUFE, CCIER 25
4. China’s Cross-Border E-Commerce
                Development Trends & Prospects
   This section is an analysis on the development of China’s e-commerce (export B2B) sector
through three dimensions: regional development, product classifications, and trade partnerships.

(i) The Growing Prowess of “Chinese Brands”
     In its infancy, the barrier to entry in the cross-border e-commerce sector is relatively low.
However, products with poor quality can harm consumers to a great extent. At the current stage, to
optimize e-commerce platforms, greatly improving product quality and aftersales services are the
most imperative issues that e-commerce businesses must resolve. As Li Keqiang, the current Premier
of the State Council of China has pointed out, the Chinese cross-border e-commerce sector needs to
be revitalized, the focus on capacity and volume in foreign trade should be shifted and realigned
towards quality and excellence. Only the pursuit of quality can boost the economy and the nation,
and propel Chinese brands to the global stage, which is also a vision for cross-border commerce.

                        Chart 13: China’s Cross-Border E-Commerce (Export B2B)
                             Branded Products Sales Turnover Percentage

     Based on data from 2014-2015, as illustrated by Chart 13, the growth in GMV of branded
products in cross-border e-commerce have exceeded the growth of overall sales turnover, the
weightage for the GMV of brands have also increased significantly; it is forecasted that this trend
and emphasis on branding will continue. In 2011, during the infancy of cross-border e-commerce,
branding only accounted for 9% of the goods on the market, with very gradual growth. 2014-2015

DHGATE.COM   |   TSINGHUA, NELECT |    CUFE, CCIER                                                 26
has become China’s “Year of Branding” for cross-border e-commerce players, with the rate of
branding increasing from 12% to 19%, a significant increase. It is forecasted that by 2017, the rate
of branding will increase to 30%, this corresponds with the vision of the “Made in China 2025”
initiative, and will continue to be the impetus for the development of China’s import and export trade.
(ii) B2B Model, The Fundamental Pillar of E-Commerce
Massive Market Size: The circulation of commodity products requires three key processes,
which can be broken down into: procurement of B2B raw materials, B2B e-commerce distribution,
and B2C retail. Solely looking at the scale of transactions in each step, B2B clients are a far more
sizeable market compared to B2C clients.
High Units Per Transaction: The sales turnover from B2B orders are always larger than those
from B2C orders. This allows vendors and suppliers to lower their operating costs.
Customer Loyalty: For Business clients, they do not have the propensity to change suppliers
after a suitable partner has been found and a relationship has been established, as long as their long-
term procurement demands can be fulfilled.
Comparison of B2B clients and B2C clients.(Chart 14):
Chart 14: Unique Traits for Procurement in Cross-Border E-Commerce (Export B2B)
DHGATE.COM | TSINGHUA, NELECT | CUFE, CCIER 27Conclusion
1. The Era of Digital Globalization, Only 5 Years Remaining to Complete the Transition
from the Conventional Model of Export Trade
In the previous decade, millions of small-and-medium-sized enterprises have utilized cross-border e-
commerce platforms such as DHGate, in their pursuit of the global market. Between 2015-2016, more
and more traditional enterprises began embracing internet technologies and such platforms. From
factories involved in OEM manufacturing, traditional export trade businesses that wish to switch to
a model that incorporates e-commerce into their operations, to logistics, and even the finance sector
are all looking for opportunities through crossing the digital divide.
These are the results from the trend of “Digital Globalization.” Conventional offline enterprises and
purely online internet enterprises will cease to exist. In the coming 5 years, conventional enterprises
will all establish a presence online, while internet enterprises will continue their outreach to the now-
offline market. The market will no longer emphasize whether the enterprise is online or offline, as
the boundary will be blurred.
It is imperative to latch onto this window of transition in the coming five years, as a leader to
each industry will emerge from here, restructuring the industry’s ecosystem. From our
conservative estimate, only half of the businesses in the market currently will be able to seize the
opportunity to ride on the wave of digital globalization; a new form of entities will replace the
remaining 50% of businesses. Based on our forecast, by 2030, 2 billion job positions will no longer
exist, these 2 billion accounts for 50% of all positions globally. After 15 years, new models of
businesses will emerge.
2. Be An Early-Adopter of the Belt and Road, “The Online Silk Road”
In recent years, the policymaking and implementations of the “The Online Silk Road” under the “The
Belt and Road” initiative spearheaded by the state have sparked a series of systematic change.
The blueprint of this visionary plan is to tap into China’s Cross-Border E-Commerce platforms to
carve an edge in the global market. On one hand, the platforms allow us to bring in partner nations to
our market, through the introduction of their quality products to Chinese consumers; on the other
hand, it allows small and medium-sized enterprises in China to team up and enter onto the global
stage, to reach a potential market of four billion people. Hence, the early adopters who chose to
utilize the platforms can be the first to snag a pot of gold on the Belt and Road Initiative,
DHGATE.COM | TSINGHUA, NELECT | CUFE, CCIER 28through the Silk Road on the Internet, benefitting from the wealth brought by this state initiative. In July 2015, the Chinese government spearheaded the Belt and Road initiative, to establish a “Digital Silk Road.” Within a short span of three months, in November 2015, the first fruits of labor were reaped: State leader Xi Jinping and President Erdogan of Turkey signed a “Memorandum of Understanding regarding cooperation on the Belt and Road Initiative,” this was the first bilateral agreement in cross-border e-commerce trade signed by China. Shortly after, in November 2016, the second fruit was reaped, State leader Xi Jinping and President Kuczynski signed an agreement similar to the partnership between China and Turkey. One of the highlights to the Chinese-Turkish and Chinese-Peruvian agreements is that China will be responsible for establishing the bilateral cross-border e-commerce platforms. This taps into the natural edge from Chinese’s export-oriented economy, it is also much more beneficial to Chinese vendors – from the backend systems, to operations, payment methods, logistics, to financing – these are all familiar and customized to cater to Chinese vendors. Particularly for small-and-medium-sized enterprises, it would be unthinkable to explore a foreign market in the past, or even to send their employees abroad. In a matter of days, through the Digital Silk Road, businesses can now easily sell their goods to Turkey and even to Peru – halfway round the world. For the partners involved in this initiative, the “Digital Silk Road” is a great opportunity to leapfrog and outperform their competitors. The key is to be an early-adopter. In the past era of traditional trade, a developing nation could take decades or even a century to improve and progress to the standards of a developed nation. But today, countries involved in this initiative can use the platforms established by China directly, to replicate the success of Chinese industries, and progress. On the Digital Silk Road, Chinese consumer electronics, outdoor equipment, fashion apparel can reach the homes of Turkish consumers with greater speed and productivity. At the same time, Chinese consumers can purchase Turkish leather jackets and cherries from Peru at a fraction of their previous price. Establishing a Global Brand to Prosper, Seizing the Best Opportunities The first wave of cross-border e-commerce, to establish a business with modest means and to engage in a price war, is over. In 2015, the second wave of “Global Branding” has commenced. And through two years of cultivation, the next stage in 2017, will be the maturity of “Global Branding”. Chinese cross-border e-commerce vendors must ride on this wave if they do not wish to be eliminated in the coming few years. DHGATE.COM | TSINGHUA, NELECT | CUFE, CCIER 29
Based on the forecast of this report, the turnover attributed to branded products from China’s cross-
border e-commerce (B2B) sector will reach 30% of total sales by 2017, signifying a 150% growth
from 2014. In three years, the turnover from branded products will further increase to 50%, amassing
the growth of the market twofold.

As such, the crux to propelling the market forward is through branding, with platforms and individual
websites channeling resources towards branded products. As the cost of labor increase, as there is
heightened awareness of environment and conservation, it will be impossible for the poor product
quality, low pricing strategy of Chinese manufacturers to thrive. Currently, in the sectors of consumer
electronics, bridal gowns, wigs, outdoor products, and surveillance equipment, brands that are capable
of competing with foreign brands on the global market, from Chinese cross-border e-commerce
players have already emerged, hence the future competition of global branding will further intensify.

DHGATE.COM   |   TSINGHUA, NELECT |     CUFE, CCIER                                                 30
Appendix: Calculation Methodology
     The cross-border e-commerce market includes the four measures of market size index, growth
index, penetration index, and influential factor index. Of which, market size index and growth index
reflects the development of the cross-border e-commerce sector in comparison to its past performance.
The market size index focuses on the assessment of the current market conditions, the growth index
evaluates the developmental potential forecasted; the penetration index and influential factor index
reflects upon the external factors that can influence the development of the cross-border e-commerce
sector, with the penetration index assessing the impacts exerted by the cross-border e-commerce
sector on the overall economy, while the influential factor index evaluates the effects of the
environment and whether it is conducive to the sector. These four measures looks inwards and
outwards, and is a comprehensive appraisal of the development level of the sector, its
conceptualization can be explained in the following diagram:

     Market Size Index: The market size of the cross-border e-commerce sector. A higher value signifies a
larger market size. This index is a reflection of the current development of the region.
     Growth Index: The development and progress of the cross-border e-commerce sector. A higher value
signifies a greater potential for the region. This index is a reflection on the future of the e-commerce sector
based on forecasts.
     Penetration Index: The impacts exerted by the cross-border e-commerce sector on the overall economy.
A higher value signifies that the cross-border e-commerce sector plays a more important role in the economy,
with more influence in the import and export trade.
     Influential Factor index: The external support mechanisms that benefits and supports the cross-border
e-commerce sector. A higher value signifies that the local environment is more conducive to conduct cross-
border e-commerce in.

DHGATE.COM    |   TSINGHUA, NELECT |        CUFE, CCIER                                                     31
DHGATE.COM | TSINGHUA, NELECT | CUFE, CCIER 32
You can also read


