Market Performance Report 3Q20 - Uganda Communications ...

Page created by Marvin Harvey
 
CONTINUE READING
Market Performance Report 3Q20 - Uganda Communications ...
Market

                                             Report 3Q20
                                             Performance

1
    UCC - Market Performance Report   3Q20
Market Performance Report 3Q20 - Uganda Communications ...
Legal Disclaimer
                                  The information and figures contained herein were obtained from licensees’ submissions to the
                                  Commission and other sources available to the Commission. It is intended to provide the communications
                                  market overview to:
                                  1.    The industry
                                  2.    Prospective entrants
                                  3.    Government
                                  4.    Academia and other stakeholders
                                  5.    Any other interested parties

                                  UCC does not give any warranty and may not be liable for the interpretation arising from its use or misuse.
3Q20
UCC - Market Performance Report

          2
Market Performance Report 3Q20 - Uganda Communications ...
Introduction
Throughout the report we have made an effort to assess the post lockdown performance of the sector
in the months July to September 2020. By and large, we have seen strong recovery across the major
performance indicators with growth in subscriptions, domestic traffic, mail volumes, as well as industry
revenues. The highlight of this quarterly performance includes record quarterly revenues, as well as almost
2 million new broadband subscriptions.
The report covers:

1.    Emerging role of technology in the public health domain
2.    Global trends in 5G deployments
3.    Key licensing and policy changes for the Uganda Telecommunications Market
4.    Trends in mobile and mobile money subscriptions
5.    Product and service Performance
6.    Revenue Performance
7.    Highlights in postal and courier services
8.    Highlights in broadcast and multi media markets

                                                                                                              3Q20
                                                                                                              UCC - Market Performance Report

                                                                                                                       3
Market Performance Report 3Q20 - Uganda Communications ...
4
    UCC - Market Performance Report   3Q20

                                             Access
Market Performance Report 3Q20 - Uganda Communications ...
1.   Emerging role of technology in the public health domain

         As economies the world over grapple with early COVID effects, the Telecommunications, Media
         and Technology (TMT) sector has continued to emerge as a key societal and business glue,
         providing a digital bridge between persons and businesses amidst the pandemic.

         New applications and solutions continue to find their place in services like public health, where
         digital contact tracing has become a versatile tool despite the early data privacy concerns.

         These provide several digital contact tracing apps which now provide notifications to persons
         and public health officials with real time exposure threats.

         Source:https://www.thelancet.com/journals/landig/article/PIIS2589-7500(20)30142-4/fulltext

2.   Global trends in 5G deployments

         Global mobile subscriptions over the last three months have been dominated by growth in 5G
         subscriptions. These new subscriptions have been on the back of increased 5G deployments by
                                                                                                                3Q20

         leading network operators in Europe, Asia and America.

         At the end of September 2020, more than 50 operators across the world had invested in 5G for
         public networks albeit being at different stages of rollout. While the majority are trials, a number
         have gone ahead to commence license acquisitions and network deployments.
                                                                                                                UCC - Market Performance Report

         The growing global demand for 5G is partly on account of sustained Work-From-Home/remote
         working demand adopted by different industries over the period. To meet the new 5G demand,
         more than $186 billion has been invested globally in 5G network rollouts to date.

         At the retail end, global hardware giant Ericsson forecasts worldwide 5G subscriptions to reach
         3.5 billion by the end of 2026 and shall account for more than 40% of total mobile cellular
         subscriptions then.

                                                                                                                         5
Market Performance Report 3Q20 - Uganda Communications ...
In Africa, it is estimated that by 2025, a total of about $60 billion will have been invested in network
                                  infrastructure upgrades for 5G. Most notably, a few trials have happened on the continent in
                                  South Africa, Nigeria and in Lesotho.

                                  In Uganda, the National Task Force on the Fourth Industrial Revolution has released the national
                                  4IR strategy. The strategy places 5G and other emerging technologies as key service drivers
                                  and enablers across health, education, industry and tourism, among others.

                                  On the regulatory front, the UCC in consultation with the industry is reviewing Spectrum band
                                  plans in preparation for 5G. Further to this, the regulator in collaboration with the industry is
                                  establishing the first technology test bed in the country.
3Q20
UCC - Market Performance Report

          6
Market Performance Report 3Q20 - Uganda Communications ...
Key Policy Changes in the
Telecommunications Market

                            3Q20
                            UCC - Market Performance Report

                                     7
Market Performance Report 3Q20 - Uganda Communications ...
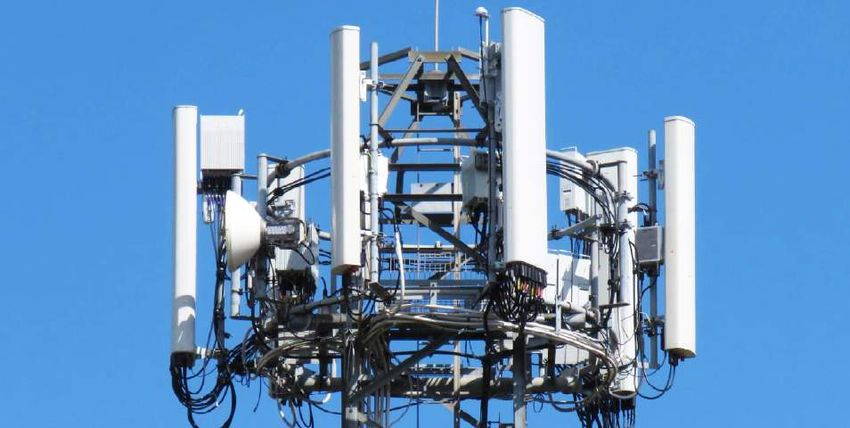
1.   2020 Telecom Licensing Framework

                                  Uganda license zones

                                           Following extended industry consultations towards the revision of the national telecommunications
                                           licensing regime in Uganda, the Commission issued a new licensing framework in July 2020.

                                           The new licensing regime is premised on the separation of service and infrastructure
                                           provisioning. Further, the new framework for the first time ever allows for the provision of regional
                                           telecommunication services. Uganda has been partitioned into 4 licensing zones that include
                                           Central, East, West and North.

                                                                                     Northern
                                                                                      Region

                                                                                                      Eastern
                                                                                                      Region
                                                                             Central
                                                                             Region
                                              Western
                                              Region
3Q20

                                                                                             Further to the introduction of zonal licenses,
UCC - Market Performance Report

                                                                                             the 2020 licensing framework establishes new
                                                                                             standards and obligations in network coverage,
                                                                                             service uptime and quality, as well as new
                                                                                             competition rules for players with Significant
                                                                                             Market Power (SMP) across the various
                                                                                             markets.

                                                                                             The new fairness and reasonableness
                                                                                             obligations extend to critical services like tower
                                                                                             services, leased lines and wholesale virtual
                                                                                             network platforms, among others.

          8
Market Performance Report 3Q20 - Uganda Communications ...
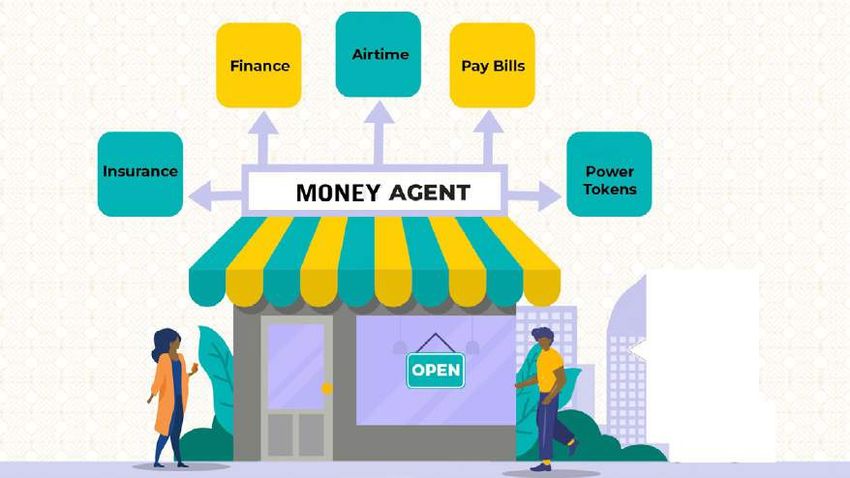
In compliance with the new regime obligations, MTN Uganda Limited - one of the pre-market
          liberalisation operators in Uganda - was successfully migrated and issued with a National
          Telecommunications Operator (NTO) license on 1st July 2020.

                                             “I am glad to inform you that our second National operator
                                             License has been signed and MTN can continue operating
                                             in Uganda. We are happy and remain committed to our
                                             vision of delivering a bold digital life to all our customers
                                             through diligent innovation and shall continue to provide high
                                             quality voice, data and mobile money services connecting
                                             Ugandans across all the 135 districts of Uganda.” – Wim
                                             Vanhelleputte (CEO, MTN Group)

The 10-year National Telecommunications Operator license obliges holders to, among others meet:

   90% voice and data service geographic coverage within 5 years of award.
   Data protection obligation
   Consumer protection rules
   Interconnect and access obligations
   National roaming with domestic access seekers
   Infrastructure sharing with other licensees
   Compliance to fair competition rules with respect to third party services (fairness, reasonableness and non-discrimination)

                                                                                                                                  3Q20
                                                                                                                                  UCC - Market Performance Report

                                                                                                                                           9
Market Performance Report 3Q20 - Uganda Communications ...
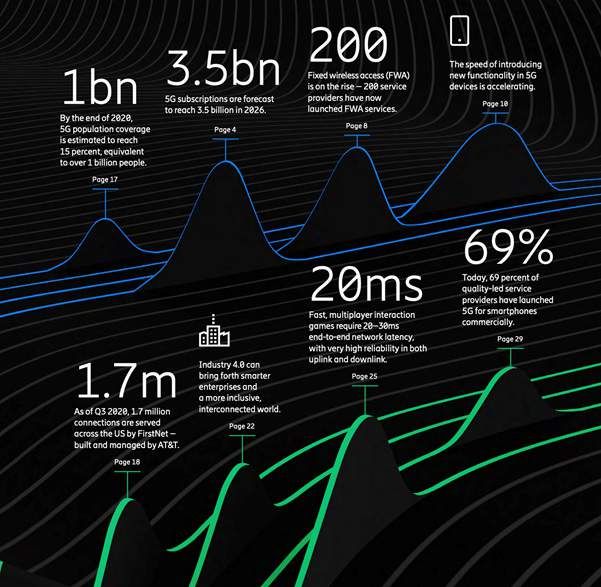
Major License categories

                                       Public Infrastructure
                                       Provider License -
                                       (PIP)

                                       Public Service Provid-
                                       er - (PSP)

                                       National
                                       Telecommunications
                                       Operator - (NTO)

                                  2.    Recovery in Mobile Markets

                                              Following the subscriber dip witnessed between March and
                                              June 2020, the industry has posted more than 1 million new
3Q20

                                              mobile subscriptions in the months July to September 2020.

                                              The market topped 26.5 million fixed and cellular
                                              subscriptions, equalling the pre-COVID subscriber count of
                                              December 2019.
                                                                                                                   1 million
                                                                                                                  new mobile
UCC - Market Performance Report

                                              In terms of quarter-on-quarter growth, the 4% growth
                                              realised in the period July-September 2020 again equals
                                              the intra-quarter growth rate realised in the last quarter of
                                                                                                                     subs
                                              2019.

                                              In terms of year on year comparison, the sector posted a 3.3% year on year growth in subscriptions
                                              between September 2019 and September 2020. This despite a 3 million subscriber erosion
                                              between March and June 2020 at the onset of the COVID-19 pandemic.

                                              Amidst the sector wide disruption over the last 6 months, the sector averaged quarter on quarter
                                              growth rates of 1% over the last 12 months. This comparatively subdued performance is largely
   10                                         attributed to the 11% subscriber drop in the months April-June 2020.
7%                    11%                   4%

                                           Growth                  Drop                Growth

                              26,691,131            28,450,429            25,452,770            26,526,280

                                                             82%
                                4Q19                  1Q20                   2Q20                  3Q20

           In terms of nationwide access, the subscription recovery translates into a national telephone
           penetration of 64 lines for every 100 Ugandans.

           Note: These numbers are drawn from registered mobile subscriptions that have undertaken at
           least one billable service in the 90-day period ending September 30th, 2020.

Quarter on Quarter Subscriber Additions and Penetration Rates

   3Q19      81,274               25,601,434                        25,682,708

                                                                                                     +1,008,423

   4Q19      85,750              26,605,421                         26,691,131

                                                                                                     +1,759,298
                                                                                                                  3Q20

   1Q20      85,929              28,364,500                         28,450,429

                                                                                                     -2,997,659
                                                                                                                  UCC - Market Performance Report

   2Q20      85,738               25,367,032                        25,452,770

                                                                                                     +1,073,510
             88,932               26,437,348                        26,437,348
   3Q20

  Fixed line Subscribers     Mobile Subscribers           Total Subscribers            Net quarterly Addi�ons

                                                                                                                    11
3.     Broadband Connections

                                  Internet Penetration and Growth Trends

                                   Internet Connections
                                   per 100 Ugandans

                                                                                                                                                                   425,777

                                                                                                                                                    559,384
                                            48 -                                                                                                                             48
                                                                                                                                    217,851
                                            47 -     1,277,672                                                       565,150                                  47
                                            46 -                  46                                                           46             46
                                            45 -                                  45              45

                                            44 -                                                               44
                                                                                       (52,072)
                                            43 -   43                  (91,342)
                                                                                                   (445,932)
                                            42 -
                                            41 -
                                            40 -
                                                   Jan           Feb              Mar         Apr              May         Jun            Jul             Aug            Sep
                                        -                 Internet Connec�ons for Every 100 Ugandans                            Net Susbcriber Addi�ons

                                      -
                                  Broadband Subscriptions 2020
                                        -
                                       18,846,885           30,440                      18,917,120              27,351                   20,117,015                  30,486
                                        -

                                        -

                                        - 18,877,325                                         18,944,471                                            20,147,501
3Q20
UCC - Market Performance Report

                                                    1Q20                                               2Q20                                               3Q20

                                       Fixed internet subscrip�ons                       Mobile internet subscrip�ons                              Total internet subscrip�ons

                                                   Note: Tele-density calculated using UBOS population figures 2020

                                                   Broadband cellular subscriptions continued with an upward growth trajectory growing by an
                                                   additional 1.2 million connections in the quarter ending September 2020. This is on the back
                                                   of the exceptional resilience realised in the period March to June 2020 amidst the national
   12                                              lockdown.
At the end of September 2020, total
         internet subscriptions had for the first
         time in industry history crossed the                          Ugandans
         20 million mark. This translates into                        connected to
         an internet connection for 1 in every                        a broadband
         2 Ugandans.
                                                                         service

Fixed Internet Subscriptions
                                                Jan      33,874
                                                Feb      34,152
                                                Mar      30,440
                                                Apr      21,054
                                                May      22,455
                                                Jun      27,351
                                                Jul      30,278
                                                Aug      30,071
                                                Sep      30,486

Mobile Internet subscriptions

                                          Jan       17,657,121
                                          Feb       18,934,515
                                          Mar       18,846,885
                                          Apr       18,804,199
                                          May       18,356,866
                                          Jun       18,917,120
                                          Jul       19,132,044
                                          Aug       19,691,357
                                          Sep       20,117,015

         This exceptional performance is still mainly attributed to the shifting work culture caused by the
         COVID-19 pandemic, which led many businesses to adopt remote working methods.

         We have also witnessed increased IOT use cases and mobile-based digital payment services in
         the market as more businesses digitise in the face of the global COVID-19 pandemic.

    Realignment of Mobile Broadband Value Propositions
                                                                                                              3Q20

         The shift in work cultures and digitisation of small businesses has also coincided with increased
         customer onboarding and promotional campaigns during the period by different operators.
         Below are highlights of mobile broadband promotional campaigns during the period:

         MTN Uganda:
                                                                                                              UCC - Market Performance Report

                   Gaga Wednesday
                   Data Dabolo
         Airtel Uganda:
                   Airtel TV bundles
                   Refer and Earn
                   Freaky Friday
                   Smartphone Acquisition Campaign
         Africell:
                   Hakuna Matata
                   Night Calls bundle.
         Smile:
                   True Unlimited bundles
         UTL also launched several bundles for wireless and fixed internet services                             13
Network Connected Devices

                                          Following the drop in total internet-enabled gadgets
                                          connected to the network in 2Q20 there has been
                                          a considerable recovery of 1 million new terminals
                                                                                                             1 million
                                          connected. Of these, 530,000 were smartphones while
                                          470,000 were feature phones.
                                                                                                           new devices
                                                                                                            connected
                                          The growth in network connected devices yet again
                                          remains driven by MNO-device importer partnerships in
                                          Uganda. Airtel and MTN launched flagship campaigns
                                          with Tecno’s CAMON 16 and the Infinix Note 7.
3Q20
UCC - Market Performance Report

                                          This recovery is likely due to the reopening of retail outlets and resumption of business following
                                          the lifting of the national lockdown .

   14
The growth in network-connected gadgets is in sync with global gadget shipments by the major
               vendors in the months July-September 2020. Industry analysts have estimated global handset
               shipments to have topped 350 million in the three month period, representing a 22% quarter-on-
               quarter increment.

               Samsung, Xiaomi and Huawei led global handset shipments, accounting for more than 51% of
               total shipments. Transsion Holdings, the market leader in emerging markets (manufacturer of
               Infinix, iTel and Tecno) shipped 8.4 million units in the quarter under review.

                       Samsung                        Xiaomi                          Huawei                  Infinix/Tecno/iTel

Network Connected Device Distribution

    BASIC MOBILE PHONE                                      FEATURE PHONES
    Limited to voice calls and text messages.               Limited app and browsing functionality

                          Monthly Users                                                                            Monthly Users

                           Oct-19       3,176,620                                                                   Oct-19    17,147,310

                           Nov-19       3,268,166                                                                   Nov-19    17,169,003

                           Dec-19       3,409,724                                                                   Dec-19    17,179,345

                           Jan-20       3,422,727                                                                   Jan-20    17,458,317

                           Feb-20       5,071,470                                                                   Feb-20    17,072,042

                           Mar-20       5,076,937                                                                   Mar-20    17,278,770

                           Apr-20       5,043,103                                                                   Apr-20    17,153,420

                           May-20       5,023,126                                                                   May-20    17,027,605

                           Jun-20       5,087,856                                                                   Jun-20    17,090,406

                           Jul-20       5,511,198                                                                   Jul-20    17,591,691

                           Aug-20       4,075,893                                                                   Aug-20    17,673,023
                                                                                                                                           3Q20

                           Sep-20       5,446,716                                                                   Sep-20    17,630,033

                                                                                                                   Monthly Users
                                                                      SMARTPHONES                                   Oct-19    6,169,968
                                                                      A class of mobile phones and of multi-
                                                                                                                                           UCC - Market Performance Report

                                                                      purpose mobile computing devices.             Nov-19    6,524,656
                                                                      They are distinguished from feature           Dec-19    6,609,717
                                                                      phones by their stronger hardware
                                                                      capabilities and extensive mobile             Jan-20    6,860,946
                                                                      operating systems, which facilitate
                                                                                                                    Feb-20    6,981,855
                                                                      wider software, internet (including web
                                                                      browsing overmobile broadband), and
                                                                                                                    Mar-20    7,091,860
                                                                      multimedia functionality (including music,
                                                                      video, cameras, and gaming), alongside        Apr-20    6,973,679
                                                                      core phone functions such as voice calls
                                                                      and text messaging.                           May-20    6,939,916

                                                                                                                    Jun-20    6,961,778

                                                                                                                    Jul-20    7,128,124

                                                                                                                    Aug-20    7,248,422

                                                                                                                    Sep-20    7,426,229
                                                                                                                                             15
https://www.canalys.com/newsroom/canalys-worldwide-smartphone-market-q3-2020
Device Movements and Distribution.

                                  30,600,000 -
                                                                                                                                                                                                       +1.51M
                                  30,200,000 -

                                  29,800,000 -
                                                                                                                                                        +1.09M                        -1.23M
                                  29,600,000 -
                                                                            +0.32M                     -0.277M
                                  29,200,000 -                                                                             -0.180M             +0.15M

                                                                                                                                                                                                                 30,502,978
                                                                                                                                                                       30,231,013
                                  28,800,000 -

                                                     +1,38M
                                  28,400,000 -

                                                                                          29,447,567

                                                                                                                                                        29,140,040
                                                                      29,125,367

                                                                                                             29,170,202

                                                                                                                                                                                          29,170,202
                                  28,000,000 -

                                                                                                                                  28,990,647
                                  27,600,000 -
                                                       27,741,990

                                  27,200,000 -

                                  26,800,000

                                                      Jan-20          Feb-20             Mar-20             Apr-20               May-20                 Jun-20       Jul-20             Aug-20                  Sep-20
                                                                                                          Total Devices                        Net addi�ons           Net reduc�ons

                                  4.       Mobile Financial Services
                                                    Mobile Financial Services led industry-wide product growth, with 1.8 million new registered
                                                    accounts between June and September 2020. This tops product performance of mobile voice
                                                    and data service additions.

                                  Subscriptions: Mobile Money, Voice & Data

                                                                                     1,938
                                                                                                                                                                     1,814

                                                                                                                                                                                    1,203
                                                                                                1,759                                                                                   1,073

                                                                                   694
                                                                                                                                521
                                                                                                                                        67
                                       SUBSCRIPTION GAIN
                                                                    1Q20                                   2Q20                                           3Q20
                                       SUBSCRIPTION LOSS
3Q20

                                       (Values are in thousands)
UCC - Market Performance Report

                                                                                                                                               (2,998)

                                               Mobile Money Subscriber addi�ons
                                                                                                                                                                      1.8 million
                                                                                                                                                                         new
                                                 Mobile Data Subscriber Addi�ons
                                                                                                                                                                      registered
                                                 Voice Subscriber Addi�ons
                                                                                                                                                                     mobile money
                                                                                                                                                                       accounts

   16                                                                                                                     396
The growth in the period under review was mainly led by new subscriptions in contrast to
                reactivation-led growth witnessed in the period April-June 2020. This observation is especially
                important given the number of new first time mobile financial service users in the market.

                First-time mobile financial service users present new consumer protection challenges and are
                often susceptible to fraudulent schemes by both individuals and agents. A market research
                conducted by the UCC and Innovation for Poverty Action (IPA) in the period 2019-2020 showed
                that more than 40% of customers surveyed reported a money-related consumer challenge.
                These ranged from agent overcharging, unclear/unexpected fees to incorrectly sending money.
                Moreover, 61% of consumers take no initiative to report these challenges.

                An analysis of call centre dumps from the four leading telecom operators under the UCC/IPA
                consumer protection research project showed that:

                       46% of Mobile Network Operator (MNO) customer complaints logged reported receiving a
                        COVID-19 related fraud/scam call on mobile money
                       49% of scammers claimed to be the MNO, 24% did not identify themselves
                       Over 60% of the reported scam attempts involved requests for money to be sent, while the
                        remainder sought to access customer Personal Identification Number (PIN) and other sensitive
                        information.

Source: UCC/IPA Consumer Protection Research 2020.
                                                                                                                       3Q20

                With the 1.8 million new accounts, the total number of registered accounts stood at 27.7 million
                at the end of September 2020. This translates into a financial service penetration of at least 2
                registered lines for every 3 Ugandans.
                                                                                                                       UCC - Market Performance Report

                    Mobile Money Account Activity 2Q20                 Mobile Money Account Activity 3Q20

                                  19%                                           19%
                                  4.95M                                         5.28M

                                    81%                                          81%
                                   20.9M                                         22.4M
                                              Total Active Accounts   DormantAccounts                                    17
Further, the Ugandan mobile money landscape continues to present a high conversion rate
                                                from registration to account activity. At the end of September 2020, 81% of all registered money
                                                accounts had partaken in at least one billable mobile money transaction in the 90 days preceding
                                                30th September 2020. This translates into a 7% quarter on quarter growth in active wallets.

                                  Growth in Registration and Active Mobile Money wallets

                                                                                                                         27,720,859
                                   28,000,000

                                   27,000,000                                                25,906,360
                                                                     25,384,405
                                   26,000,000   24,690,251
                                   25,000,000

                                   24,000,000
                                   23,000,000                                                                                                  22,433,554
                                   22,000,000

                                   21,000,000                                    20,974,231            20,948,133
                                   20,000,000

                                   19,000,000
                                                         18,684,504
                                   18,000,000

                                   17,000,000

                                   16,000,000

                                   15,000,000

                                                       4Q19                  1Q20                  2Q20                                3Q20

                                                           Registered Mobile Money Wallets         Ac�ve Mobile Money Wallets

                                                The high account activity ratio is particularly commendable given the fact that MTN & Airtel
                                                reintroduced Person to Person (P2P) remittance charges in June 2020, albeit at a discount of
                                                50% relative to pre-lockdown levels. This is a fundamental move from the remittance fee waiver
                                                extended to customers at the onset of lockdown in March 2020
3Q20
UCC - Market Performance Report

                                                                                                            Rates as at 15th December 2020 - www.airtel.co.ug
                                                                                                            https://www.airtel.co.ug/airtelmoney/transaction_fees

                                                Relatedly, Regulated Financial Institutions (RFIs) reinstituted ‘bank-to-wallet’ and ‘wallet-to-
                                                bank’ charges. These can be as high as UGX 2,300 per transfer.
   18
The table below shows comparative ‘bank-to-wallet’ and ‘wallet-to-bank’ charges for 6 select
             banks.

BANK–TO-WALLET                                                           WALLET–TO-BANK
Stanbic Bank                                                             MTN
Tier (UGX)                               Rate UGX)                       Tier (UGX)                               Rate UGX)
5,000 – 60,000                           1,000                           2,500 – 125,000                          1,500
60,001 – 250,000                         1,300                           125,001 – 250,000                        2,250
250,001 – 500,000                        2,000                           250,001 – 500,000                        4,100
500,001 – 1,000,000                      3,000                           500,001 – 1,000,000                      6,150
1,000,001 – 2,000,000                    4,500                           1,000,001 – 2,000,000                    9,250
2,000,001 – 4,000,000                    5,500
                                                                         2,000,001 – 7,000,000                    11,300
Standard Chartered
                                                                         AIRTEL
Tier (UGX)                               Rate UGX)
                                                                         Tier (UGX)                               Rate UGX)
5,000 – 5,000,000                        2,000
                                                                         5,000 – 15,000                           700
DFCU Bank
                                                                         15,001 – 30,000                          900
Tier (UGX)                               Rate UGX)
                                                                         30,001 – 45,000                          1,350
< 60,000                                 1,500
                                                                         45,001 – 60,000                          1,500
60,001 – 250,000                         1,600
                                                                         60,001 – 125,000                         2,000
250,001 – 500,000                        2,000
                                                                         125,001 – 250,000                        2,250
500,001 – 1,000,000                      3,000
                                                                         250,001 – 500,000                        6,000
1,000,001 – 2,000,000                    4,500
                                                                         500,001 – 1,000,000                      9,000
2,000,001 – 4,000,000 +                  5,500
                                                                         1,000,001 – 2,000,000                    13,500
ABSA
                                                                         2,000,001 – 3,000,000                    13,500
Tier (UGX)                               Rate UGX)
                                                                         3,000,000 – 5,000,001                    16,500
5,000 - 60,000                           1,500
                                                                         500,001 – 1,000,000                      4,500
60,001 – 125,000                         2,000
                                                                         1,000,001 – 2,000,000                    5,000
125,001 – 250,000                        2,500
                                                                         2,000,001 – 5,000,000 +                  5,500
250,001 – 500,000                        3,500
500,001 – 1,000,000                      4,500
1,000,001 – 2,000,000                    5,000
2,000,001 – 5,000,000 +                  5,500

     https://www.stanbicbank.co.ug/static_file/Uganda/Downloadable%20files/Key%20Facts%20Documents/PersonalMarketsTarrifGuide2020.pdf
     https://www.sc.com/global/av/ug-mobile-money-home.pdf
     https://www.dfcugroup.com/wp-content/uploads/2020/11/Tariff-1.pdf
     https://www.absa.co.ug/content/dam/uganda/absa/pdf/tariff_guide/absa-personal-banking-tariff-guide.pdf
     https://www.mtn.co.ug/insight/mobile-money-tariffs/
     https://www.airtel.co.ug/airtelmoney/transaction_fees                                                                              3Q20

             Further to this, COVID-19 is still very much in the public domain which has hastened the adoption
             of online and remote working methods. Many retailers and merchants are shifting to digital
             payments over cash due to the reduced risk of exposure.
                                                                                                                                        UCC - Market Performance Report

Market Acquisitions and Exits

             In the digital payments space, the market welcomed Mauritius based payments aggregator MFS
             Africa following a cash and share acquisition of local payments aggregator Beyonic Inc. at the
             end of June 2020.

                                                                                                                                          19
Mobile Money Agent Network

                                           The number of active mobile money agents grew from 219,169 in June 2020 to 227,736 by the end of
                                           September 2020. This is likely due to an increase in business activity post-lockdown, and the increased
                                           demand for digital financial services coupled with eased restrictions on movement.

                                  Active Wallets Per Agent

                                                                                                                                                                  Number of Ac�ve Subscrip�ons Per Agent
                                                                                                                  Jan         97
                                                                                                                  Feb         97
                                                                                                                  Mar         98
                                                                                                    Pay
                                                                                                   School
                                                                                                    Fees
                                                                                                                  Apr         101
                                                                                                                  May         99
                                                                                                                  Jun         96
                                                                                                                  Jul         97
                                                                                                                  Aug         97
                                                                                                                  Sep         99

                                  Agent Access Points over the last year

                                                                                          4Q19               204,141              Number of agent access points

                                                                                          1Q20               213,295
                                                                                         2Q20                219,169
3Q20

                                                                                           3Q20              227,736
UCC - Market Performance Report

                                                                                                                   8,500
                                                                                                                 new agents
                                                                                                               added between
                                                                                                                2Q20 & 3Q20

   20
Performance
                                              Product and Service

     UCC - Market Performance Report   3Q20

21
5.    Domestic Voice Traffic
                                                 In the 3 months July-September 2020, the market posted a total of 14.4 Billion domestic minutes
                                                 (onnet and offnet). This represents 1.3 Billion domestic minutes over and above total minutes
                                                 sold in the period April-June 2020.

                                                 This double - digit performance is on the back of a 5% dip in domestic traffic experienced in the
                                                 quarter April-June 2020.

                                                 In terms of monthly performance, August posted the highest volume of domestic traffic in the last
                                                 nine months, with 4.9 Billion minutes of domestic talk.

                                      Aggregate Domestic Quarterly Traffic & Growth

                                                                                                                                                     14,421,362,990
                                                                          13,746,142,072                        13,109,234,519
                                             12,551,606,697
                                                                                +10%                                                                       +10%
                                                                                                                     -5%

                                                4Q19                            1Q20                               2Q20                                    3Q20

                                      Aggregate Domestic Traffic for January – September 2020

                                                                                                                                                     4,891,888,341

                                                              4,705,394,880
                                                                                       4,645,662,698
                                                                                                                                         4,750,059,811            4,779,414,838
                                                                                                                                                                                  1Q20

                                                                  6%                                                       4,438,613,526
                                                                                                                                                          3%
                                                                         4,395,084,493                          4,373,149,866                 7%
                                                                                            6%                                                                        -2%
                                                                                                  4,297,471,127

                                                                               -7%                                               1%
                                                                                                                    2%
                                                                                                        -7%
   3Q20

                                                                Jan-20        Feb-20     Mar-20        Apr-20     May-20        Jun-20      Jul-20       Aug-20      Sep-20

                                                                                       Domes�c Voice Traffic                      Growth Rate
   UCC - Market Performance Report

1Q20                                 2Q20

      22
On-Net and Off-Net Traffic

                                                                                       ON-NET MINUTES

                                                                                                                                                                             Aug
                                                                                                                                                                                                     Sep
                  Jan                                                                                                                                   Jul
                                                            Mar
                                       Feb                                                                                Jun
                                                                                                          May
                                                                                         Apr

                                                                                -4%                                                       +10%
                  4,638,894,249

                                       4,334,653,468

                                                            4,582,002,408

                                                                                                                                                        4,696,650,133

                                                                                                                                                                               4,838,223,541

                                                                                                                                                                                                      4,726,994,236
                                                                                         4,254,866,114

                                                                                                          4,322,416,433

                                                                                                                          4,389,640,464
                  13,555,550,125                                                         12,972,923,010                                               14,261,867,911

                                  1Q20                                                                   2Q20                                                           3Q20

                                                                                       OFF-NET MINUTES
                         Jan

                                                                  Mar
                                            Feb

                                                                                                                                                 Jul                    Aug
                                                                                                                                                                                               Sep
                                                                                                                          Jun

                                                                                                          May
                                                                                         Apr
                                                                                -28%                                                      +17%
                                                                                                                                                 53,409,677

                                                                                                                                                                        53,664,800

                                                                                                                                                                                               52,420,602
                          66,500,631

                                               60,431,025

                                                                   63,660,290

                                                                                          42,605,013

                                                                                                          44,733,433

                                                                                                                          48,973,063

                                  190,591,946                                                  136,311,508                                          159,495,079

                                       1Q20                                                              2Q20                                                 3Q20

          In terms of domestic traffic distribution, the market remains a predominately on-net market with
          98.89% of total quarterly traffic remaining on-net, while off-net traffic remains at 1.11% of total
          domestic talk. This is despite a reduction in Mobile Termination Rates (interconnection rates)
          following issuance of an MTR cap by the Uganda Communications Commission.
                                                                                                                                                                                                                      3Q20

          Presently, the domestic MTR stands at 45 shillings per cross-network minute and 3 shillings per
          SMS. This follows the recommended rate review in line with the 3 year MTR glide path agreed
          upon following a cost-of-service assessment in 2018.

          We note that off-net traffic has grown by a factor of 17% between the quarters April-June and
                                                                                                                                                                                                                      UCC - Market Performance Report

          July-September 2020, almost matching the drop in MTR, vindicating the regulator’s move to
          slash mobile termination rates. Regulatory oversight is especially important in markets where
          some operators enjoy strong advantages of incumbency against new upstarts.

                                                                                                                                                                                                                        23
Mobile voice traffic has averaged 53.2 million off net minutes per
                                           month during the quarter, with an off-net traffic peak in August of
                                           53.6 million minutes.                                                       Off-net
                                           In percentage terms, on-net domestic traffic increased by 10%              domestic
                                           while off-net domestic traffic increased by 17% in the three
                                           months July – September 2020.
                                                                                                                        traffic
                                                                                                                     increased
                                           In terms of intra-quarter performance, the market has averaged
                                           4.8 billion on-net minutes per month during the quarter, with an            by 17%
                                           on-net monthly traffic peak in August of 4.84 billion minutes.

                                           During 3Q20, the market averaged 179.5 on-net minutes per subscriber per month, or
                                           approximately 6 minutes per day, compared to 161.4 minutes per subscriber per month in 2Q20.

                                           In the same period, the market averaged 2.0 off-net minutes per month per subscriber. This is an
                                           increase from 1.70 minutes seen in 2Q20, further evidence of the shift in consumer behaviour as
                                           a result of the change in the MTR.

                                       Unstructured Supplementary Service Data (USSD)

                                           USSD sessions increased by a factor of 12% between 2Q20 and 3Q20, to a total of 6.9 billion
                                           sessions from 6.2 billion in the previous quarter. This is largely on the back of increased mobile
                                           money activity.

                                             USSD
                                             Traffic

                                                                                                   2,396,956,180
                                                                             2,384,566,498
                                                           2,187,148,986
                                                              Jul-20             Aug-20               Sept-20

                                                                           6,968,671,664

                                           On a month-by-month comparison, the total number of sessions averaged 2.3 billion per month
                                           during the quarter. The quarterly peak was realised in September 2020 with a total of 2.4 billion
                                           USSD sessions.

                                           Despite growth in monthly sessions, we note that monthly USSD session totals have failed to
3Q20

                                           match the nine-month peak of 2.7 billion sessions posted in June prior to the reintroduction of
                                           mobile money remittance charges.

                                  6.   Broadband Traffic
                                           During 3Q20, total quarterly broadband traffic has grown
UCC - Market Performance Report

                                           to 59.3 billion MBs from the previous quarterly record of
                                           59.1 billion MBs downloaded in 2Q20.
                                                                                                                        59.3
                                           While the incremental 200 million MBs downloaded in
                                           3Q20 may not appear commensurate with the additional                    Billion MBs
                                           1.8 million mobile broadband subscriptions, it is
                                           commendable given the COVID-driven peak performance                     downloaded
                                           of 2Q20.                                                                  in 3Q20
                                           Total quarterly broadband traffic translates into an
                                           average of 746.7 MBs per subscriber per month, or 24.9
                                           MBs per day.
   24
The market has averaged 19.8 billion MBs downloaded per month during the quarter, with a
         traffic peak of 20.2 billion in August 2020.

         The key demand drivers during the quarter remained the heavy promotional activity introduced
         by the Telcos. Airtel Uganda revamped its ‘Freaky Friday’ product, while MTN reintroduced their
         ‘Gaga Wednesday’ bundle.

         The quarter also saw sustained activity by other operators like Smile Telecom, Roke Telkom,
         Simbanet/Zuku and Lyca Mobile pitching targeted value propositions to the high-value broadband
         market segments. Central to these value propositions are Work-From-Home packages as well
         as streaming services. Some of these players have intimated that streaming traffic now accounts
         for more than 65% of their broadband traffic.

         In a move from MNO price leadership witnessed in the voice segment, the fringe mobile
         broadband providers are repositioning themselves as price leaders in the broadband category.
         For example Lyca Mobile presently leads with a monthly offer of UGX 45,000 (USD 12 est.) for
         100GB translating into a retail price of 12.5 US cents per GB (UGX 450 per GB).

Price Per GB Comparison for Monthly Bundles (UGX)

           SMILE TELECOM

               ROKE TELKOM
                                                                                                           3Q20
                 LYCA MOBILE

                      AIRTEL

                        MTN

                               0     500         1000   1500     2000     2500    3000   3500
                                                                                                           UCC - Market Performance Report

        Operator       Cost in UGX         Bundle in GBs       Cost per GB       Name of Bundle
        Smile          200,000             100                          2,000    100GB Monthly
        Roke           250,000             100                          2,500    Roke Unlimited Plus
        Lyca           45,000              100                           450     UG GIGA
        Airtel         150,000             65                           2,308    Monthly_65GB
        MTN            550,000             170                          3,235    Monthly Bundle

         *The bundles have been selected based on the highest available data volume for
         monthly packages                                                                                    25
7.           International Voice Traffic
                                                           The period 3Q20 posted 186 million minutes of total international traffic from 190 million in 2Q20.
                                                           This segment remains skewed to incoming traffic, which accounts for 68% of total international
                                                           traffic.

                                                           While international incoming traffic grew by 1.8 million minutes, outgoing international traffic fell
                                                           by 5 million minutes in the quarter 3Q20. Again, the drop in outbound international traffic is due
                                                           to the growing migration to Over-The-Top (OTT) calling and video services for both retail and
                                                           business users.

                                  Quarter-On-Quarter Incoming and Outgoing International Traffic

                                                                 +7%                            +2%                          -2%                             -2%
                                                                Growth                          Growth                       Drop                            Drop

                                            42%
                                            74,559,983
                                                                          42%
                                                                          80,156,135
                                                                                                          39%                          34%                             32%
                                                                                                         76,165,544                    65,396,757                      59,439,940

                                                  58%
                                                 103,616,174
                                                                                58%
                                                                               110,882,443
                                                                                                                61%
                                                                                                               117,847,112
                                                                                                                                              66%
                                                                                                                                              125,051,145
                                                                                                                                                                              68%
                                                                                                                                                                              126,878,822

                                             178,176,157                   191,038,578                     194,012,656                     190,447,902                     186,318,762
                                                3Q19                           4Q19                             1Q20                           2Q20                           3Q20
                                                                                       Incoming Traffic                 Outgoing Traffic

                                                           International outgoing traffic remains largely destined to the Northern Corridor partner states of
                                                           Kenya, Rwanda and South Sudan, with which Uganda has special international traffic termination
                                                           framework.

                                                           In 3Q20, ONA traffic accounted for 80% of total international outgoing traffic. The rest of the
                                                           world only accounted for 20% of total international outgoing minutes.

                                  Quarter-on-Quarter Outgoing International Traffic Growth

                                                                                             80,156,135
                                             90, 000, 000         74,559,983                                          76,165,544
3Q20

                                             80, 000, 000                                                                                 65,396,757
                                             70, 000, 000                                                                                                           59,439,940
                                                                                   8%                       -5%
                                             60, 000, 000
                                  Minutes

                                             50, 000, 000                                                                           -14%                    -9%
UCC - Market Performance Report

                                             40, 000, 000

                                             30, 000, 000

                                             20, 000, 000

                                             10, 000, 000

                                                           0
                                                                    3Q19                       4Q19                     1Q20                  2Q20                    3Q20
                                                         ONA Traffic Distribu�on               Rest of World Traffic Distribu�on                Quarter-on-Quarter Traffic Growth

   26                             This traffic excludes Roaming traffic
On average 87% of international incoming traffic originates from ONA member states. Relatedly,
                     80% of outgoing international traffic is terminated in ONA markets. The international traffic
                     distribution is indicative of Uganda’s preferential international trade position with its neighbours.

                     Further, the increase in the share of international traffic captured by ONA states may be reflective
                     of the decreased demand for non-ONA international minutes due to the reduced travel in the
                     current global context.

Quarter-on-Quarter Incoming Traffic Growth

                                                                                     125,051,145     126,878,822
          130, 000, 000                                               117,847,112
                                                 110,882,443
          120, 000, 000
                              103,616,174                                                          1%
          110, 000, 000
                                                                                    6%
          100, 000, 000                                          6%
           90, 000, 000                     7%
           80, 000, 000
Minutes

           70, 000, 000

           60, 000, 000

           50, 000, 000

           40, 000, 000

           30, 000, 000

           20, 000, 000

                                3Q19                 4Q19                1Q20            2Q20           2Q19
                   ONA Traffic Distribu�on         Rest of World Traffic Distribu�on     Quarter-on-Quarter Traffic Growth

                                                                                                                             3Q20
                                                                                                                             UCC - Market Performance Report

                                                                                                                               27
8.   Monthly User Traffic Profile            INTERNATIONAL
                                                                                 OUTGOING

                                                                                               INTERNATIONAL
                                                                   OFFNET                         INCOMING

                                                                                  1.0
                                                                                  MINUTES

                                                                   2.3                           1.4
                                             4Q19            ONNET
                                                                   MINUTES                       MINUTES

                                                                                                       MOBILE (MBs)

                                                              164                                          538
                                                              MINUTES                                      MBs

                                                                               INTERNATIONAL
                                                                                 OUTGOING
                                                                                                                       44Mbs
                                                                                                                      Average mobile
                                                                                               INTERNATIONAL
                                                                                                                         data usage
                                                                   OFFNET                         INCOMING            grows by 44MBs
                                                                                                                        per user Per
                                                                                                                           month
                                                                                  0.9
                                                                                  MINUTES

                                              1Q20                 2.3                           1.4
                                                                   MINUTES                       MINUTES

                                                             ONNET                                     MOBILE (MBs)

                                                              164                                          582
                                                              MINUTES                                      MBs

                                                                               INTERNATIONAL

                                                                                                                      154Mbs
                                                                                 OUTGOING

                                                                                               INTERNATIONAL           Average mobile
                                                                                                  INCOMING
                                                                   OFFNET                                                data usage
                                                                                                                      grows by154MBs
                                                                                                                        per user Per
                                                                                  0.8                                      month
                                                                                  MINUTES

                                              2Q20                   1.7
                                                                     MINUTES
                                                                                                 1.6
                                                                                                 MINUTES

                                                             ONNET                                    MOBILE (MBs)
3Q20

                                                              161                                          736
                                                              MINUTES                                      MBs

                                                                               INTERNATIONAL
                                                                                 OUTGOING                              11Mbs
                                                                                                                      Average mobile
UCC - Market Performance Report

                                                                                               INTERNATIONAL             data usage
                                                                   OFFNET                         INCOMING
                                                                                                                      grows by 11MBs
                                                                                                                        per user Per
                                                                                                                           month
                                                                                  0.8
                                                                                  MINUTES

                                              3Q20                   2.0                         1.6
                                                                     MINUTES                     MINUTES

                                                             ONNET                                    MOBILE (MBs)

                                                              160                                          747
   28                                                         MINUTES                                      MBs
9.     International Roaming

            The number of Ugandans roaming on foreign networks at the end of 3Q20 stood at 594,952.
            This represents an increase of 28,921 roamers as travel restrictions ease across the globe.

            The number of foreigners roaming on Ugandan networks stood at 763,573. This represents an
            increase of 119,650 roamers stemming once more from the increased freedom of movement
            globally during the quarter.

Visiting Customers vs. Ugandans Roaming in other Countries

              990,120
                                           873,987

                                                                                                  763,573

                                                      697,402
                       694,422
                                                                   643,923                                   594,952
                                                                              566,031

                  4Q19                         1Q20                        2Q20                         3Q20
                                             Inbound Roamers           Outbound Roamers

Distribution of Roamers (ONA vs. Rest of World)

 Roamers                                                        Roamers
                                           491,487
  500,000                                                        500,000
                            480,433
 480, 000                                                       480, 000

 460, 000                                                       460, 000

 440, 000                                                       440, 000
            442,904
 420, 000                                                       420, 000
                                                                                                                           3Q20
 400, 000                                                       400, 000                     390,863
 380, 000                                                       380, 000     377,695
 360, 000                                                       360, 000
                                                                                                            343,237
 340, 000                                                       340, 000

 320, 000                                                       320, 000

 300, 000                                                       300, 000
                                                                                                                           UCC - Market Performance Report

 280, 000                                       272,086         280, 000
                                 266,944
 260, 000                                                       260, 000                                         214,560
                  241,521                                                          241,149        240,677
 240, 000                                                       240, 000

 220, 000                                                       220, 000

 200, 000                                                       200, 000

  180,000                                                        180,000
              Jul-20          Aug-20         Sep-20                            Jul-20          Aug-20         Sep-20

                                                                                                                             29
10. OTT Services

                                          OTT subscriptions increased by more than 1 million cellular
                                          users, up from 11.3 million users in June 2020 to 12.4 million
                                          users accessing OTT services at least once in the month of          Monthly OTT
                                          September 2020.
                                                                                                            users increased
                                          This represents an OTT usage growth of 10% during the              by 1.1 million
                                          quarter.                                                           between 2Q20
                                          The new growth in OTT usage is largely driven by the 1.2
                                                                                                               and 3Q20
                                          million new data subscriptions. The bulk of newly connected
                                          gadgets now come with pre-installed OTT applications, hence
                                          driving OTT uptake.

                                                                   Active OTT subscriptions

                                                                        11.3M                              12.3M
                                              10.6M

                                             Mar 2020                   Jun 2020                       Sept 2020
3Q20
UCC - Market Performance Report

   30
Finance

     UCC - Market Performance Report   3Q20

31
11. Revenues

                                          Following the depressed performance of 2Q20, the
                                          industry posted a 15% recovery with 1.1 trillion in revenues
                                          realised in the three months July-September 2020.
                                                                                                              Shs 1.1 Trillion
                                          This sets a quarterly revenue record for the sector over               recorded
                                          the last 24 months outperforming the previous revenue
                                          record of 1.05 trillion recorded in 1Q20.                             in industry
                                                                                                                 revenues
                                          This recovery has been achieved largely on the back of
                                          rallying demand for Voice and Digital Financial Services,
                                          as well as what seems to be a new normalised level of
                                          demand for broadband services that is higher than pre-
                                          COVID levels.

                                  Quarterly Revenue Performance (UGX)
                                                                                                                  1.095
                                                                                                                  TRILLION

                                                                  1.048
                                                                  TRILLION

                                                                                           0.97
                                                                                          TRILLION
                                          0.94
                                          TRILLION

                                                       +12%                      -7%                     +15%
                                          4Q19                     1Q20                   2Q20                     3Q20
                                          These revenue lines include retail and input/wholesale revenues like Tower Lease sales,
                                          International Bandwidth, Mobile Financial Services as well as Voice and Data services.

                                           After a 16% drop in voice revenues posted during 2Q20 the segment rallied back with a 15%
                                           jump in revenues during the quarter 3Q20.

                                           Quarterly data revenues grew by only 3% between 2Q20 and 3Q20 despite the 1.8 million new
                                           data users. The comparatively slow growth in data usage is indicative of the fact that most new
3Q20

                                           subscriptions are largely marginal users with limited regular demand for broadband services.

                                           By far the greatest recovery was seen in the Mobile Money segment, which was particularly
                                           stunted due to the waivers of transaction fees during the height of COVID-associated restrictions.
                                           The sector posted a 36% increase in total revenues proportionate to 2Q20.
UCC - Market Performance Report

   32
12. International Interconnect Position

          Total industry monthly revenues from international incoming
          traffic have averaged 14.7 billion shillings in 3Q20, translating
          to an impressive 30% increase in average monthly revenues.

          Average outbound international interconnect settlements
          decreased by 12%, to a monthly average 6.7 billion shillings
          per month in 3Q20.

          During 3Q20, Uganda has posted a net international
          interconnect position of USD 6.5 million.
                                                                                 In 3Q20, Uganda posted
                                                                                  a net positive position
                                                                                     of USD 6.5 Million
International Interconnect Position

                                           18

                                           16

                                           14
                      Values in Billions

                                           12

                                           10                                 Interna�onal Interconnect
                                                                              Revenue
                                            8
                                                                              Interna�onal Interconnect
                                            6                                 Expense
                                            4

                                            2

                                            0
                                                Jul 20   Aug 20   Sep 20

                                                                                                            3Q20
                                                                                                            UCC - Market Performance Report

                                                                                                              33
UCC - Market Performance Report   3Q20

34
                                              Postal & Courier
13. Postal Services

Mail Volumes Processed (Ordinary Mail vs. Parcels, Registered and Other Courier
Articles)

                Outgoing post and courier items             Jul20           Aug 20          Sep 20
                TOTAL OUTGOING                              31,490          30,917           31,204
                Incoming post and courier items             Jul20           Aug 20          Sep 20
                TOTAL INCOMING                              24,618          25,810           19,869

            Total international outgoing post and courier traffic continued with a positive recovery averaging
            31,000 units during the months of July - September 2020. The recovery is synonymous with the
            gradual reopening of international airspace and global commerce.

            In the international outbound courier segment, Registered postal and courier items have
            continued to outgrow traditional or ordinary international
            mail accounting for 65% of total international outgoing courier traffic.

            International incoming post and courier traffic remains dominated by ordinary post. Posta
            Uganda the Designated Operator (DO) handles more than 65% of all incoming international
            mail and parcels. This despite ongoing global dialogue on proposed new postal terminal dues
            within the membership of the Universal Postal Union (UPU).

            The domestic post and courier market segment handled a combined total of 124,000 courier
            items during the period 3Q20. The market remains a Kampala centric market with more than
            60% of the domestic mail traffic processed through kampala clearing houses and collection
            points.

            In an effort to improve Carrier to Carrier business in the domestic postal segment, the UCC
                                                                                                                     3Q20

            along with the industry have concluded a review of potential business and regulatory models for
            interoperability within the domestic courier market. The assessment includes new proposals on:
            sharing of collection and drop points, treatment of liability by 3rd party carriers as well as pricing
            models for an inter-city Carrier of Carrier service.
                                                                                                                     UCC - Market Performance Report

        .

                                                                                                                       35
UCC - Market Performance Report   3Q20

36
                                              Markets
                                              Broadcast & Multimedia
14. TV Market

        SATELLITE                   DSTV           STAR                         TERRESTRIAL
             (Country wide)        ZUKU TV         TIMES          GOTV         Kampala, Jinja, Iganga, Mbale,
                                                                                 Lira, Gulu, Arua, Kasese,
                                   AZAM TV                                       Mbarara, Masaka,Wakiso

                                             KAMPALA SITI
                                                CABLE

                                                  CABLE
                                                (Kampala and Jinja)

        Total active pay TV subscriptions have contracted from 1.56 million accounts at the end of June
        2020 to 1.54 million active accounts. These are a combination of terrestrial, cable and satellite
        connections.

        The suppressed performance of the subscription TV market despite resumption of major sports
        leagues maybe attributed to:

        I.        Difficult economic climate: many consumers are financially constrained after having
                  been out of work for a significant period of time. Even with business activity restarting,
                  household pay tv subscriptions are not priority for household consumption considerations.

        II.       Shift to online/alternative entertainment: during the lockdown, the lack of work coupled
                  with the lack of funds to access entertainment services led to a fall in subscriptions but an
                  increase in internet subscription and usage.

        Online video-on-demand platforms such as Netflix and YouTube, as well as new local platforms
        like MTN’s YoTV and Airtel TV, were at the height of their popularity domestically, and it is
        possible that this demand has been sustained and captured a more permanent share of Pay-Tv
        subscribership.
                                                                                                                  3Q20
                                                                                                                  UCC - Market Performance Report

                                                                                                                    37
Active Pay TV Subscriptions

                                        +15%    1,686,269
                                                                                                      1,583,873          -6%
                                                           4Q19
                                                                                             1Q20
                                                                                                              1,556,514    -2%
                                           1,471,214
                                                                                                    2Q20
                                                       3Q19
                                                                                                                   1,524,589      -2%
                                                                                                        3Q20

                                  15. Programming

                                          Pay-Tv service providers deliver a range of content on their platforms and the number of channels
                                          on a network may vary slightly month to month.

                                                     149
                                                                132
                                                                                  129
3Q20

                                                                       108
                                                                                                        100
                                                                                             85                   45
UCC - Market Performance Report

                                         DSTV      SITI CABLE     AZAM TV     STARTIMES       STARTIMES        ZUKU TV     GOTV
                                                                               (SATELLITE)    (TERRESTRIAL)

                                     Bouquet Pricing

                                          Bouquet pricing is diverse, with Pay Tv providers offering packages targeted at various market
                                          segments. Subscriber numbers by and large vary heavily with price, indicating a high price
   38                                     sensitivity for Pay-Tv content.
Subscription Distribution Across Bouquet Categories

                                             Value Bouquet Prices
       Station                   Bouquet                    Price                        Channels
       DSTV                      Access                      UGX 35,000                  75
       SITI CABLE                Ugandan                     UGX 15,000
       AZAM TV                   Azam PURE                   UGX 10,000                  50
       STARTIMES (Satellite)     NOVA                        UGX 13,500                  38
       STARTIMES (Terrestrial)   NOVA                        UGX 12,000                  31
       ZUKU TV                   Smart                       UGX 12,000                  53
       GOTV                      GOTV Lite                   UGX 12,000                  20

                                           Premium Bouquet Prices
       Station                   Bouquet                    Price                        Channels
       DSTV                      Premium                     UGX 227,000                 140
       SITI CABLE                ASIAN                       UGX 85,000                  133
       AZAM TV                   Azam PLAY                   UGX 37,000                  105
       STARTIMES (Satellite)     Chinese                     UGX 80,000                  21
       STARTIMES (Terrestrial)   Classic                     UGX 28,000                  14
       ZUKU TV                   Asia Stand Alone            UGX 39,000                  29
       GOTV                      GOTV Max                    UGX 40,000                  52

                                                                                                    3Q20
                                                                                                    UCC - Market Performance Report

The tariff plans in the communications sector varies according to the market segments.
Comparative price plans may be accessed at the UCC Accredited Price Comparison
Website at;
www.kompare.ug
                                                                                                      39
UCC - Market Performance Report   3Q20

40
You can also read