Cannabis in Canada Valuation Approaches in an Evolving Market - Part 2 October 2020 - FTI Consulting
←
→
Page content transcription
If your browser does not render page correctly, please read the page content below
ARTICLE

Cannabis in Canada
Valuation Approaches in an Evolving Market – Part 2
October 2020

In June 2019, FTI Consulting published Part 1 of Cannabis: Valuation Approaches in an
Evolving Market, which explored legalization of cannabis for recreational use in Canada,
risk factors, and the range of complexities to consider for corporate valuations in the
emerging Canadian cannabis industry.

Introduction
Since our previous publication, a lot has changed from a regulatory perspective in the Canadian cannabis industry since the
Cannabis Act came into force in October 2018, whereby the Federal Government of Canada legalized the production and sale
of edible cannabis, cannabis extracts and cannabis topicals on 17 October 2019 (Cannabis 2.0).
Thus far, the developments in the Canadian cannabis industry have been far from expectation. The slow roll-out of licenses,
the glacial pace of brick-and-mortar store openings, a robust illicit market and the regulatory outlook of the Canadian
government have all posed a hurdle to the initial growth expectations of the market. In late 2019 and early 2020 the industry
was marked by layoffs, weak financial results, and executive departures.
Part 2 of our cannabis valuation in Canada series is a timely update to market events and trends that impact the valuation of
market actors in the Canadian cannabis industry.
CANNABIS IN CANADA: VALUATION APPROACHES IN AN EVOLVING MARKET – PART 2                                                                                        FTI Consulting, Inc. 02

Changes in the regulatory environment since                                                    Ontario retail licences
legalization                                                                                   In December 2019, the Ontario provincial government
The Canadian cannabis regulatory environment has                                               removed its lottery system of awarding retail store
experienced a number of changes since October 2018,                                            licences to an open licensing process. This included
with three key factors being: the introduction of Cannabis                                     removing the temporary cap on the number of private
2.0, facility licencing requirements, and Ontario retail                                       cannabis stores in the province and eliminating pre-
licensing arrangements.                                                                        qualification requirements for prospective retailers.3
                                                                                               This will provide greater access to market for producers
Cannabis 2.0
                                                                                               and facilitate sales growth in Ontario.
The most significant changes to the Canadian regulatory
environment were the amendments to the Cannabis Act as                                         Other
of October 17, 2019 with respect to rules governing the legal                                  The US Cannabis market continues to present substantial
production and sale of edible cannabis, cannabis extracts                                      cross-border investment opportunities to Canadian cannabis
and cannabis topicals. These new derivative products began                                     companies, primarily due to its size with respect to the
to appear in the market around mid-December 2019 and the                                       global market. Cannabis is now legal for both medical and
offering continues to develop during 2020.The Task Force                                       recreational use in 11 states and the District of Columbia for
on Cannabis Legalization and Regulation holds the view                                         adults over the age of 21 in the US. A further 22 states have
that the legal sale of these products will help achieve the                                    passed laws legalizing (or decriminalizing) cannabis for
Government’s objective of: i. displacing the illegal market;                                   medical use, and another six states allow Cannabidiol
and ii. keeping profits out of the hands of criminals and                                      (CBD) oil only.4
organised crime, by providing access to a broader range
of legal cannabis products.1 However, it is too early to                                       Recent market trends
determine if this will be successful.                                                          In contrast to initial expectations, Canadian cannabis
                                                                                               companies have underperformed since legalization. This is
Amendments to licence application criteria
                                                                                               demonstrated by the Canadian Cannabis LP Index5, which
From May 8, 2019, to improve application wait times                                            shows a significant decline from 1,193.56 on the date of
and ensure more efficient allocation of Health Canada’s                                        legalization on October 17, 2018 to 282.96 as at June 30, 2020.
resources, they required that new applicants for                                               The market index shows a continuing decline from April 2019.
cannabis licenses to cultivate, process or sell cannabis for
medical purposes have a fully built facility that meets all                                    Canadian Cannabis LP Index for last three years6
requirements of the Cannabis Regulations at the time of                                        As at the time of writing there were 216 companies listed in
their application, as well as satisfy other application criteria.                              Canada7 that offer products and/or services in the cannabis
This is expected to increase the barriers to entry for                                         industry. This includes many U.S. companies primarily because
start-ups and small to medium players that tend not to be                                      of legal and regulatory issues due to cannabis being illegal under
capital-intensive or ready to begin operations.2                                               federal law in the U.S. Of the 216 companies, 112 are classified as

1
    Government of Canada. What you need to know about Cannabis: Cannabis in Canada Get the facts. www.canada.ca, accessed July 15, 2020
2
    Statement from Health Canada on changes to cannabis licensing dated May 8, 2019. www.canada.ca, accessed July 15, 2020
3
    Attorney General: Ontario Opening Cannabis Retail Market. December 12, 2019. www.news.ontario.ca, accessed July 15, 2020
4
    DISA Global Solutions: Map of Marijuana legality by State. www.disa.com, accessed July 15, 2020
5
    New Cannabis Ventures.com. Canadian Cannabis LP Index. The Canadian Cannabis LP index reported by New Cannabis Ventures consists of companies licensed by Health
    Canada to cultivate, process or sell cannabis is equal-weighted at the time of the month-end rebalancing and included 35 companies as of 06/30/20 (based on information
    available as of 06/26). The index includes those companies that are listed in Canada that fully own at least one LP and where the LP is a substantial component of the overall
    business. In order to qualify, the share price must be at least C$0.20 unless revenue in the most recently reported quarter exceeded C$2.5 million
6
    New Cannabis Ventures.com. Canadian Cannabis LP Index. Accessed July 10, 2020
7
    Listed on either Canadian Securities Exchange, TSX Venture Exchange or Toronto Stock Exchange, per Capital IQ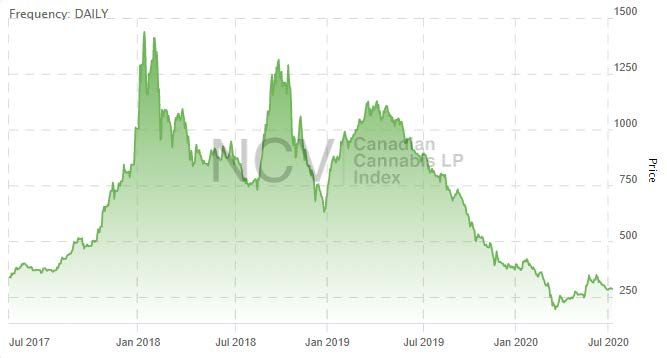
CANNABIS IN CANADA: VALUATION APPROACHES IN AN EVOLVING MARKET – PART 2                                                  FTI Consulting, Inc. 03

operating in the ‘botanical’ industry, and a further 49                    Largest Canadian-based Public Companies in the
identified from their business descriptions as producing                   Cannabis Industry by Market Capitalization9
or selling cannabis products. Accordingly, many of the                     Focusing on Canadian-based public companies, the market
remainder are companies that service the cannabis                          capitalization of the 15 largest companies has significantly
industry only (ancillary markets), for example supplying                   declined from the values reported as at June 2019 in our first
technology or R&D, finance or investment activities, real                  paper, as shown in the chart below.
estate, marketing, media, and security services.8

                                                             Market Capitalization ($M)
          Canopy Growth Corporation (TSX:WEED)
                      Cronos Group Inc. (TSX:CRON)
                     Aurora Cannabis Inc. (TSX:ACB)
                              Aphria Inc. (TSX:APHA)                                                             30 June 2020
                         Tilray, Inc. (NasdaqGS:TLRY)                                                            30 June 2019
                       TerrAscend Corp. (CNSX:TER)
                             HEXO Corp. (TSX:HEXO)
                 OrganiGram Holdings Inc. (TSX:OGI)
                 The Valens Company Inc. (TSX:VLNS)
                         Canopy Rivers Inc. (TSX:RIV)
             Auxly Cannabis Group Inc. (TSXV:XLY)
                   MediPharm Labs Corp. (TSX:LABS)
                         Aleafia Health Inc. (TSX:AH)
      Red White & Bloom Brands Inc. (CNSX:RWB)
        The Green Organic Dutchman (TSX:TGOD)

                                                        $0       $5,000            $10,000             $15,000                  $20,000

8
    Capital IQ
9
    Capital IQ
CANNABIS IN CANADA: VALUATION APPROACHES IN AN EVOLVING MARKET – PART 2 FTI Consulting, Inc. 04
Of the 15 companies with the highest market capitalization as was found to be growing cannabis in unlicensed rooms.16
at June 2020, their value has declined by approximately 65% This created uncertainty for market investors. CannTrust
since June 2019. This demonstrates the substantial change Holdings filed for creditor protection in 2020 and has since
in how the market is valuing cannabis companies. Since June had its licences reinstated and returned to full production.17
2019 four companies have fallen from the top 15 position,
As a result of the challenges faced as well as the changing
which include CannTrust Holdings Inc. who filed for creditor
landscape in the industry, the following trends have been
protection in 2020, and Origin House who were acquired and
observed:
subsequently delisted.10
— Changes in the C-Suite: The industry has seen a significant
Further, only three of the largest 15 market participants
change in the composition of boards and senior management
reported a positive EBITDA in the last twelve months (LTM),
at many of the larger players. As the companies grow and
which is a reminder that the industry is still in its infancy. A
market dynamics change, so does the skillsets required to
few of the issues that have plagued industry performance in
implement increasingly complex business plans.
Canada include:
— Supply chain: Despite a clear demand for Cannabis, — Asset write downs: Multiple large market players have
provincial governments have issued licenses and opened reported write downs over the last year. These arise for
brick-and-mortar stores at a glacial pace, contributing to various reasons such as over-valued inventories, closure of
excess supply issues in the market. greenhouses, and overstated intangible assets and goodwill
recorded on balance sheets from acquisitions. For example:
— Illicit market: In contrast to the intention of the
regulators, there continues to be a thriving illicit market for — Aurora Cannabis Inc. reported that it expects to
cannabis driven by the supply issues of the retail market. recognize a non-cash write-down of goodwill and
Statistics Canada reports that 52% of cannabis buyers intangible assets in the range of $1.6 to $1.8 billion in
purchase through legal sources.11 A large contributor to Q4 of 2020.18
this is the price sensitivity of cannabis consumers with the — Canopy Growth reported $582 million of
average selling price per gram in the black market being impairments related to PPE and intangible assets in
C$5.73, while in the legal adult-use market it averaged the year ended March 31, 2020.19
C$10.30 in the fourth quarter of 2019.12
— Insolvencies: Cracks were appearing in the industry
— Vaping illnesses: In 2019, there was a sharp rise in prior to the onset of COVID-19, with workforce layoffs,
respiratory illnesses linked to e-cigarettes and vaping.13 company restructurings, lacklustre financial results, and
This cast a cloud of uncertainty over these products in the executive departures in late 2019 and early 2020. At the
cannabis industry, dampening sales.14 time of writing, in 2020 seven listed entities had entered
— Compliance: In 2019, CannTrust Holdings, which was into an insolvency process in Canada.20 It is worthy of note
the eighth largest listed company in January 2019 by that US based cannabis companies do not have access to
market capitalization,15 had its licence suspended after it bankruptcy protection, reducing options for restructure in
10
Capital IQ
11
Statistics Canada: What has changed since cannabis was legalized? www150.statcan.gc.ca. Accessed July 15, 2020
12
Statistics Canada. Crowdsourced cannabis prices, fourth quarter 2019. www150.statcan.gc.ca. January 23, 2020
13
CDC Centers for Disease Control and Prevention: Outbreak of Lung Injury Associated with the Use of E-Cigarette, or Vaping, Products. www.cdc.gov. Accessed July 15, 2020
14
Bloomberg: Health Crisis Casts shadow Over Canadian Debut of Cannabis Vapes. September 22, 2019. www.bloomberg.ca and BNN Bloomberg: Canadian pot producers going full
bore on vaping despite health risks, competition. November 28, 2019. www.bnnbloomberg.ca
15
FTI Consulting: Cannabis: Valuation Approaches in an Evolving Market
16
Bloomberg: CannTrust’s Pot License Suspended Following Regulatory Breaches. September 17, 2019. www.bloomberg.ca
17
Press release: CannTrust Receives Notice from Health Canada of License Reinstatement for its Fenwick Facility. May 29, 2020. www.canntrust.com
18
Press release: Aurora Cannabis Provides Business Updates and Announces New CEO. September 8, 2020. www.investor.auroramj.com
19
Canopy Growth Corporation Financial Statements for the year ended March 31, 2020
20
www.Insolvency Insider.ca. Accessed July 15, 2020CANNABIS IN CANADA: VALUATION APPROACHES IN AN EVOLVING MARKET – PART 2 FTI Consulting, Inc. 05
the current environment where many businesses are under It is unclear whether COVID-19 may soften this growth
financial strain.21 Accordingly, businesses incorporated in expectation for the short to medium term, however our
Canada have an advantage in such circumstances. discussions with industry participants indicate that the
To date, the Canadian recreational cannabis industry has pandemic has not had a material impact on expected
not met the high expectations held by stakeholders and consumption, and appears to have remained a consumer
other market observers at legalization, with a number staple, similar to alcohol.
of contributing factors such as overly optimistic values, Some analysts revised their cannabis industry forecasts
acquisitions transacting at greater than fair market value, down with the onset of COVID-19. For example, one analyst
oversupply, ongoing losses and constraints in the provincial was expecting retail sales to be approximately $2.5 billion
retail distribution network. This has had an impact on the in 2020, down from a prior forecast of $3.4 billion.25 This
market values of industry participants, making business is far from estimates suggested at the time of legalization
valuations in this space an ongoing evolving process. of approximately $7 billion in recreational sales by 2020, as
reported in our first paper. However, COVID-19 may not have
Canadian market outlook substantially impacted the industry as initially feared, with
The Canadian cannabis market was anticipated to be many provinces declaring cannabis producers and retailers as
stimulated in 2020 by the launch of infused cannabis an essential business and allowing establishments to stay open,
edibles, extracts and topicals under Cannabis 2.0, as well as well as the federal government granting access to a number
as the opening of dozens of new stores in Ontario (the of financial support programs.26 Further, Health Canada
country's biggest consumer market) following the change in temporarily adjusted its approach to the administration
retail licensing legislation. and enforcement of the Cannabis Act and its regulations, to
At the introduction of Cannabis 2.0, it was estimated that assist the industry for issues such as licence amendments
the annual Canadian market for edibles and alternative and renewals, security clearances, allowances for site-related
cannabis products would be worth C$2.7 billion annually.22 activities and authorized persons.27
If US trends are replicated in Canada, edibles and extracts Pleasingly, sales data from Statistics Canada reports that legal
could form the fastest-growing segment of the cannabis retailers sold over $201 million worth of cannabis flower and
market as these product categories form over 50% of other cannabis products in June 2020. This is almost an 8%
sales in regions of the U.S. Derivative sales are expected to increase over the previous monthly record which was just set
improve the industry’s margins over the long term, being in May 2020, the month prior.28 Accordingly, the cannabis retail
higher-priced products that are more subject to quality industry appears to be weathering the COVID-19 storm.
and brand differentiation. This would offset the anticipated
Prior to the onset of COVID-19, the following market trends
commoditization of dried flowers that will reduce margins.23
were anticipated, with some possibly further exacerbated by
Prior to COVID-19 analysts expected that derivative sales
the pandemic:
could account for 50% of the total sales in the mature
recreational market and about 75% in the mature medical — price reductions due to oversupply in the market and
market by the year 2023/ 2024 respectively.24 competition with the illicit market;29
21
The U.S. Bankruptcy Code is Federal Law and cannabis remains a Schedule 1 narcotic under the Controlled Substances Act. Source: Why Marijuana Assets May Not Be
Administered in Bankruptcy. December 2017 www.justice.gov/ust/bankruptcy-articles
22
Deloitte: Nurturing new growth, Canada gets ready for Cannabis 2.0. www2.deloitte.com. Accessed July 15, 2020
23
Alta Corp Report, The Global Cannabis and Cannabinoid-derived Pharmaceutical Space: Top Picks and 2020 Outlook
24
Eight Capital Report Foresight 2020: The Stock Picker's Year in Cannabis. January 8, 2020
25
BNN Bloomberg: COVID-19 to weigh on Canadian pot sales growth in 2020, analysts say. April 27, 2020. www.bnnbloomberg.ca
26
McCarthy Tetrault: COVID-19: Impact on the Canadian cannabis Sector. April 24, 2020
27
StratCann: Health Canada offers updates on temporary measures for cannabis industry during COVID-19. June 25, 2020
28
Statistics Canada: Retail trade sales by province and territory (Table 20-10-0008-01)
29
Alta Corp Report, The Global Cannabis and Cannabinoid-derived Pharmaceutical Space: Top Picks and 2020 OutlookCANNABIS IN CANADA: VALUATION APPROACHES IN AN EVOLVING MARKET – PART 2 FTI Consulting, Inc. 06
— inventory write-downs and product returns as a result of Valuation concepts
distribution channels not keeping pace with production
In our previous paper we discussed approaches to value and
levels, causing oversupply;30
to use caution when considering market based multiples
— margins remaining under pressure with declining revenue where value is calculated by applying a multiple based on
per gram, as well as a high cash burn rate, with capital similar assets. Such multiples are an estimate of the market
expenditure remaining high;31 value of a business, as a function of key metrics that are
— continuing goodwill impairment given the reduction believed to drive value.
in market valuations across the cannabis sector, and
Implied Multiples for Canada’s Top 20 Largest
companies that plan to sell previously acquired assets to
Cannabis Companies
improve their capital position;32
Enterprise Value (EV) multiples for the 20 largest Canadian-
— further consolidation of market players that lack capital
based public companies in the cannabis industry for the last
resources or competitive advantage;33 and,
twelve months (LTM) June 2020 are presented in Schedule 1.
— continuing weak financial results for several more quarters.34 This data demonstrates that the use of multiples continues
to have inherent challenges given companies are in a growth
stage and generally remain unprofitable. In our last paper
the top 20 companies had significant variability of multiples
with EV/EBITDA as shown in the table below. As at LTM
June 2020, the range, whilst still very wide, has narrowed
somewhat since June 2019.
Implied multiples
LTM June LTM June
Multiple
2019 2020 *
Min -469x -22x
EV / LTM
Max 16x 754x
EBITDA
Average -49x 9x
Low 12x 1x
EV / LTM
High 657x 305x
Revenue
Average 61x 8x
*EV values as at June 2020, however the majority of available financial information is
reported as at 31 March 2020
Source: Capital IQ
30
Alta Corp Report, The Global Cannabis and Cannabinoid-derived Pharmaceutical Space: Top Picks and 2020 Outlook
31
Alta Corp Report, The Global Cannabis and Cannabinoid-derived Pharmaceutical Space: Top Picks and 2020 Outlook
32
Alta Corp Report, The Global Cannabis and Cannabinoid-derived Pharmaceutical Space: Top Picks and 2020 Outlook
33
Eight Capital Report Foresight 2020: The Stock Picker's Year in Cannabis. January 8, 2020
34
Alta Corp Report, The Global Cannabis and Cannabinoid-derived Pharmaceutical Space: Top Picks and 2020 OutlookCANNABIS IN CANADA: VALUATION APPROACHES IN AN EVOLVING MARKET – PART 2 FTI Consulting, Inc. 07
The majority of the top 20 companies by market market capitalization. When comparing those statistics
capitalization in Schedule 1 are involved in the cultivation, to current forecasts for 2022 in Schedule 2, a significant
production and distribution of cannabis products. Three of reduction in expected trading results is apparent. Average
the four profitable companies in this group focus on either forecast revenue for 2022 (where forecast information
the medical market (Aphria Inc. and Alefia Health Inc.) or is available) has declined by almost 50% across this
production, research and testing (not cultivation) (The group of companies, and the highest revenue forecast
Valens company Inc.). This highlights the importance of (reported by Canopy Growth) has declined from $1.9
comparing companies with similar assets and operations billion to $1.2 billion.
when using multiples as a guide for valuation purposes. Forecasts show that 13 of the 14 companies (or 93%) with
In our last paper, we discussed using forward looking readily available information expect to turn a profit by
multiples in the cannabis valuation, which is based on 2022, compared to only 20% reported as at March 2020.
a company’s forecast earnings. We identified forecasts Accordingly, industry players are expecting a substantial
for 2022 for only half of the then top 20 companies by turnaround in performance in the next two years.
Top 20 by Market Capitalization: 2022 Forecast LTM June 2020 EBITDA
LTM June 2019 LTM June 2020
$2,500
20%
$2,000 $1,913
$1,500
$1,221
$1,000
80%
$800
$500 $405
$241
$69
$0
Average Average Max Number of profitable top 20 companies
EBITDA Revenue Revenue Number of unprofitable top 20 companies
Top 5 by Market Capitalization: 2022 Forecast (2019 vs. 2020) 2022 Forecast EBITDA
2022 EBITDA Forecast - June 2019 2022 EBITDA Forecast - June 2020
2022 Revenue Forecast - June 2019 2022 Revenue Forecast - June 2020
EBITDA Revenue
7%
$500 $2,000
$400
$1,500
$300
$1,000
$200 93%
$500
$100
$0 $0
Canopy Cronos Aurora Aphria Inc. HEXO Corp. Number of profitable top 20 companies
Growth Corp. Group Inc. Cannabis Inc. (TSX:APHA) (TSX:HEXO)
Number of unprofitable top 20 companies
(TSX:WEED) (TSX:CRON) (TSX:ACB)
Source: Capital IQCANNABIS IN CANADA: VALUATION APPROACHES IN AN EVOLVING MARKET – PART 2 FTI Consulting, Inc. 08
Market-Based Approach – Precedent Transactions However, transaction sizes will be much reduced from that
seen around the time of legalization, with more focus on
M&A activity in the Canadian cannabis industry continues
strategic acquisitions of companies that are successful in
with companies pursuing growth strategies via acquisition
specific market segments.
to achieve increased scale, market share and global reach,
expansion along the value chain, and/or vertical integration. Schedule 3 contains Canada’s largest M&A transactions
Since October 2018, there have been over 800 M&A or private and investments in the Cannabis industry since January
placement transactions announced or closed involving a 2019. The implied multiples are somewhat limited due to
Canadian based cannabis business or cannabis ancillary unavailable information regarding the financials of the
business, totalling over $15 billion in value. Approximately target company. Our first paper reported some sizeable
52% of these occurred in the first nine months since transactions in 2018, with the top four largest having
legalization and remaining 48% in the year to June 2020. transaction values exceeding $1.5 billion, and the largest
The average transaction price has been declining over time being a private placement by Constellation Brands Inc (an
from $37.1 million in Q4 of 2018 compared to $6.8 million in American producer and marketer of beer, wine and spirits)
H1 of 2020, which is consistent with declining asset values for 28% of Canopy Growth Corporation in November 2018.
discussed earlier in this paper. Schedule 3 shows that the largest industry transaction since
January 2019 is for only $487 million for the acquisition of
Number and average value of transactions in
Origin House by Cresco Labs Inc.
Canadian cannabis and ancillary industries
Canopy Growth has been one of the most active investors
350 $40
$35
in this space since January 2019, with nine transactions
300
250 $30 announced at the time of writing. These have a combined
$25 transaction value of approximately $710 million, the largest
200
$20
150
$15
at $340 million for the acquisition of C3 Cannabinoid
100 $10 Compound Company GmbH from Germany.
50 $5
0 $0 Other Valuation Metrics and Considerations
Q4 2018 H1 2019 H2 2019 H1 2020
As discussed above, many companies in the industry are
Number of transactions Av. Transaction value ($M)
still loss making and therefore valuation metrics based on
Source: Capital IQ
earnings currently remain less meaningful. Whilst forward
A diminishing number of M&A transactions is observed looking earnings multiples may be considered, there is still
in the botanicals space (excluding ancillary industries), uncertainty around the reliability of the forecasts.
with 53 transactions announced or closed in the first half Given that earnings multiples are not yet meaningful for
of 2019 compared to 34 transactions in H2 of 2019 and valuation in an industry in its infancy, market participants and
27 in H1 of 2020.35 Prior to the onset of COVID-19 analysts analysts often consider other metrics, such as,
forecast that future M&A activity was likely to serve as
— Production capacity or canopy area
a survival mechanism for licensed producers that lack
— Operating cost per metre or square foot
capital resources or a distinct competitive advantage as
the industry continues to consolidate.36 Our discussions — Revenue per measurable unit
with industry participants confirmed that M&A activity — Cash cost of sales per gram or pound
will continue to be prominent in the industry, despite The implication is that these metrics drive future revenues
access to capital becoming constrained in 2019 due to an and/or cash flows. However, each of these have their own
oversaturated market in Canada (with over 800 licences challenges in providing comparability. For example, production
issued by Health Canada) as well as falling market values. capacity or canopy area does not necessarily translate
35
Capital IQ
36
Eight Capital Report Foresight 2020: The Stock Picker's Year in Cannabis. January 8, 2020CANNABIS IN CANADA: VALUATION APPROACHES IN AN EVOLVING MARKET – PART 2 FTI Consulting, Inc. 09
directly to revenues and cash flows in a market that is execute these plans which are often complex, particularly in a
experiencing over supply. In general, without considering the new and rapidly changing industry. This need is demonstrated
appropriateness of doing so, the application of a standardized by the changes the industry has seen in the C-Suite of many
methodology across companies may prove challenging and market participants, discussed earlier.
result in unreliable values. Discussions with industry participants indicate that those
Revenue, a common metric relied on by investors and other factors that are key to the success of a Canadian cannabis
stakeholders, should also be carefully considered. In the company in an industry that is currently oversaturated are to:
cannabis industry, revenue sources are not necessarily identical, — Build market share in Canada by increasing brand recognition
so when analyzing revenue it is important to consider the source through sales to the provincial buyers. Due to strict
of that revenue, and how it may impact the value of the entity. regulations regarding packaging and advertising, building
The industry is seeing increasing diversification by market brand awareness in Canada is a challenging task; and
participants, which in turn means that revenue sources may
— Pair back operating expenditure to reduce losses, with many
be one or a combination of many sources that may include
companies over investing in the past in the race to gain
products or services that are outside of standard cannabis
critical mass.
cultivation, processing or sale. Further, licensed producers
generate cannabis revenue in a range of ways such as supply Conclusion
to the provinces for recreational sales, medical cannabis, The Canadian cannabis industry continues to evolve given
international medical cannabis, retail sales through owned the early stage of its lifecycle, the changing regulatory
stores, as well as wholesale sales to other licensed producers. landscape with the introduction of Cannabis 2.0 and shifting
For example: industry fundamentals such as the retail landscape. To
— Aphria Inc: A significant proportions of its revenue is date, the advancement of the industry has been far from
distribution related from the acquisition of other companies37 expectation, with the slow roll-out of licenses, protracted
— Canopy Growth: Revenue includes owned retail stores, and retail store openings and a robust illicit market.
range of derivative products, such as skin care38 At the time of legalization, many industry participants
— Tilray: Revenue comprises a substantial amount of non- had very high valuations driven by market sentiment
cannabis revenue, including that from its acquisition of a and long- term growth potential. However, with ongoing
Hemp food provider.39 unprofitability (which is not unexpected for an early stage
industry) and muted forecasts, market sentiment has
Accordingly, when valuing a cannabis company, it may be
declined. This underperformance compared with initial
relevant to split it into segments to address the different risk
expectations has resulted in a staggering decline of publicly
profiles and expected growth rates of each. As explained
listed market participants’ market capitalization. This,
in our first paper, an income based approach, such as a
combined with continuing financial losses across most of
discounted cash flow (DCF) methodology allows a business
the industry, means that some traditional valuation metrics
valuator to apply a build-up approach when determining a
such as profitability multiples may continue to be unreliable.
discount rate, which can incorporate a variety of risk premia
Accordingly, the DCF (depending on the stage in the lifecycle),
to reflect different risk factors.
currently remains a relevant approach to valuation in the
Importantly, there are other non-financial considerations Canadian cannabis industry, together with a comprehensive
in a valuation, as discussed in our first paper, including review of the subject company’s business fundamentals
management’s capabilities. An experienced management such as its business plan, evidence of cash resource and
team is critical to a company’s success as not only do they infrastructure to implement such business plans, assets, and
set the overall strategic direction, but also require the skill to importantly, management capability.
37
2019 Aphria Inc. Annual Report. www.aphriainc.com
38
Canopy Growth FY2020 Q4 and Full Year Earnings Presentation. www.canopygrowth.com
39
www.nasdaq.com Tilray Posts Huge Revenue Growth-and a Huge Loss – in Q4. March 2, 2020CANNABIS IN CANADA: VALUATION APPROACHES IN AN EVOLVING MARKET – PART 2 FTI Consulting, Inc. 10
Schedule 1: Implied Multiples for Canada’s Top 20 Largest Cannabis Companies
Company Financials Implied Multiples Implied Multiples
June 2020 ($ millions) June 2020 June 2019
Market Enterprise LTM LTM EV/ LTM EV/ LTM EV/ LTM EV/ LTM
Company
Cap Value (EV) EBITDA Revenue EBITDA Revenue EBITDA Revenue
1 Canopy Growth Corporation (TSX:WEED) 7,714.9 6,648.0 (752.3) 398.8 (8.8) 16.7 (36.7) 98.3
2 Cronos Group Inc. (TSX:CRON) 2,853.7 975.1 (212.9) 41.4 (4.6) 23.6 (331.8) 254.0
3 Aurora Cannabis Inc. (TSX:ACB) 1,901.5 2,232.3 (232.0) 305.7 (9.6) 7.3 (50.3) 61.6
4 Aphria Inc. (TSX:APHA) 1,665.6 1,662.6 44.5 518.7 37.4 3.2 (50.1) 19.0
5 Tilray, Inc. (NasdaqGS:TLRY) 1,207.6 1,636.5 (291.9) 254.4 (5.6) 6.4 (57.2) 71.4
6 TerrAscend Corp. (CNSX:TER) 440.1 538.2 (33.5) 105.1 (16.1) 5.1 (17.5) 26.6
7 HEXO Corp. (TSX:HEXO) 425.8 440.5 (164.3) 69.1 (2.7) 6.4 (57.8) 55.7
8 OrganiGram Holdings Inc. (TSX:OGI) 372.5 418.6 (30.2) 89.4 (13.9) 4.7 16.2 30.3
9 The Valens Company Inc. (TSX:VLNS) 306.6 265.2 28.5 87.9 9.3 3.0 (30.0) 187.6
10 Canopy Rivers Inc. (TSX:RIV) 210.5 164.5 (7.4) 12.2 (22.4) 13.5 N/A 11.8
11 Auxly Cannabis Group Inc. (TSXV:XLY) 186.1 254.1 (55.5) 17.4 (4.6) 14.6 (9.0) 41.6
12 MediPharm Labs Corp. (TSX:LABS) 156.7 145.0 (11.6) 118.4 (12.5) 1.2 (469.4) 18.6
13 Aleafia Health Inc. (TSX:AH) 148.9 167.4 0.2 29.4 754.1 5.7 (9.1) 69.0
14 Red White & Bloom Brands Inc. (CNSX:RWB) 146.1 121.7 - - - - N/A N/A
15 The Green Organic Dutchman (TSX:TGOD) 140.4 163.3 (63.9) 11.5 (2.6) 14.2 (15.5) 176.0
16 XPhyto Therapeutics Corp. (CNSX:XPHY) 140.0 140.8 (9.6) 0.5 (14.6) 300.2 N/A N/A
17 Ignite International Brands, Ltd. (CNSX:BILZ) 125.8 137.9 (46.8) 9.7 (2.9) 14.3 N/A N/A
18 Rubicon Organics Inc. (CNSX:ROMJ) 125.3 138.5 (8.7) 0.5 (15.9) 305.1 (9.3) 71.1
19 Flower One Holdings Inc. (CNSX:FONE) 119.0 245.3 11.9 12.3 20.6 19.9 N/A 657.0
20 Sundial Growers Inc. (NasdaqGS:SNDL) 116.7 280.2 (57.8) 97.4 (4.8) 2.9 N/A N/A
Average (8.8) 7.6 (48.9) 61.0
Min (22.4) 1.2 (469.4) 11.8
Max 754.1 305.1 16.2 657.0
Source: Capital IQ and FTI Consulting calculations
Note: LTM financial information available as at the time of preparation of this paper was primarily as at March 2020. However, there are also some instances of months after and
prior, depending on the reporting period of the entity. EV and market capitalization data is as at June 30, 2020CANNABIS IN CANADA: VALUATION APPROACHES IN AN EVOLVING MARKET – PART 2 FTI Consulting, Inc. 11
Schedule 2: Implied Forward Multiples for Canada’s Top 20 Largest Cannabis Companies
Company Financials Implied Multiples Implied Multiples
June 2020 ($ millions) June 2020 June 2019
2022 2022 EV/2022 EV/2022 EV/2022 EV/2022
Market Enterprise
Company Forecast Forecast Forecast Forecast Forecast Forecast
Cap Value (EV)
EBITDA Revenue EBITDA Revenue EBITDA Revenue
1 Canopy Growth Corporation (TSX:WEED) 7,714.9 6,648.0 193.8 1,220.9 34.3 5.4 30.2 8.0
2 Cronos Group Inc. (TSX:CRON) 2,853.7 975.1 (3.1) 287.4 (310.5) 3.4 26.2 10.5
3 Aurora Cannabis Inc. (TSX:ACB) 1,901.5 2,232.3 133.8 625.3 16.7 3.6 19.4 6.0
4 Aphria Inc. (TSX:APHA) 1,665.6 1,662.6 127.9 832.8 13.0 2.0 5.4 1.6
5 Tilray, Inc. (NasdaqGS:TLRY) 1,207.6 1,636.5 101.0 579.9 16.2 2.8 N/A N/A
6 TerrAscend Corp. (CNSX:TER) 440.1 538.2 115.7 452.0 4.7 1.2 N/A N/A
7 HEXO Corp. (TSX:HEXO) 425.8 440.5 30.3 220.7 14.5 2.0 17.1 3.8
8 OrganiGram Holdings Inc. (TSX:OGI) 372.5 418.6 41.2 172.0 10.2 2.4 11.1 3.7
9 The Valens Company Inc. (TSX:VLNS) 306.6 265.2 61.0 238.1 4.3 1.1 4.2 2.1
10 Canopy Rivers Inc. (TSX:RIV) 210.5 164.5 - - - - N/A N/A
11 Auxly Cannabis Group Inc. (TSXV:XLY) 186.1 254.1 12.5 132.6 20.3 1.9 3.1 0.9
12 MediPharm Labs Corp. (TSX:LABS) 156.7 145.0 57.3 187.7 2.5 0.8 N/A N/A
13 Aleafia Health Inc. (TSX:AH) 148.9 167.4 38.9 177.6 4.3 0.9 N/A N/A
14 Red White & Bloom Brands Inc. (CNSX:RWB) 146.1 121.7 - - - - N/A N/A
15 The Green Organic Dutchman (TSX:TGOD) 140.4 163.3 27.9 - 5.9 - N/A N/A
16 XPhyto Therapeutics Corp. (CNSX:XPHY) 140.0 140.8 - - - - N/A N/A
17 Ignite International Brands, Ltd. (CNSX:BILZ) 125.8 137.9 - - - - N/A N/A
18 Rubicon Organics Inc. (CNSX:ROMJ) 125.3 138.5 25.2 - 5.5 - N/A N/A
19 Flower One Holdings Inc. (CNSX:FONE) 119.0 245.3 - 143.6 - 1.7 N/A N/A
20 Sundial Growers Inc. (NasdaqGS:SNDL) 116.7 280.2 - - - - N/A N/A
Average 16.3 3.0 17.5 5.2
Min (310.5) 0.8 3.1 0.9
Max 34.3 5.4 30.2 10.5
Source: Capital IQ and FTI Consulting calculationsCANNABIS IN CANADA: VALUATION APPROACHES IN AN EVOLVING MARKET – PART 2 FTI Consulting, Inc. 12
Schedule 3: Implied Multiples for Canada’s Largest M&A Transactions and Investments in the Cannabis Industry
Implied Multiples Implied Multiples
June 2020 June 2019
Target
Announcement % Transaction Implied Target LTM Implied EV/ Implied EV/
Company Target Transaction Type LTM
Date Acquired value EV Revenue EBITDA LTM Revenue
EBITDA
1 Cresco Labs Inc. (CNSX:CL) Origin House 4/1/2019 Merger/Acquisition 100% 487.3 487.3 (51.9) 63.2 (9.4) 7.7
Aurora Cannabis Inc.
2 Undisclosed 1/16/2019 Private Placement N/A 460.4 N/A (188.5) 119.1 N/A N/A
(TSX:ACB)
3 Tilray, Inc. (NasdaqGS:TLRY) Fresh Hemp Foods Ltd. 2/20/2019 Merger/Acquisition 100% 414.1 414.1 (67.2) 87.4 (6.2) 4.7
Canopy Growth Corp. C3 - Cannabionoid
4 5/2/2019 Merger/Acquisition 100% 340.2 340.2 - 40.8 N/A 8.3
(TSX:WEED) Compound Co. GmbH
5 TerrAscend Corp. (CNSX:TER) Ilera Healthcare 8/2/2019 Merger/Acquisition 100% 296.1 296.1 - - N/A N/A
6 HEXO Corp. (TSX:HEXO) Newstrike Brands Ltd. 3/13/2019 Merger/Acquisition 100% 263.7 263.7 (30.0) 8.1 (8.8) 32.7
The Flowr Corporation
7 Holigen Limited 6/24/2019 Merger/Acquisition 80% 244.9 305.4 - - N/A N/A
(TSXV:FLWR)
Neptune Wellness Solutions Assets of SugarLeaf Labs
8 5/9/2019 Merger/Acquisition 100% 202.5 202.5 - - N/A N/A
Inc. (TSX:NEPT) & Forest Remedies LLC
AgraFlora Organics Assets of Organic Flower
9 5/23/2019 Merger/Acquisition 100% 181.0 181.0 - - N/A N/A
International Inc. (CNSX:AGRA) Investments Group Inc.
Aurora Cannabis Inc. Whistler Medical
10 1/14/2019 Merger/Acquisition 100% 155.8 155.8 - - N/A N/A
(TSX:ACB) Marijuana Corporation
Canopy Growth Corporation
11 KeyLeaf Life Sciences 2/14/2019 Merger/Acquisition 100% 129.0 129.0 - - N/A N/A
(TSX:WEED)
Imperial Brands PLC Auxly Cannabis Group
12 7/25/2019 Private Placement 20% 122.9 614.3 (46.2) 11.0 (13.3) 55.9
(LSE:IMB) Inc. (TSXV:XLY)
13 Aurora Cannabis Inc. (TSX:ACB) Reliva, LLC 5/20/2020 Merger/Acquisition 100% 113.1 113.1 - - N/A N/A
14 High Park Holdings Ltd. 420 Investments Ltd. 8/29/2019 Merger/Acquisition 100% 110.0 110.0 - - N/A N/A
Cronos Growing
15 Cronos Group Inc. (TSX:CRON) 8/23/2019 Private Placement N/A 100.0 N/A - - N/A N/A
Company Inc.
Bridge Farm Nurseries
16 Artemis Growth Partners LLC 5/15/2020 Merger/Acquisition 100% 90.0 90.0 - - N/A N/A
Limited
17 WeedMD Inc. (TSXV:WMD) Starseed Holdings Inc. 11/29/2019 Merger/Acquisition 100% 84.0 84.0 - - N/A N/A
18 Canopy Growth Corp. (TSX:WEED) Solace Health Inc 3/11/2020 Private Placement N/A 80.5 N/A - - N/A N/A
19 Canopy Growth Corp. (TSX:WEED) TWP UK Holdings Ltd. 5/22/2019 Merger/Acquisition 100% 71.5 71.5 - - N/A N/A
20 Undisclosed HEXO Corp. (TSX:HEXO) 10/23/2019 Private Placement N/A 70.0 N/A (84.5) 47.5 N/A N/A
Average (9.1) 10.1
Min (13.3) 4.7
Max (6.2) 55.9
Source: Capital IQ and FTI Consulting calculations
The views expressed herein are those of the author(s) and not necessarily the views of FTI Consulting, Inc., its management, its subsidiaries, its affiliates, or its
other professionals. FTI Consulting, Inc., including its subsidiaries and affiliates, is a consulting firm and is not a certified public accounting firm or a law firm.
NEAL MIZRAHI NATALIE QUINN JASON KIM
Senior Managing Director Senior Director Senior Consultant
+1 416 649 8067 +1 604 757 6109 +1 416 649 8117
neal.mizrahi@fticonsulting.com natalie.quinn@fticonsulting.com jason.kim@fticonsulting.com
FTI Consulting is an independent global business advisory firm dedicated to helping organizations manage change, mitigate
risk and resolve disputes: financial, legal, operational, political & regulatory, reputational and transactional. FTI Consulting
professionals, located in all major business centers throughout the world, work closely with clients to anticipate, illuminate and
overcome complex business challenges and opportunities. ©2020 FTI Consulting, Inc. All rights reserved. www.fticonsulting.com
10082020 | VN01024-v08 Econ Canada - CannabisYou can also read