Market Reactions to COVID-19 - A review of Q1 2020 as seen in the CME Market Sentiment Meter - 1QBit
←
→
Page content transcription
If your browser does not render page correctly, please read the page content below
Market Reactions
to COVID-19
A review of Q1 2020 as seen in the CME
Market Sentiment Meter
White Paper

Market Reactions to COVID-19
A review of Q1 2020 as seen in the CME Market Sentiment Meter
Anish R. Verma, Andrew Milne

Abstract
The COVID-19 pandemic had a notable effect on the eight futures and options products tracked by 1QBit’s CME Market
Sentiment Meter. In some markets, such as U.S. equity index futures and U.S. interest rate futures, there were rapid
increases in daily futures volumes as prices changed, and traders managed their evolving risk. The peaks in daily volume
were followed by diminishments that varied from market to market, as well as changes in the volumes and positions
observed in the corresponding options markets. The CME Market Sentiment Meter reported transitions from the
Balanced state to the Anxious state in all products except soybeans and natural gas. The Anxious state is associated with
an expectation of larger price movements, which were observed in the markets. In addition, it was seen that
forward-looking activity moved from futures to options at a different rate for each product, and that market sentiments
took time to become established.
Keywords: Market Sentiment Meter, Computational Finance, COVID-19, Coronavirus

1 Introduction
The central premise of 1QBit’s CME Market Sentiment Meter (MSM) is that options prices and volumes reflect the
aggregate sentiments of traders. In the first quarter of 2020, the MSM indicated a shift from the Balanced market state
to the Anxious market state in all of its tracked products, except for soybeans and natural gas. There are four possible
MSM market states: Complacent, Balanced, Anxious, and Conflicted. A description of the states and their
interpretation is given in the Appendix A.

The MSM is computed daily for the following products, which are traded on the four Designated Contract Markets of
the CME Group (NYMEX, COMEX, CBOT and CME):

     • CBOT Corn futures (C1 ) and options

     • NYMEX WTI Crude Oil futures (CL) and options

     • CME Euro/USD FX futures (EC) and options

     • CME S&P 500® Index E-Mini futures (ES) and options

     • COMEX Gold futures (GC) and options

     • NYMEX Henry Hub Natural Gas futures (NG) and options

     • CBOT Soybean futures (S) and options

     • CBOT 10-Year Treasury Note futures (TYF) and options
    1 The   CME DataMine product codes are used in this work. See Appendix B.

1                                                                                        ©2020 1QB Information Technologies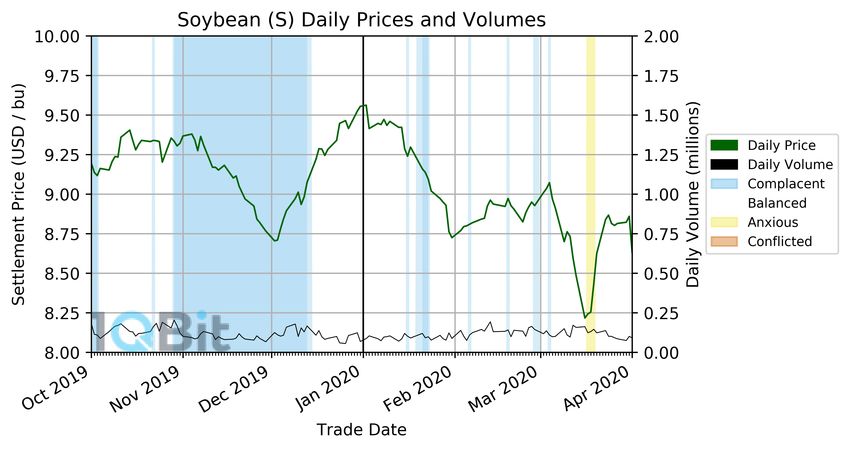
In the first quarter of 2020, all products tracked by the MSM were affected by the spread of COVID-19. Every day, it
seemed, there was news of infection spreading to new locations, and of countermeasures being taken by governments
[1]. Many of these countermeasures involved lockdowns, in which people were asked – and later ordered – to stay home.
Large events were canceled. Travel was cut back. Businesses were closed. Workers were laid off. Households stocked up
on food and other necessities. Governments began to spend more on medical supplies and public assistance in general.

Broadly speaking, as news came to the different futures markets, traders initially responded by adjusting their positions
in the futures contracts themselves. Figure 1 shows the prices and daily volumes for all eight MSM products for the last
quarter of 2019 and the first quarter of 2020. The volume in ten-year treasury note futures, for example, rose sharply
to nearly five times its value at the start of the year. Yet within six weeks this increase had largely subsided. The traders
went back to managing their risk with options, but at prices which implied that further moves were likely. The sentiment
state in most markets went to Anxious and stayed there through to the end of the quarter.

This, however, is to paint the picture with a broad brush. There are differences between each market, and in looking at
the COVID-19 timeline, important subtleties begin to emerge. There was also a weekend (February 29th to March 1st
2020) when most of the MSM-tracked markets moved gently in unison, and after which their price movements became
perceptibly larger. This makes March 1st a convenient point of reference.

2 The Beginnings of COVID-19
The year began with several political events that had impact on world markets. One example was the assassination of
Qasem Soleimani – an Iranian major general in the Islamic Revolutionary Guard Corps – by means of a U.S. drone strike
[2]. There were also events from past years which continued to resonate, such as the UK parliament voting to pass the
Withdrawal Agreement Bill [3], which authorized the country’s departure from the European Union at the end of
January.

All these, however, were soon overshadowed by COVID-19 and its rapid proliferation throughout the world.

Based on what we know at the time of writing [1], the first report of COVID-19 symptoms was made on December 8th ,
2019 in Wuhan, China. It was not until January 8th 2020, however, that scientists in China reported the discovery of the
novel coronavirus 2019-nCoV. The first death in China from 2019-nCov was reported shortly afterward on January 9th .

The first case of 2019-nCoV outside of China was reported on January 13th 2020 in Thailand. The first case in the United
States was reported on January 20th 2020.

There is a difference between news being reported and news having an effect. There have been other infectious diseases
in recent history, such as the Severe Acute Respiratory Syndrome (SARS) in 2003, the Middle East Respiratory
Syndrome (MERS) in 2012-2014, and Ebola, present for some time but with a recent outbreak in 2014. All were serious,
but ultimately had little economic effect [4]. News about the coronavirus was was inevitably seen against this backdrop
of past events.

By January 23rd 2020, China had blocked travel in and out of Wuhan. By January 30th , the World Health Organization
(WHO) had declared that the disease represented a ‘‘Public Health Emergency of International Concern’’, and had given
it its name (COVID-19). On January 31st , the United States Executive Branch announced a partial ban on travel between
the United States and China. Evidently, this was different from what had occurred in past outbreaks.

We should note here that the products tracked by the CME Market Sentiment Meter are U.S. commodities traded on
U.S. exchanges. However, in 2019 – the latest year for which we have statistics – roughly one out of every four CME
Group trades was from a customer outside the United States. The percentage of international business done at the CME
Group increases every year [5]. Equity index futures and treasury note futures in particular have grown rapidly.

International trading creates a feedback loop. Price discovery in U.S. regulated markets is visible to every trader in the
world, but not every trader is awake and working at the same time. Approximately one third of the gold trading on
COMEX takes place electronically during ‘‘Asia hours’’ [6]. An increased demand for gold futures in Asia will show up in
U.S. prices. The action taking place in ‘‘U.S hours’’ will be seen later (and reacted to) by Asian traders. Each product has
its own forms of feedback, and these affect the rates at which information flows from one part of the world to another.

2                                                                                           ©2020 1QB Information Technologies
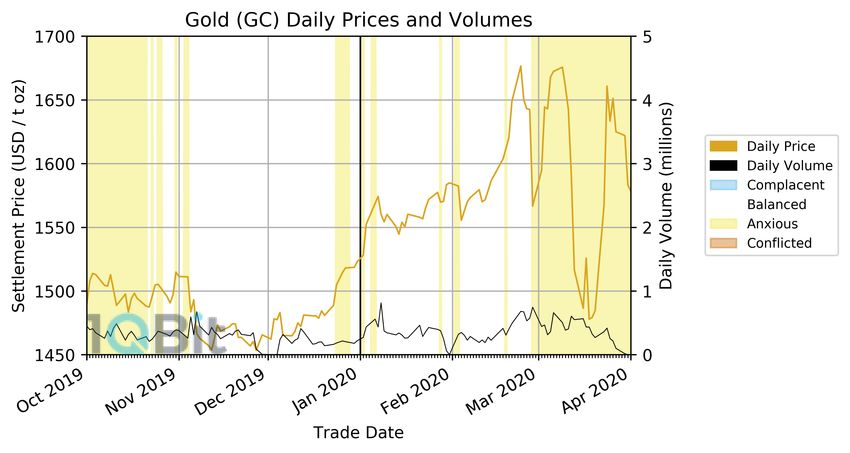
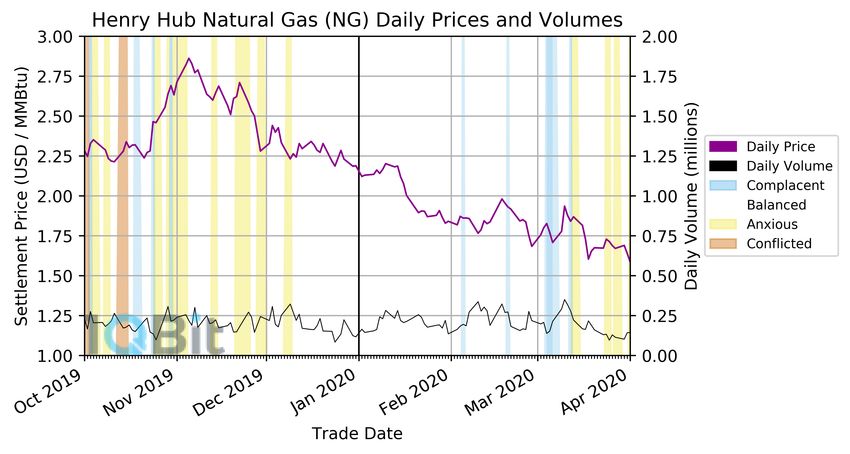
Figure 1: Settlement Prices and Volumes. Plotted are the settlement prices and volumes for the futures products (most active expiry) tracked by the
          MSM. Regions where the MSM is Complacent (Blue), Balanced (White), Anxious (Yellow), and Conflicted (Red) are highlighted.

3                                                                                                           ©2020 1QB Information Technologies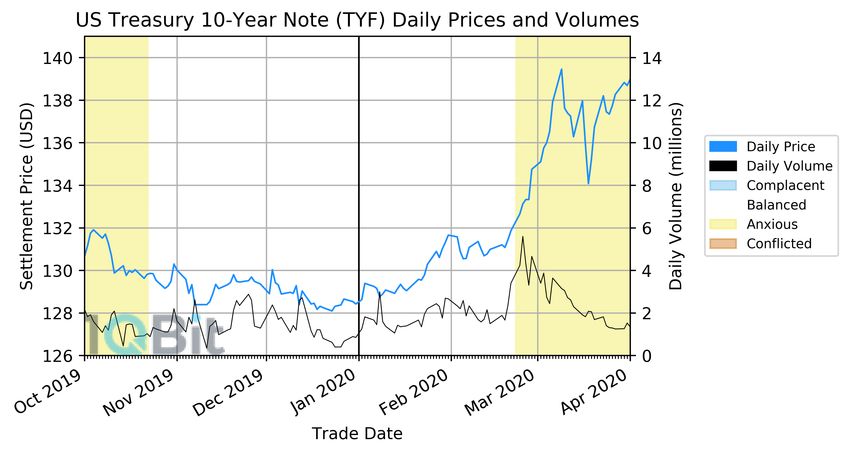
Figure 2: Q1 2020 Relative Price Movements. Plotted here are the settlement prices for selected futures products (most active expiry) relative to
          January 2nd 2020. It is evident that not all markets changed in exactly the same way, with some products falling less rapidly than others and
          with other products rising.

Thus, although the U.S. Federal Government was slower in responding to COVID-19 than governments in other parts of
the world, the impact on markets was already being felt.

Figure 2 shows the prices of the CME MSM products plotted on a common vertical scale (the values are indexed to the
start of the year). The fall in the price of WTI crude oil futures was large and significant. In contrast, the fluctuations in
gold and Euro/USD FX futures (taken as examples) were large for those markets, but small in relation to the price
changes seen in physical commodities more closely tied to the ‘‘real economy’’.

3 The Month of January 2020
Two early indications of COVID-19 market changes came in WTI crude (CL) and gold (GC) futures.

The United States is one of the world’s ten largest oil exporters. Asia accounts for roughly half of U.S. oil exports, with
most of this going to China [7]. As a result, Chinese refineries are directly exposed to price fluctuations in WTI crude,
and this in turn exposes U.S. traders to changes in Chinese demand.

CL was on an upward trend in Q4 2019, closing the year with an overall increase. However, CL began to drop at a fast
rate starting the second week of January 2020.

Part of this was due to the Saudi-Russian price war, when OPEC and allies agreed to cut oil production on January 1st
2020, and as Russia began to retaliate in the third week of January [8]. But these price war tensions became less
important as Chinese consumption declined. The cancellation of domestic flights within China, and international flights
in and out of China, reduced the demand for gasoline and jet fuel, and subsequently the demand for crude oil. China
blocked people from travelling in and out of Wuhan on January 23rd 2020. The United States imposed partial
restrictions on travel between China and the U.S. on January 31st .

The CME Market Sentiment Meter indicated that CL was in the Balanced state for January. It appeared that the price
was dropping, but not in a way that seemed unusual for this volatile market.

In contrast, GC began rising in December 2019, despite beginning Q4 2019 with a downward trend. This trend in gold
coincided with the cuts to the Federal Funds rates on September 19th [9] and on October 1st [10].

4                                                                                                              ©2020 1QB Information Technologies
Figure 3: Q1 2020 CL Settlement Price and MSM Implied Volatility. The settlement price for WTI crude oil futures (most active expiry) (solid line) and
          the MSM implied volatility (dashed line) for Q1 2020. Regions where the MSM is Complacent (Blue), Balanced (White), Anxious (Yellow), and
          Conflicted (Red) are highlighted. Information and figures for other instruments are available from the 1QBit Finance Products team, please
          contact msmsales@1qbit.com.

Figure 4: Q1 2020 GC Settlement Price and MSM Implied Volatility. The settlement price for COMEX gold futures (most active expiry) (solid line) and
          the MSM implied volatility (dashed line) for Q1 2020. Regions where the MSM is Complacent (Blue), Balanced (White), Anxious (Yellow), and
          Conflicted (Red) are highlighted. Information and figures for other instruments are available from the 1QBit Finance Products team, please
          contact msmsales@1qbit.com.

A typical pattern in GC market states is a price move driving a transition from Balanced to Anxious. Specifically, the price
move for extended periods of Anxious market states is a decline, followed by a consistent low period, ended by a rise to
pre-drop levels, after which the market state may return to a calmer period that can be Balanced or even Complacent.

Changes in the price of gold2 are sometimes associated with external events that make people feel a need for physical
objects of known value. However, to look at these movements after the fact is sometimes to ‘‘discover’’ motivations
that weren’t present at the time. Gold prices are subject to some unusual physical constraints. For example, and to look
ahead, kilobars manufactured by Argor-Heraeus SA, one of the big Swiss refiners whose plant was closed for most of
April, were reported by Bloomberg as selling for over 6% above spot [11].
    2 GC is listed in six standard months: February, April, June, August, October and December. It is also listed for the first three ‘‘serial months’’, i.e. the

current month and the two months that follow consecutively. The serial months include the standard months, so that a standard month can be present
in the first, second or third serial position, creating a visible effect in the volume of the most active contract. When the nearest expiry is a serial month
followed by a standard month, activity moves from the serial month to the standard month at a low volume in both. For details, consult the GC contract
specification on the CME group website [12]: ‘‘Monthly contracts listed for 3 consecutive months, any Feb, Apr, Aug, Oct in the nearest 23 months and
any Jun and Dec in the nearest 72 months’’. Note that the listing of a contract says nothing about whether or not it will be traded.

5                                                                                                                      ©2020 1QB Information Technologies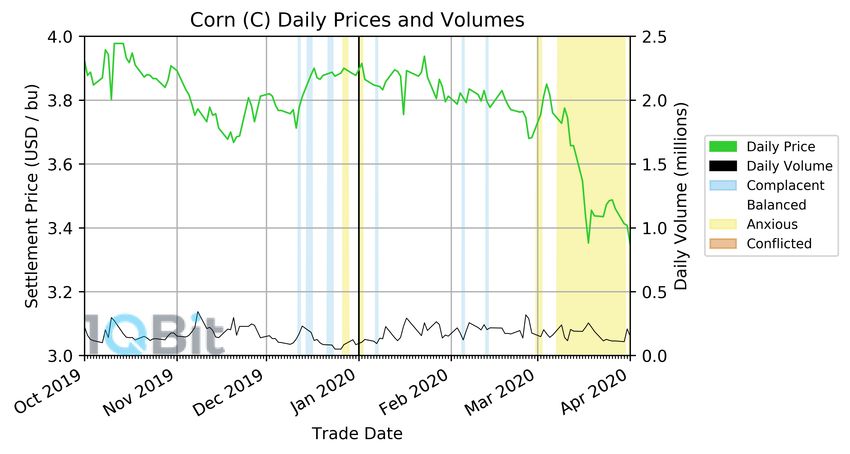
4 The Month of February 2020
In February, the spread of COVID-19 continued rapidly and was accelerating as more cases were confirmed both in
China and around the world. This caused governments to enact more travel bans, border closures, and limits on business
activities. COVID-19 became a global issue.
The markets continued to react. Settlement prices continued to diverge (Fig. 2). However, for the first three weeks of
February, there continued to be very little change in either the MSM market states or the associated risk-return curves.
Activity in the futures markets did not result in changes to the options market until some time later.
This changed in the fourth week of February. Between February 21st and February 24th 2020 there was a sudden drop in
the Dow Jones Industrial Average from 28993.22 to 27978.03 (prices at close). This drop was also seen in the S&P
500® , which dropped from 3337.75 to 3225.89 (prices at close).
Position changes in the stock market led to position changes in the stock options market, and then to position changes
in options on stock index futures like the S&P 500® Index futures (ES) traded on the CME. Figure 5 shows the MSM
risk-return curve for ES beginning to push outwards into negative territory. The traders anticipated both higher
volatility and a (negative) directional change. February 24th 2020 (the right hand plot in Fig. 5) was actually the last date
in February that the Sentiment Meter reported as Balanced.
Figure 5: February 21-24 2020 ES MSM States. The MSM risk-return curves are shown for February 21st 2020 (left) and February 24th 2020 (right).
There is a notable skewing of the distribution, following the sudden drop in the associated settlement price. Figures for other instruments
available through msmsales@1qbit.com
Other products that are linked to the health of the U.S. economy, such as TYF, also saw evolution in their MSM market
states and associated risk return curves. In particular, TYF saw its MSM market state evolve from Balanced to Anxious
over the weekend of February 21st 2020, and preceded an increase in its settlement price.
The MSM sentiment state in S&P 500® E-mini index futures (ES) is frequently compared with indicators based on stock
options, e.g. options on stocks that belong to the S&P 500® index. Both approaches have value. However, the options
written on ES futures contracts tend to be traded further out the curve. MSM is, in a certain sense, ‘‘looking further
ahead’’.
While the markets move rather independently of one another in general, something uniquely interesting happened
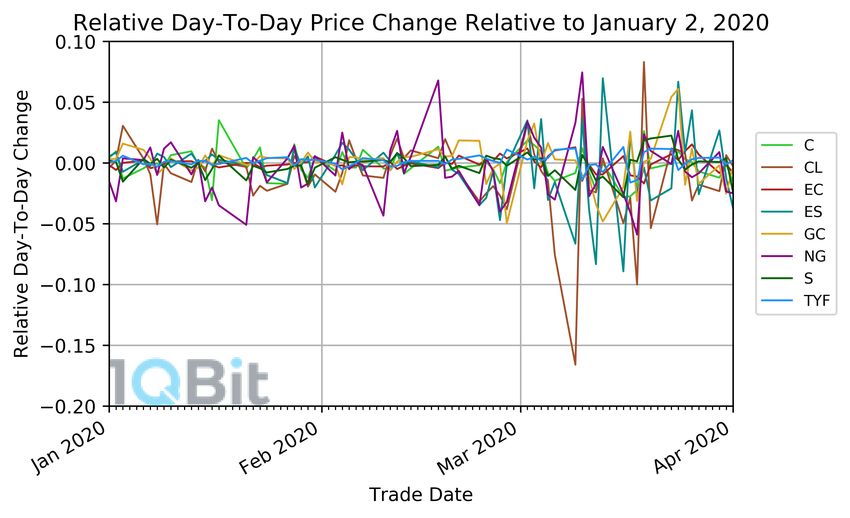
around the weekend of February 29th to March 1st 2020. In looking at the day-to-day relative price changes for the
different products, most markets move in unison around the weekend of February 29th 2020. There is a unique rise,
then fall, in most of the MSM products in the relative day-to-day change in settlement price (Fig. 6).
From this weekend onward, following the hump in relative day-to-day change, there are notable price moves, increases
in the MSM implied volatilities, and evolution in the MSM market states from Balanced to Anxious, generally speaking,
across all the products covered by the MSM. Some products saw rises, such as TYF, while most other products saw price
falls.
6 ©2020 1QB Information Technologies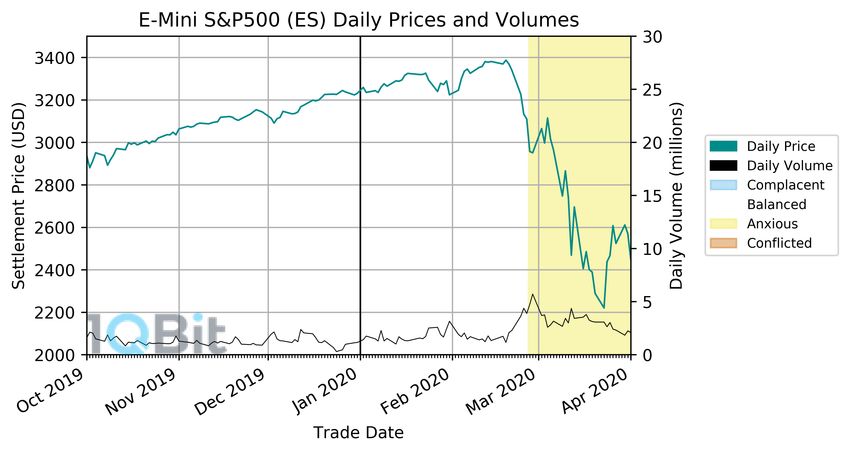
Figure 6: Relative Day-To-Day Price Change. Plotted here are the day-to-day change in futures settlement price (most active expiry) for the MSM
          products. On the weekend of February 29th -March 1st 2020, there was a common rise, then fall, in the relative price change.

Regarding the changes in the futures settlement prices, the sudden price moves seen in Fig. 2 and erratic behaviour
seen in Fig. 6, is a clear indicator that the effects of COVID-19 were felt widely throughout the U.S. markets following
this pivotal weekend. The subtleties of how the spread of COVID-19 is linked to the change in each product varies, as
each product is different. For example, with CL, the Saudi-Russian price war which was previously the dominant cause in
the movement of CL had been muted due to COVID-19. The extreme drop in demand for fuel, due to travel and flights
being cancelled across the world in order to prevent the spread of the virus along with the slowing of many countries’
economies, washed out any other influences in crude oil market.

The MSM market state for each product broadly evolved to the Anxious market states, which has an associated
risk-return curve with a larger implied volatility. However, the Anxious market states arrived at different times for each
product. For example, the Anxious market state arrived on March 9th 2020 for CL, while in ES it arrived on February
27th . In other cases, such as NG, it hardly arrived at all, with one Anxious day on March 13th , and three Anxious days
spanning March 24th to 27th . This illustrates one of the challenges in using commodities as a leading indicator: What
seems like a devastating price collapse in equities is ‘‘business as usual’’ in commodities, i.e. something that the market
can address with established hedging techniques.

For ES, the market states shifted from Balanced to Anxious on February 27th 2020, which was maintained through to
the end of the quarter. Gold’s market states evolved from Balanced to Anxious on February 28th , which was maintained
through to the end of the quarter. For TYF, the market states shifted from Balanced to Anxious on February 24th , which
was maintained through to the end of the quarter.

Figures 1, 3, and 4 have been designed to show the relationship between daily settlement price, daily volume, and
Market Sentiment State. The CME Market Sentiment Meter was developed originally from a study of futures and
options settlement data in advance of events where the timing was known but the outcome was not (elections,
referenda and economic announcements being cases in point). When the event comes as a surprise, the first response
comes in the underlying futures product. Only after some time do the traders take positions in the corresponding
options, from which the Market Sentiment Meter infers their aggregate sentiment.

The COVID-19 pandemic has given us an opportunity to see this effect in multiple markets, and in some cases the
characteristic times associated with the response.

7                                                                                                        ©2020 1QB Information Technologies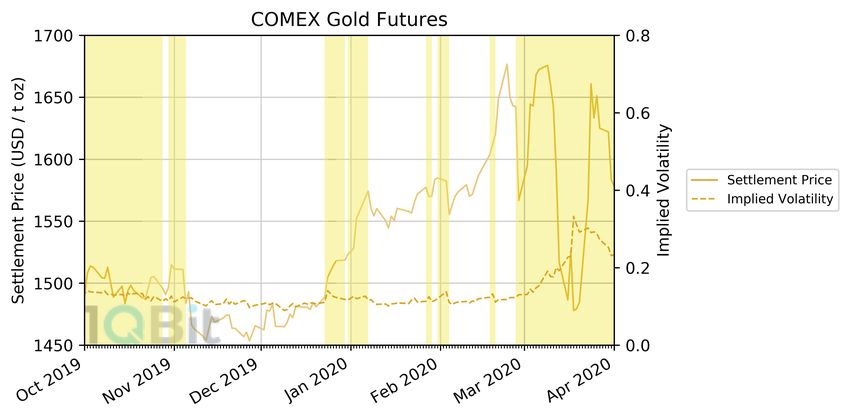
Product      Transition to Anxious
                                                       TYF           Feb. 24, 2020
                                                        ES            Feb. 27, 2020
                                                       GC            Feb. 28, 2020
                                                       EC             Mar. 6, 2020
                                                        C             Mar. 9, 2020
                                                       CL             Mar. 9, 2020
                                                       NG          Isolated Days Only
                                                        S          Isolated Days Only

Table 1: Transition to Anxious Market States. The products tracked by the MSM transition from Balanced to Anxious market states on different dates
         – due to each market’s unique factors – and remained that way through to the end of Q1 2020. For NG and S, there were only a few days on
         which there were Anxious market states, and did not stay that way through to the end of quarter.

5 The Month of March 2020
The Anxious state was established in corn on March 9th 2020. Forty percent of the U.S. crop goes to ethanol for motor
transport fuel, and another forty percent goes to animal feed [13]. Much of the rest goes to the creation of high
fructose corn syrup. The demand for corn is subject to many influences, including government regulation.

The Anxious state was also established WTI crude oil on March 9th and in Euro/USD FX futures on March 6th .

Natural gas was Balanced or Complacent, with the exception of March 13th 2020, and March 24th to March 27th
(Anxious). Similarly, Soybeans were Balanced for the month, with exception of March 17th to March 19th (Anxious).

The natural gas futures contract used by the Market Sentiment Meter is the physically-delivered Henry Hub contact.
This is largely a U.S. domestic product, i.e. not a global benchmark in the same way as WTI crude. China and Japan, for
example, import natural gas primarily from Australia.

Similarly, in considering the price of U.S. soybean futures, note that China now imports the majority of its soybeans
from Brazil. The U.S. soybean market does not respond to Chinese demand in the way it once did.

Inspection of the individual product charts in Fig. 1 shows that price movements in the Anxious State were larger than
the price movements seen in the preceding Balanced state.

As March advanced, the daily volumes gradually returned to their ‘‘pre-COVID-19’’ values. Prices continued to respond
to events, but there was no longer the large-scale shifting of positions in the futures markets.

TYF continued rising, which began to increase sharply mid February and ended March with a high compared to the
beginning of Q1 2020. This sharp rise in settlement price was preceded by a large increase in the daily trade volume.
This followed the U.S. Federal Reserve’s decision to sharply cut Federal Funds rates.

6 Conclusion
The central premise of 1QBit’s CME Market Sentiment Meter is that options prices and volumes reflect the aggregate
sentiments of traders. In the first quarter of 2020, MSM indicated a shift from the Balanced to the Anxious state in all
of the products it monitors, with the exception of soybeans and natural gas. The Anxious state is associated with an
expectation of larger price movements.

There was a lag between the reporting of events in the media and a visible response in the futures markets. There was
further lag between activity in the futures markets and the establishment of options positions from which aggregate
sentiment can be inferred. In the case of COVID-19, the lags can be related to the slowly growing awareness that
COVID-19 was different from previous outbreaks of infectious disease, and that its economic impact would be felt for
some time. Forward-looking activity moves from futures to options in different ways for each product, at different rates.
International trading carries information from one part of the world to another and is more present in some products
than others. Market sentiment takes time to establish, and its informative power must be interpreted in this light.

8                                                                                                           ©2020 1QB Information Technologies
7 2020 Q1 Summary of COVID-19 Events
The following section contains a brief timeline of events in Q1 2020 that were widely reported.

    • January 8, 2019 Scientists in China report discovery of novel coronavirus 2019-nCoV.

    • January 9, 2020 First death from 2019-nCoV was reported by China.

    • January 13, 2020 First case of 2019-nCoV diagnosed outside of China, in Thailand.

    • January 20, 2020 First case of 2019-nCoV reported in the U.S.

    • January 23, 2020 China quarantines Wuhan, China, and begins shutting down transportation within, and in and out
      of the province.

    • January 30, 2020 COVID-19 outbreak declared a ”Public Health. Emergency of International Concern”.

    • February 5, 2020 3100 more confirmed patients within China.

    • February 11, 2020 Oil prices reach one-year low, and continue falling.

    • February 25, 2020 U.S. health officials urge local governments, schools, and businesses to develop plans in case of
      potential outbreaks.

    • February 29, 2020 U.S. bans travel from Iran.

    • March 3, 2020 Federal Reserve cuts Federal Funds Rate to a range of 1.00 - 1.25%.

    • March 11, 2020 WHO declares pandemic status. U.S. suspends all travel from Europe for 30 days, except the UK.

    • March 13, 2020 U.S. declares national state of emergency.

    • March 15, 2020 Federal Reserve cuts Federal Funds Rate once again to a range of 0 - 0.25%.

    • March 27, 2020 U.S. passes and signs the Coronavirus Aid, Relief, and Economic Security Act.

    • March 30, 2020 U.S. extends national shutdown and social distancing until April 30.

Acknowledgements
The authors thank Blu Putnam, Arthur Yu, and Phil Goddard for their discussions in relation to the Market Sentiment
Meter.

9                                                                                         ©2020 1QB Information Technologies
A MSM Market States
The MSM models risk by allowing there to be multiple ‘‘schools of thought’’ for price movement. There are four possible
‘‘market states’’: Complacent, Balanced, Anxious, and Conflicted. Graphical representations of the market states are
found in Figs. 7-8. These are represented in a single Mixture Distribution. The Mixture Distribution represents the
expected price movement over the next twelve months, so that its standard deviation can be directly compared to an
annualized volatility. However, the Mixture Distribution may change daily, evolving over time as new information arises.
The model works best for events in which the timing is known but the outcome is uncertain.
Figure 7: 2012-2020 Daily Settlement Price for CL (most active expiry) (Brown line). The shading indicates the market state. Regions where the MSM
is Complacent (Blue), Balanced (White), Anxious (Yellow), and Conflicted (Red) are highlighted. Figures for other instruments available at
https://1qbit.com/market-sentiment-meter-msm/.
Figure 8: MSM Market States. Graphical representations of the risk-return curves for the four market states within the MSM: Complacent; Balanced;
Anxious; and Conflicted states.
10 ©2020 1QB Information TechnologiesThe Complacent market state is a ‘‘calm’’ state indicating that market participants have few concerns. Conceptually, it is
when the schools of thought do not differ significantly, resulting in a tall and narrow distribution. The narrow width of
the curve is a direct result of a small standard deviation, and generally indicates that there is only a small chance of a
large price move.
The Balanced market state is the most common state. This distribution has a larger standard deviation than the
Complacent state, indicating a larger difference in the schools of thought when compared to the Complacent state.
In the Anxious market state, the schools of thought are diverging, and result in a much broader risk-return curve.
Indeed, the differing schools of thought can also skew the distribution and move the mean off centre, yielding
information about the direction of a potential price move.
Most unique to the MSM model is the Conflicted market state. The defining feature of this, graphically, is the bi-modal
nature of the distribution. For this situation, the schools of thought differ significantly and subsequently result in a large
volatility. This may indicate a large price move.
B CME DataMine Product Codes
Throughout the Historical Market Analyses, CME DataMine product codes are used to refer to the various products. For
convenience, tabulated below is a list of CME DataMine product codes currently available through the Market
Sentiment Meter.
DataMine Code Futures Product Name
C CBOT Corn
CL NYMEX WTI Crude Oil
EC CME Euro FX (USD per EUR)
ES CME E-Mini S&P 500
GC COMEX Gold
NG NYMEX Henry Hub Natural Gas
S CBOT Soybean
TYF CBOT U.S. Treasury 10-Year Note
Visit 1QBit.com for more information.
11 ©2020 1QB Information TechnologiesReferences
[1] WHO, ‘‘Rolling updates on coronavirus disease (COVID-19)’’ (2020),
https://www.who.int/emergencies/diseases/novel-coronavirus-2019/events-as-they-happen.
[2] ‘‘U.S. Drone Strike in Iraq Kills Iranian Military Leader Qasem Soleimani’’ (2020), American Journal of International
Law, Vol. 114, No. 2, pp. 313-323, doi:10.1017/ajil.2020.15.
[3] ‘‘European Union (Withdrawal Agreement) Act’’ (2020), c. 1,
http://www.legislation.gov.uk/ukpga/2020/1/introduction.
[4] Keogh-Brown, Marcus Richard and David Smith, Richard, ‘‘The economic impact of SARS: how does the reality
match the predictions?’’ (2008), Health Policy Vol. 88, No. 1, pp. 110-120, doi:10.1016/j.healthpol.2008.03.003.
[5] CME Group, ‘‘CME Group Achieves Record International Average Daily Volume of 7.2 Million Contracts in Q1 2020,
Up 57 Percent from Q1 2019’’ (2020), CME Group, https://www.cmegroup.com/media-room/press-
releases/2020/4/08/cme_group_achievesrecordinternationalaveragedailyvolumeof72milli.html.
[6] CME Group, ‘‘Liquidity of COMEX Gold & Silver is Excellent’’ (2020), CME Group,
https://www.cmegroup.com/education/articles-and-reports/liquidity-of-comex-gold-and-silver-is-excellent-during-
asia-hours.html.
[7] CME Group, ‘‘The other side of the mirror: Asia’s perspective on US crude exports’’ (2020), CME Group
https://www.cmegroup.com/education/articles-and-reports/the-other-side-of-the-mirror-asias-perspective-on-us-
crude-exports.html.
[8] Griffin, Rosemary, ‘‘Russian political shakeup leaves OPEC strategy up in the air’’ (2020), S&P Global,
https://www.spglobal.com/platts/en/market-insights/latest-news/electric-power/011620-russian-political-shakeup-
leaves-opec-strategy-up-in-the-air.
[9] Smialek, Jeanna, ‘‘Fed Cuts Interest Rates by Another Quarter Point’’ (2020), The New York Times,
https://www.nytimes.com/2019/09/18/business/economy/fed-interest-rate-cut.html.
[10] Smialek, Jeanna, ‘‘Federal Reserve Cuts Interest Rates for Third Time in 2019’’ (2020), The New York Times,
https://www.nytimes.com/2019/10/30/business/economy/federal-reserve-interest-rates.html.
[11] Mazneva, Elena, ‘‘Gold Dealers Report Big Shortages of Small Bars and Coins’’ (2020), Bloomberg,
https://www.bloomberg.com/news/articles/2020-04-02/want-a-gold-bar-under-your-mattress-get-in-line-and-
pay-up.
[12] CME Group, ‘‘Gold Contract Specifications’’
https://www.cmegroup.com/trading/metals/precious/gold_contract_specifications.html.
[13] Mumm, R. H., Goldsmith, P. D., Rausch, K. D., Stein, H. H. , ‘‘Land usage attributed to corn ethanol production in the
United States: sensitivity to technological advances in corn grain yield, ethanol conversion, and co-product
utilization’’ (2014), Biotechnology for Biofuels, 7, 61, doi:10.1186/1754-6834-7-61.
12 ©2020 1QB Information TechnologiesYou can also read


