Measuring inflation of ride sharing services in Brazilian official CPI - UNECE
←
→
Page content transcription
If your browser does not render page correctly, please read the page content below
Measuring inflation of ride sharing services in Brazilian official CPI
                                     Vladimir G. Miranda∗,†Lincoln T. da Silva‡,

                                   André F. G. Almeida§and Pedro K. da Costa¶

                            Brazilian Institute of Geography and Statistics - IBGE
                             Price Indices Coordination - Directorate of Surveys

                                                             Abstract
           The growth of digital and sharing economies has sparked a revolution that changed consumer habits
       and preferences. Such tendency poses great challenges to CPI compilers, who need to incorporate these
       changes in their measurements in order to keep the CPI representative and up to date. Practical and
       methodological aspects that need to be dealt with by CPI compilers include issues such as data access,
       definition of representative products to be priced, intensive dynamic pricing practices, and limited time to
       collect, edit and publish the data. Aiming at contributing to the literature about measurement of digital
       and sharing economies effects on CPIs, this work describes the initial proposal of measuring inflation for
       ride sharing services, a component introduced in the new basket of the Brazilian official CPI compiled by
       IBGE. The method is essentially based on the construction of a representative panel of “products”, to be
       priced on a daily basis, and defined by fixing a small set of characteristics such as request time, location
       of departure, and distance between departure locations and arrival destinations. The collection of the
       desired data is performed via means of web scraping techniques. Within such approach, price variations
       can be derived in a similar way as other CPI’s components and fit the matched model method.

1      Introduction
    Advances in information technology are producing profound changes in many aspects of society. The
rapid expansion of the digital economy is a major example of such changes. E-commerce, that was born with
the internet, has seen its importance grow at an accelerated pace due to the improvement of IT infrastructure,
especially after the development of powerful mobile smartphones, which besides contributing to the increase
of traditional e-commerce, has opened the door to expand the sector by introducing a whole class of services
related to mobile apps.
    Consumer behaviour is being reshaped in accordance with such novelties, especially after the advent
of the COVID-19 pandemic. In many cases, e-commerce is the only purchase platform available, since
brick-and-mortar stores may not be allowed to open, and citizens’ circulation is being restricted by sanitary
authorities.
    CPI compilers have always been challenged to keep up-to-date measures of consumers’ habits via rep-
resentative consumption baskets. Inclusion of digital services is becoming mandatory as the importance of
such items is growing fast. This task embodies a twofold degree of complexity. The first is the usual difficulty
to characterize a service that can “fit” the matched model method, which aims to compare like with like
over time to capture pure price changes. The second is that information on prices for such services is not
available through traditional sources.
    ∗ The   views expressed in this paper are those of the authors and do not necessarily reflect those of IBGE.
    † vladimir.miranda@ibge.gov.br
    ‡ lincoln.silva@ibge.gov.br
    § andre.f.almeida@ibge.gov.br
    ¶ pedro.costa@ibge.gov.br

                                                                 1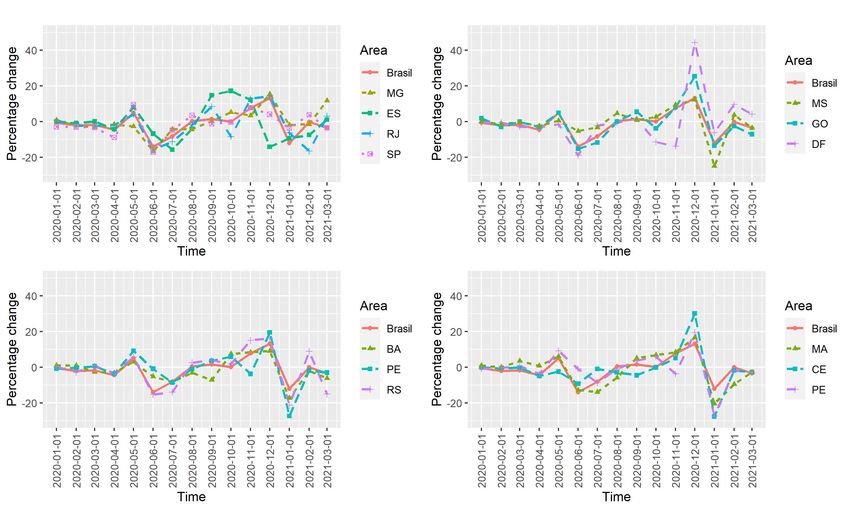
The compilation of CPI measures for ride sharing services is a representative example of the issues
discussed above. Ride sharing services are very popular and usually are quickly adopted by consumers in
countries where they are implemented. This tendency is forcing NSOs to consider including such services
in their baskets and to derive methodologies for index calculations. Due to multiple price determinant
characteristics, the definition of representative items to track over time needs to rely on the selection of a
limited number of key features [Kidd et al., 2018]. One possible approach is to treat the service similarly
to what is done for taxi services where a “standard” trip fare is calculated based on a fixed distance for
the trip, plus the price per kilometer and taxes embodied in the service. However, ride sharing services are
characterized by high price dynamics according to consumers’ demand and drivers’ availability at a given
moment and place. Use of a “standard fare” fails to capture such behavior and is also limited if the goal is
to provide results representing different regional strata.
    A more elaborate method can be designed by means of price collection procedures that mimic the action
of consumers when demanding such services for a given route and time. This approach follows the best
practices described by CPI reference guides [OIT et al., 2020, Eurostat, 2018] for public transportation
services such as airfares, train tickets etc. Adoption of this approach can be challenging without direct
access to the required data [Kidd et al., 2018] from the companies that offer such services. However, the
existence of web sites that allow consumers to estimate the price of a given ride in a similar way to what
is done in the mobile app, by simply providing trip parameters such as departure and arrival addresses and
time of departure, can be used as a source for development of more refined methods. As we show here, use
of web scraping techniques to extract data from such sites provides an opportunity to compile CPIs that can
represent the dynamic pricing behaviour of the sector.
    In this paper we discuss how ride sharing services were incorporated in the baskets of CPIs compiled
by the Brazilian Institute of Geography and Statistics (IBGE) and the methodologies adopted for CPI
production. In the first part of section 2, we briefly discuss how ride sharing services were derived from
IBGE’s last Household Budget Survey (HBS) and the main results showing the relevance of these services
for different regions covered by the CPIs. In the second part, we detail how we define items to be collected
by web scraping of the target sites and the methods for index compilation. In section 3 we present and
discuss some results of the indices compiled so far. Finally, in section 4 we present our conclusions.

2     Methodology
2.1    Incorporation in the baskets
    IBGE produces monthly indicators at regional and national levels for different target populations accord-
ing to different income ranges [Miranda et al., 2019, IBGE, 2020a,b]. Regarding the income aspect, two main
indicators are calculated. The so-called Extended National Consumer Price Index (IPCA in Portuguese) is
produced for groups with income ranging from 1 to 40 Brazilian minimum wages with any source of income.
The other main indicator is the National Consumer Price Index (INPC in Portuguese) which covers families
earning 1 to 5 minimum wages, whose main source of income comes from salary.
    Regarding the geographical coverage, each area in the scope of a given CPI has its own basket and
the national baskets and CPIs are derived by compiling the regional results [Miranda et al., 2019, IBGE,
2020a,b]. Currently, regional indices for INPC and IPCA are produced for 16 Brazilian states and nationally
[Miranda et al., 2019, IBGE, 2020a,b]. The same areas are covered by both indicators. The national IPCA
is the measure adopted by the Brazilian central bank for the definition of its monetary policies.
    The definition of the basket components of the CPIs relies on the HBS conducted by IBGE [Miranda
et al., 2019, IBGE, 2020a,b]. The last HBS was carried out between July 2017 and June 2018 and provided
the elements and weights of the new baskets implemented in January 2020 [IBGE, 2020b, 2019]. The survey
sample included around 55 000 households and was designed to allow the production of local baskets for
each of the urban areas of the Brazilian states.
    The expenditures observed in the HBS are organized according to the classification system adopted
by IBGE’s CPIs. Currently IBGE adopts its own classification system with 4 levels of disaggregation
(Groups, Subgroups, Items and Subitems) which resembles the upper 4 levels of a COICOP system [Miranda
et al., 2019, IBGE, 2020a]. Figure 1 illustrates how ride sharing services expenditures were allocated in the
classification system within the Transport group and subgroup and within the item Public Transport.

                                                      2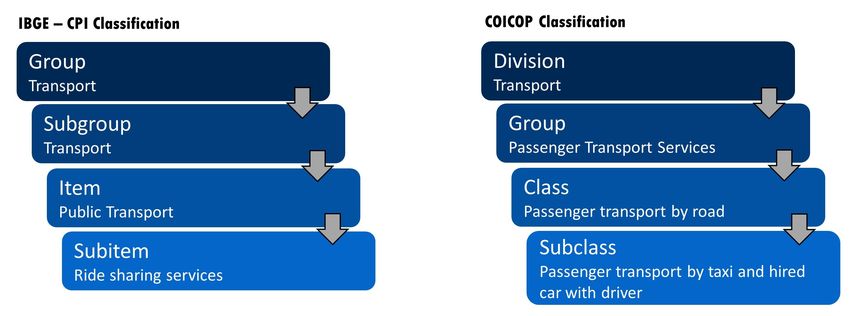
Figure 1: (right) Illustration on how ride sharing services are allocated within the classification system of
IBGE’s CPIs. (left) COICOP structure ”correspondence”.

    Ride sharing services were found representative for the majority of areas in the scope of both CPIs
[IBGE, 2020b], IPCA and INPC, as presented in Table 1. The magnitude of the weights is similar, but it
is interesting to note that in some areas the weight for ride sharing services surpass that of taxis. Also, the
number of areas where ride sharing services are representative is equal (for the IPCA) or greater than (for
the INPC) that for taxi.
    The national weights for ride sharing services observed for the IPCA (0.21%) are slightly greater than for
the INPC (0.15%), and the relative weights inside the Transport group are respectively 1.06% and 0.78%.

Table 1: Illustration of the weights derived for ride sharing services and taxi for the areas in the scope of
the INPC and the IPCA

                                           IPCA                      INPC
                          Area             Ride sharing              Ride sharing
                                   Taxi                      Taxi
                                             Services                  Services
                           BR      0,21        0,21          0,16        0,15
                           AC      0,54          -           0,55        0,07
                           PA      0,43          -           0,32          -
                           MA      0,32        0,11          0,41        0,15
                           CE      0,18        0,15          0,15        0,16
                           PE      0,30        0,32          0,15        0,28
                           SE      0,58        0,11          0,53        0,17
                           BA      0,38        0,30          0,19        0,21
                           MG      0,24        0,19          0,17        0,16
                           ES      0,12        0,10            -         0,09
                           RJ      0,45        0,31          0,20        0,26
                           SP      0,16        0,20          0,11        0,12
                           RS      0,26        0,38          0,20        0,27
                           MS      0,09        0,23            -         0,28
                           GO        -         0,26            -         0,09
                           DF        -         0,25          0,11        0,16

3    Services specifications and price collection
    As discussed in the introductory section, ride sharing services are characterized by a high price volatil-
ity. Prices charged by ride sharing companies usually encompass different types of components. Besides

                                                      3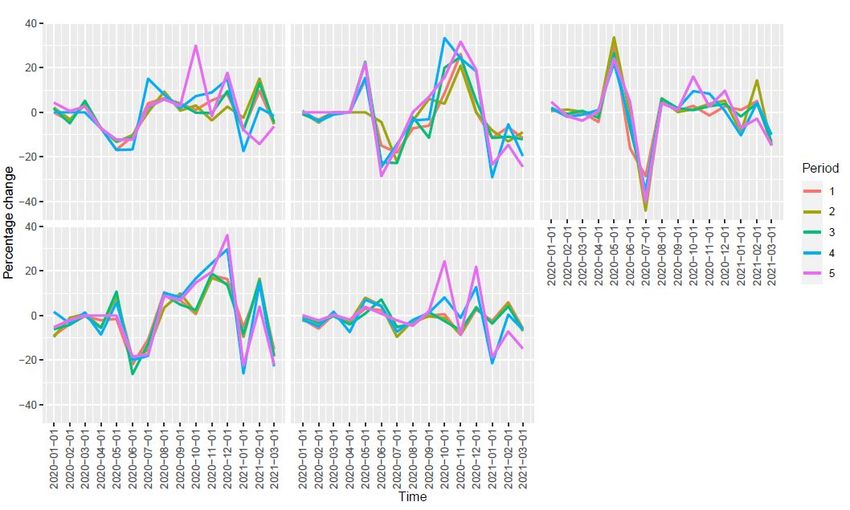
a per kilometer and per minute rate, most service providers also adopt a booking fee and a surge price,
which is charged according to rider-to-driver demand. The approach adopted seeks to incorporate all these
components by the use of an automatic collection that mimics the action of a consumer demanding a given
ride. In doing so, we take advantage of the fact that price quotes for these services can be derived via web
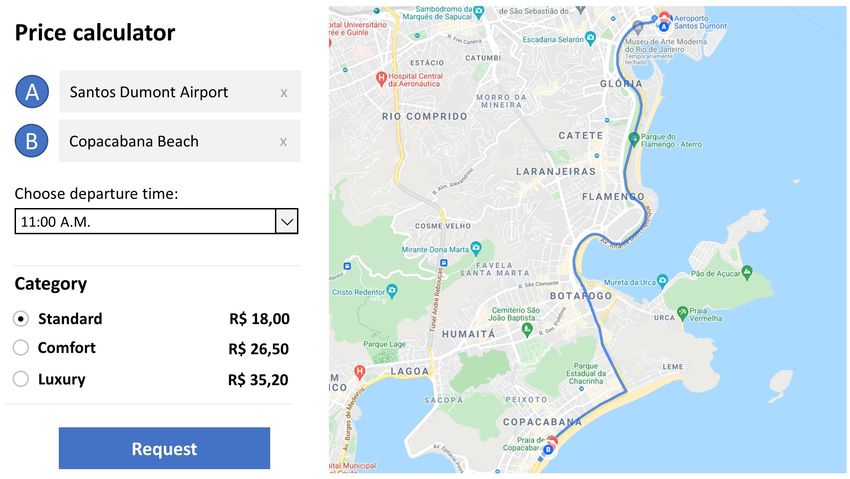
pages of the companies offering the services or other specialized price comparison sites. A typical example
is illustrated in Figure 2.
Figure 2: Example of the simulation of a trip cost in a generic web site.
Given the absence of transaction prices or public records, using the web scraping technique to collect
this data has proven to be the best choice. In addition, retrieving this information manually would be a
time-consuming task, while the robot can perform a controlled and timely collection in only a few minutes
even for an extensive amount of data. Use of web data by NSOs is growing in importance and in adepts,
especially within CPI compilers where many studies and applications are being implemented [ten Bosch and
Windmeijer, 2014, ten Bosch et al., 2018, Eurostat, 2020, da Silva et al., 2019, Loon and Roels, 2018, Flower,
2019, Posse and Moreno, 2019, Bentley and Krsinich, 2017].
Besides the technical challenge of creating a code to scrape the data from the web, index compilers are
also faced with methodological issues while using web data [Eurostat, 2020]. For the pages with data on ride
sharing services, a consumer can estimate the price of a given ride by providing a few parameters that define
the trip, namely, departure and arrival addresses, departure time and the category of the service. Since an
infinite combination of such parameters can be adopted to define different trip specifications, a challenge
that arises is how to select the appropriate routes. Ideally, data from companies reporting the most frequent
rides should be adopted in this task.
As we do not have access to this information, we use an alternative approach, and define a set of
representative trips to track. The departure addresses consist of places where people usually demand such
services, and we also set common trip distances, the time of departure and the category of the service
(standard, luxury, etc.). The main idea is to create a trip that is representative of consumer habits and
which is also comparable over time.
The details of the trip-defining parameters to track are given below.
Definition of trip’s input parameters.
Selection of the trip category: Regarding the category of the service provided, only the standard one is
considered for the purpose of the index, since this seems to be the most common choice among users.
4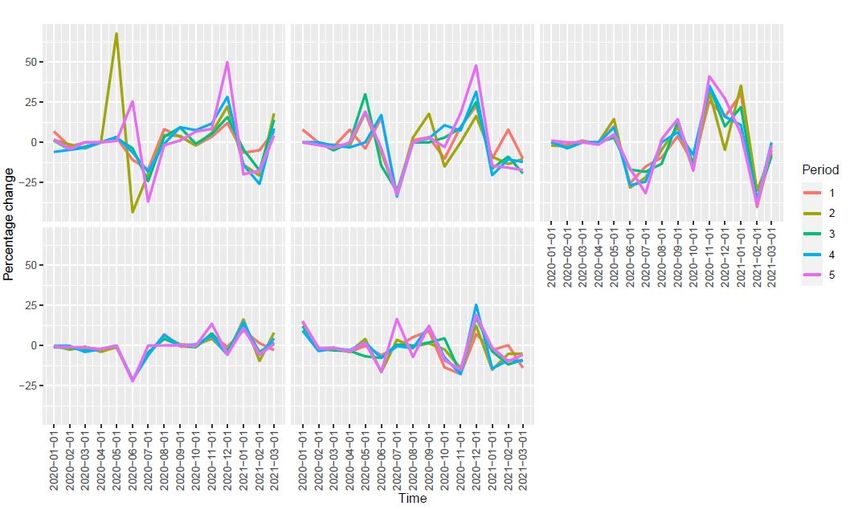
Selection of the routes: Selection of a route relies on the definition of typical trip distances and both
departure and arrival locations. For our case, the parameters adopted are:

  i) departure location: five different routes were selected for each area. The choice of the departure addresses
     encompasses places with high demand for this sort of service, such as shopping centers, airports, markets,
     and touristic spots.
 ii) trip distances: Routes have an average of 3, 5 and 10 kilometer depending on the trip. These distances
     were set because they represent the most common rides for taxis, according to surveys carried out by
     field staff.
iii) arrival destination: the arrival addresses are set manually according to the departure place and typical
     distances.

    Time of departure: 5 different departure times throughout the day for each route are considered.
    Selection of companies: prices are collected for the most representative companies offering the services
in each area.
    Given this definition, the description of a representative trip in the city of Rio de Janeiro, for example,
could be Santos Dumont Airport – Copacabana Beach, standard category, 11 A.M, company A.
    Prices for each specified trip are collected daily during weekdays1 over the reference period of the CPIs.
This provides a mean price which is more representative for the service, in agreement to the approach
suggested while using web data from markets with such high price volatility [Eurostat, 2020].
    For each of the trips defined, prices are automatically extracted from web sites providing prices for the
services. The robots act like a human setting the trip parameters of interest as illustrated in Figure 2. After
the outcome of the query, the price for the trip is extracted. The collection is scheduled to occur near the
previously determined departure time since this is the most common practice adopted by consumers.
    The robots were built in home using R [R Core Team, 2020] and the RSelenium package [Harrison,
2020] to deal with the dynamic character of the websites in order to fill the sites forms with the required
parameters.
    A reduced number of trips has been used so far, such that a manual collection can be employed if an
issue that permanently prevents the automatic collection arises (for instance, if sites have been shut down
or if there is a definitive block to robots).

3.1     Index formulas
    Monthly indicators for ride sharing services are generated for each area and for the national index based
on a short-term approach. The generation of the indices follow a multi-stage process with different formulas
as detailed in the sequence.
    First, for a given month t, a monthly average price for a given trip α, at the area l, denoted by p̄l,t
                                                                                                         α is
calculated as:

                                                                 pl,t
                                                                  α,i
                                                        p̄l,t
                                                          α =                                                            (1)
                                                                 ntα
    In Eq. (1), pl,t                                                                                    t
                 α,i denotes the price for the trip α collected at a given day i of the month t and nα is the
number of collected prices for trip α at month t.
    The second step consists in calculating a relative of mean prices for the trip α between consecutive months
t − 1 and t, given by:

                                                      l,t−1:t       p̄l,t
                                                                      α
                                                     Rα       =     l,t−1
                                                                                                                         (2)
                                                                  p̄α
   Relatives of different trips are then aggregated via use of a geometric mean to generate the area’s indices:
   1 This restriction was established because the scraping needs constant monitoring since it may not function properly on

certain occasions. If the robot malfunctions during the weekend, the employee in charge of monitoring is not going to be able
to fix it.

                                                             5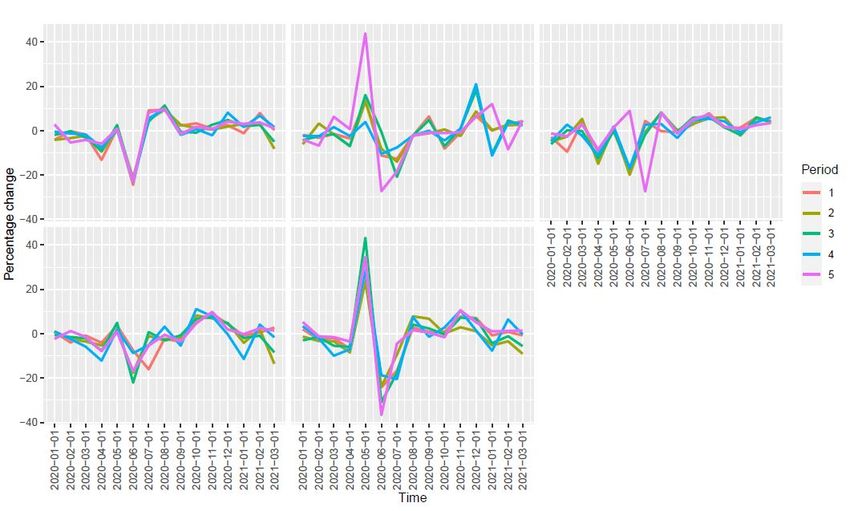
Y                  1/Nαl
                                             I l,t−1:t =            l,t−1:t
                                                                   Rα                                                (3)
                                                           α

   where, in Eq. (3), Nαl is the number of trips defined in area l.
   The calculation of the national indices also follows the approach of other components of the CPI basket
and is given via an weighted arithmetic mean of the local indices [IBGE, 2020a]:

                                                       W l wl,t−1 Iαl,t−1:t
                                                    P
                                      I BR,t−1:t = l P        l l,t−1
                                                                                                       (4)
                                                         lW w

    In Eq. (4), a double weighted sum is implemented where W l corresponds to the weight of a given area
l, given by the HBS [IBGE, 2020b], and wl, t − 1 is the weight for ride sharing services at an area l at the
base period t − 1 [IBGE, 2020a]. The weights differ according to each CPI, INPC or IPCA [IBGE, 2020a].
    We note that the calculation steps above align with the general calculation employed at IBGE for the
majority of the elements in the CPI’s basket [IBGE, 2020a, Miranda et al., 2019].

4     Results and discussion
   The robots have been collecting data since the end of 2019 until now. We discuss some of the results
observed so far2 . The idea is only to present a qualitative view and highlight some of the main features
observed that support the consistency of the approach.
   In Figure 3 we present the monthly price distributions for the different routes for the area of São Paulo
between January 2020 and March 2021. The results are given for the same departure time for all the routes.
Route 1 is the longest one, routes 2 and 3 are the ones with average distance of 3Km and routes 4 and 5
have average distance of 5Km.

Figure 3: Monthly price distributions obtained for São Paulo. Prices for one company. Data collected from
January 2020 to March 2021.
   2 We note that as the same data is used for the compilation of the INPC and the IPCA, the only level at which the CPIs

series will differ is at the national level.

                                                               6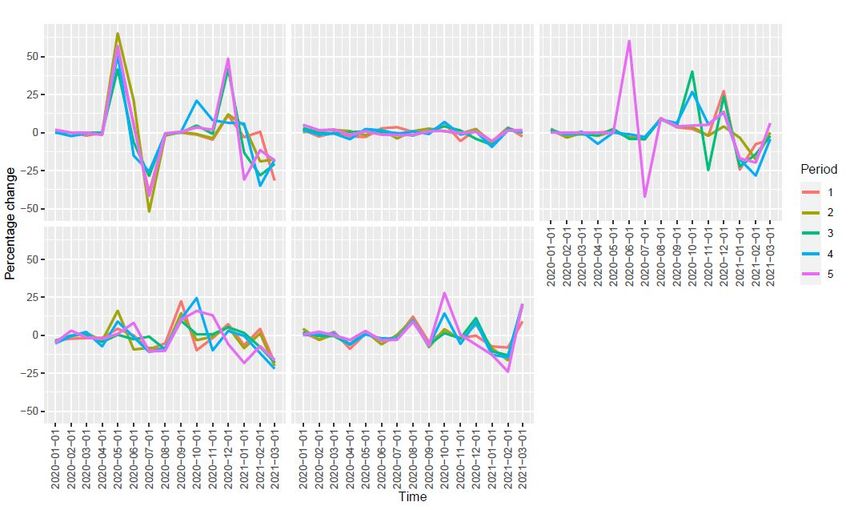
As a first remark we note that the variability in the distributions according different months and routes
(see also figures in the Appendix for other areas) are a good demonstration that the approach is able to
capture price dynamics in a timely manner.
    For a given month, the difference in price levels of different routes will depend on the surge prices and
the base fare for the routes. Longer trips in general are more expensive as expected also demonstrating
consistency in the data collected.
    Analyzing the monthly distributions over time, one can observe a marked drop in prices when moving
from the beginning of the second quarter of 2020 to the middle of the year. In many areas, this price fall
lasted during the third quarter until a recovery of prices took place in the last quarter of 2020. Fluctuations
in the magnitude and position of these changes are seen, which is a reflex of the peculiarities of the given
route and area (see also figures in the Appendix for case examples of others areas).
    This behaviour seems to be in agreement with the general scenario of the pandemic in the country. During
the second quarter and the first half of the third quarter of 2020, the restrictions imposed on the opening of
commerce and the movement of people probably caused an important drop in the number of costumers for
these services, hence causing the fall in price levels. The relaxation of the restrictive measures from the end
of the third quarter of 2020 onwards led to an increase in the circulation of people on the streets and hence
the higher demand pushed prices up. This was intensified by the electoral campaign to choose municipal
representatives, which occurred in October and November, and the holidays at the end of the year.
    Another characteristic that supports this view is that the boxplots for the central months are flattened
respective to other periods. This reduction in the variability is a reflex of the reduction in consumers’ demand
for the service. In opposition to this, in the initial months of 2020 and the months of the fourth quarter,
an increased variability in the monthly distributions is noted, which also seems to agree with the increase in
the circulation of people in the city.
    Time series for the price relatives for the same routes of Figure 3 are displayed in Figure 4. The plots
in Figure 4 extend the results of the previous analysis by the inclusion of the results for all departure times
selected for each route. The main features observed in the price distributions of Figure 3 are confirmed here
as expected.
    Interestingly, except for some exceptions, the results for the different departure times seem to behave in
a very similar fashion. On the other hand, results seem to be more sensitive to the routes (also confirmed
by the results from other areas, as seen in the Appendix). We note, however, that non-parametric tests
performed on our data sets show that the mean value of the different trips differ in at least one of the periods
evaluated for 96% of the cases, which supports our initial choice of differentiating the trips according the
departure time.
    However, analysis of the series for different areas show that for some routes the results are very similar
irrespective of the departure and arrival destinations and the departure time (see for example Figure 13
in the Appendix). This suggests that it might be possible to aggregate similar trips into homogeneous
groups. Also, this pints that a given trip is able to represent the behavior of a large set of trips with similar
characteristics.
    Moving to the upper-level indices, Figure 5 shows the comparison of the indices compiled for the IPCA at
the national and local levels. The main features present in the series for the national level are also observed
at the local indicators and agree with those described at the analysis of more disaggregated levels. This
suggests the approach is robust in capturing the key dynamic aspects of this market without disregarding
the peculiarities in each area as observed by the distinction in the fluctuating patterns and magnitude of
changes in the local indices of Figure 5.

5    Conclusions
    In this work we presented all the steps taken in order to compile the ride sharing services index at IBGE.
We briefly discussed how these services were included in the last basket update from the results of the most
recent HBS [IBGE, 2020b]. Ride sharing services have shown to be representative for the local baskets in
different areas of Brazil and for different income groups [IBGE, 2020b].
    A methodology that adopts the use of web scraping tools to extract prices of a representative number of
trips is presented and it is shown how it is able to capture market dynamics manifesting according different

                                                       7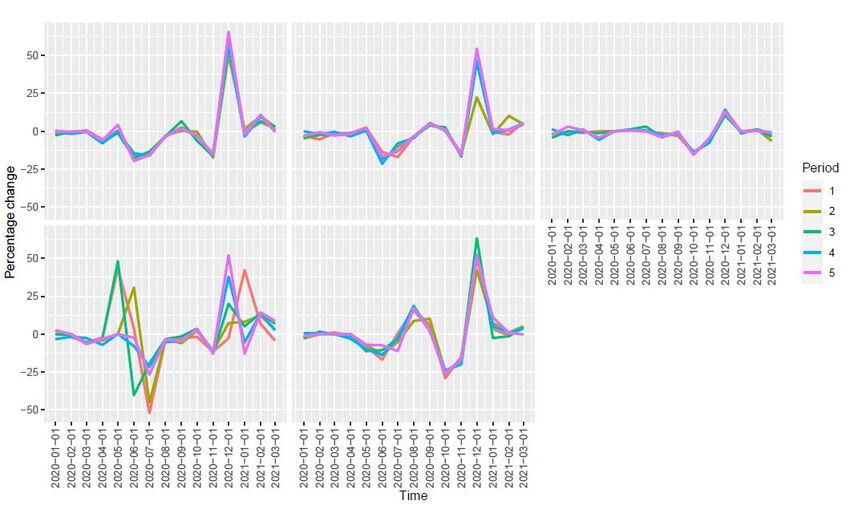
Figure 4: Price relatives series according to different routes and departure times for São Paulo.

scenarios (routes, time of departure and geographical areas) in a timely and efficient manner as it avoids
extra burden on the collection of over 7000 prices monthly. The number of trips selected is chosen such that
a manual collection can be performed as a fallback plan if the automatic collection is discontinued for some
reason.
    The time series presented shows that the results are in agreement with market dynamics. This is high-
lighted by inspection of the series behaviour after the advent of the COVID-19 pandemic where sensible
changes were observed according to the measures adopted to limit people’s circulation. Consistency of the
results observed at different levels of aggregation and regions suggests that the approach is robust.
    With the availability of transaction data for these services, it shall be possible to group similar routes
into homogenous groups and derive weights for those aggregates. These would allow the use of more refined
weighted formulas for CPI calculation.
    The approach can be improved in several directions. For instance, even without access to transaction
data, in principle more refined results can be derived by enhancing the number of trips selected. But it is
important to have in mind that to define departure and arrival pairs, even if an automatic criterium for
selection is used, a manual inspection can be required to validate the routes selected.
    Use of probabilistic sampling based on population information could also be an alternative for random
selection of representative routes. The sampling weights can also be used as proxy weights for the routes.
However, this should be used with caution since regions with high concentrations will not always be those
with higher demand for the services, especially in unequal countries such as Brazil where the services can be
more concentrated in richer neighborhoods. Also, some routes considered to be dangerous can be prohibited
by the service providers to ensure the safety of drivers.

References
A. Bentley and F. Krsinich. Towards a big data cpi for new zealand. Paper presented at the meeting of the
  Ottawa Group at Eltville, Germany, 2017.
L. T. da Silva, I. L. de Oliveira, T. Dantas, and V. G. Miranda. Studies of new data sources and techniques
  to improve cpi compilation in brazil. Paper presented at the 16th meeting of the Ottawa Group, Rio de

                                                      8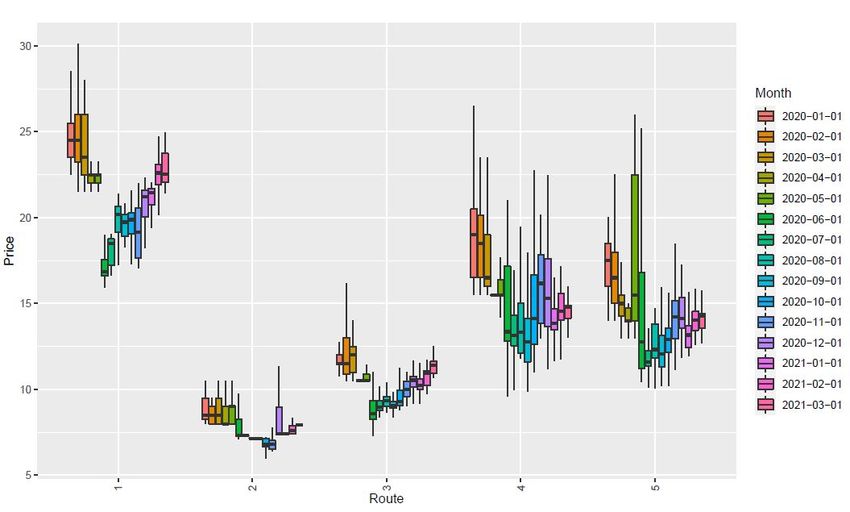
Figure 5: Comparison between regional and national index series for the IPCA.

  Janeiro, Brazil, May 2019. URL https://eventos.fgv.br/sites/eventos.fgv.br/files/arquivos/
  u161/study_of_new_data_sources_snipc_lincoln_da_silva.pdf.
Eurostat.   Harmonized index of consumer prices (hicp): Methodological manual.  Novembro
  2018.   URL https://ec.europa.eu/eurostat/documents/3859598/9479325/KS-GQ-17-015-EN-N.
  pdf/d5e63427-c588-479f-9b19-f4b4d698f2a2.

Eurostat. Practical guidelines on web scraping for the hicp. November 2020. URL https://ec.europa.eu/
  eurostat/documents/272892/12032198/Guidelines-web-scraping-HICP-11-2020.pdf.
T. Flower. Using alternative data sources in consumer prices, uk. Paper presented at the meeting of the
  Ottawa Group at Rio de Janeiro, Brazil, 2019. URL https://eventos.fgv.br/sites/eventos.fgv.br/
  files/arquivos/u161/using_alternative_data_sources_in_consumer_prices_uk.pdf.

J. Harrison. RSelenium: R Bindings for ’Selenium WebDriver’, 2020. URL https://CRAN.R-project.org/
   package=RSelenium. R package version 1.7.7.
IBGE. Pesquisa de orçamentos familiares 2017-2018: Primeiros resultados.              2019.    URL https://
  biblioteca.ibge.gov.br/visualizacao/livros/liv101670.pdf.

IBGE. Sistema nacional de ı́ndices de preços ao consumidor: métodos de cálculo, 8 edição. Série relatórios
  metodológicos, 14, 2020a. URL https://biblioteca.ibge.gov.br/visualizacao/livros/liv101767.
  pdf.
IBGE. Sistema nacional de Índices de preços ao consumidor: estruturas de ponderação a partir da pesquisa de
  orçamentos familiares 2017-2018. Série relatórios metodológicos, 46, 2020b. URL https://biblioteca.
  ibge.gov.br/visualizacao/livros/liv101711.pdf.

A. Kidd, H. Woodall, K. Dawes, and V. Warne. Incorporating the share economy into the australian cpi.
  Paper presented at the UNECE Meeting of the Group of Experts on Cosumer price indices, Geneva,
  Switzerland, 2018. URL https://unece.org/fileadmin/DAM/stats/documents/ece/ces/ge.22/2018/
  Australia_2.pdf.

                                                       9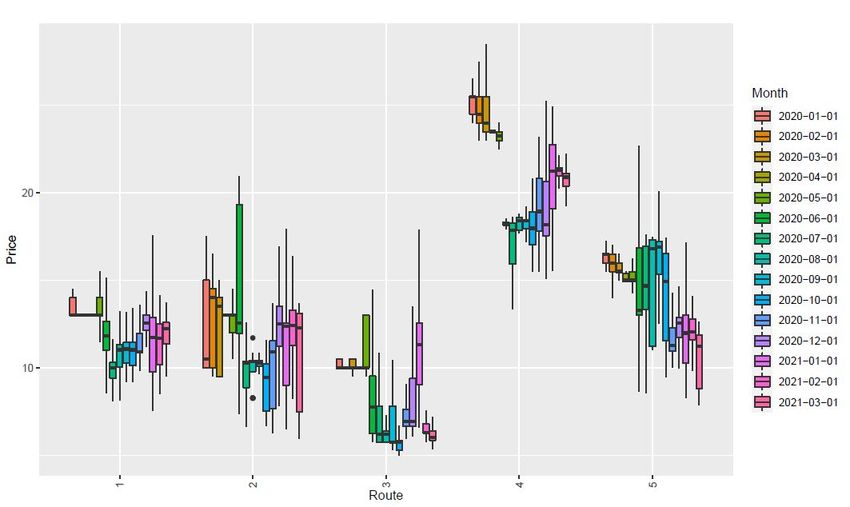
K. V. Loon and D. Roels. Integrating big data in the belgian cpi. Paper presented at the ILO/UNECE
  meeting of the Group of Experts on Consumer Price Indices, May 2018. URL https://www.unece.org/
  fileadmin/DAM/stats/documents/ece/ces/ge.22/2018/Belgium.pdf.
V. G. Miranda, P. K. da Costa, and R. V. Ventura. Consumer price ı́ndices at ibge: 40 years
  and counting.  Paper presented at the Ottawa Group meeting, Rio de Janeiro, Brasil, Maio
  2019. URL https://eventos.fgv.br/sites/eventos.fgv.br/files/arquivos/u161/40_years_cpi_
  at_ibge_vladimir_miranda.pdf.
OIT, FMI, OCDE, Eurostat, B. Mundial, and C. Europeia. Consumer price index manual: Concepts and
  methods. 2020. URL https://www.imf.org/en/Data/Statistics/cpi-manual.

R. Posse and J. A. Moreno. Use of big data in modern markets coexisting with traditional markets data. Paper
  presented at the meeting of the Ottawa Group at Rio de Janeiro, Brazil, 2019. URL https://eventos.
  fgv.br/sites/eventos.fgv.br/files/arquivos/u161/ogmexico_english_final_020919_rpf.pdf.
R Core Team. R: A Language and Environment for Statistical Computing. R Foundation for Statistical
  Computing, Vienna, Austria, 2020. URL https://www.R-project.org/.

O. ten Bosch and D. Windmeijer. On the use of internet robots for official statistics. worker paper presented
  at the Meeting on the Management of Statistical Information Systems, MSIS., 2014. URL https://www.
  bigsurv18.org/conf18/uploads/73/61/20180820_BigSurv_WebscrapingMeetsSurveyDesign.pdf.
O. ten Bosch, D. Windmeijer, A. van Delden, and G. van den Heuvel. Web scraping meets sur-
  vey design: combining forces. Paper presented at the Big Data Meets Survey Science Confer-
  ence, Barcelona, 2018., 2018. URL https://www.bigsurv18.org/conf18/uploads/73/61/20180820_
  BigSurv_WebscrapingMeetsSurveyDesign.pdf.

                                                     10
Appendix
Figure 6: Monthly price distributions obtained for Pernambuco. Prices for one company. Data collected
from January 2020 to March 2021.
Figure 7: Illustration of price evolution for different routes for Pernambuco.
11Figure 8: Monthly price distributions obtained for Rio de Janeiro. Prices for one company. Data collected
from January 2020 to March 2021.
Figure 9: Illustration of price evolution for different routes for Rio de Janeiro.
12Figure 10: Monthly price distributions obtained for Rio Grande do Sul. Prices for one company. Data
collected from January 2020 to March 2021.
Figure 11: Illustration of price evolution for different routes for Rio Grande do Sul.
13Figure 12: Monthly price distributions obtained for Distrito Federal. Prices for one company. Data collected
from January 2020 to March 2021.
Figure 13: Illustration of price evolution for different routes for Distrito Federal.
14You can also read