A BUSINESS CASE FOR INVESTMENT AND OPERATION OF A SUBMARINE FIBER CABLE
←
→
Page content transcription
If your browser does not render page correctly, please read the page content below
A business case for investment and operation of a submarine fiber cable

                 SØRLANDSFIBER

                 A BUSINESS CASE FOR INVESTMENT AND OPERATION OF A
                 SUBMARINE FIBER CABLE
                 EIRIK GRØNSUND                                     October 2016   Version 1.0

© Iserv Computing 2016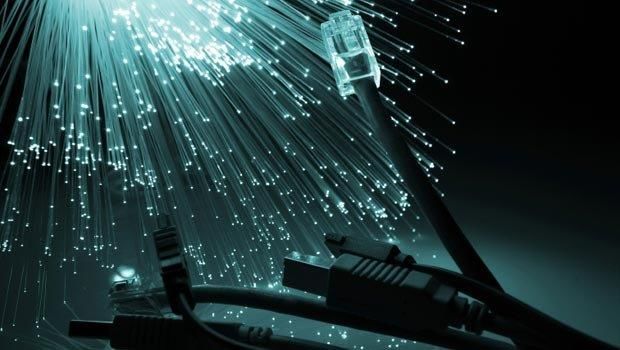
A business case for investment and operation of a submarine fiber cable
About this report
This report evaluates the potential for a company investing in a OUTLINE METRICS
submarine fiber cable with endpoints in south of Norway and north of
The future market measured IP traffic growth
Europe.
in IP traffic growth Profitability
The scope of the report is to analyse the business by: Products and services Capital need
Defining the business case and the services provided by the business The customer segments and Net Present Value
competition
Identify market and costumer segments Market revenue value and
The cost structure growth
Evaluating the market growth and possible market share for the Key resources and activities
services provided by a newcomer The investment and income
Evaluating the profitability and ROI of the business model
HIGHLIGHTS
The overall increase in peak IP traffic is estimated to a factor of 4-5 over the next 5 years
The overall Internet Transit prices has fallen annually by about 15% over the last five years
Offering 100 Gbps fiber cable with a high quality of service would outperform existing competitors
With an investment of MNOK 360 and a market share of 30% the business case shows a positive NPV after 19 years
The new connection gives rise to offering additional services higher up in the value chain, which should be considered to further increase
the ARPU compered to the base case presented
Establishing a new IXP in Kristiansand (KIX) would further increase the international IP traffic in south-west of Norway and should be
considered as part of the business case
It is assumed that a 100 Gbps connection is required to attract global service providers to Norway.
© Iserv Computing 2016 2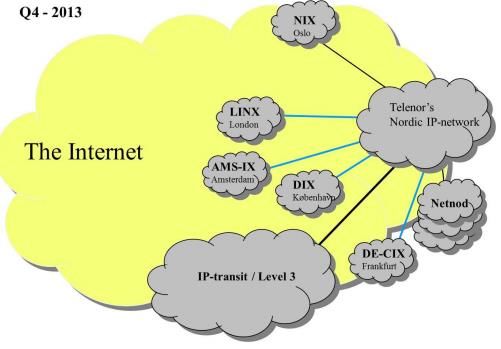
A business case for investment and operation of a submarine fiber cable

Executive Summary
This business case evaluates the potential for a new Internet Service Provider (ISP) operating an international fiber connection from south
of Norway to the European continent. Internet Transit is assumed to be the primary service offered by the newcomer.
With a compound annual growth rate (CAGR) in IP traffic of 50%, an annual fall in IP transit prices of 15% ¹, an annual market growth rate
for IP Transit services in Norway is estimated to 5%.
A new 100 Gbps connection with a capacity of multiple Tbps to the continent from south of Norway with better quality parameters than
existing connections is assumed to achieve a market share of maximum 30% after 5 years in production for IP transit services. This
assumes that the newcomer will take over a substantial share of their customers from existing transit providers.
The overall market value for IP Transit and peering in 2015/2016 is estimated to about MNOK 40 ² and the market is estimated to have an
overall value of MNOK 86 in 2030 and MNOK 230 in 2050 with a 5% annual market growth.
The capital need is estimated to be in the range MNOK 360 to MNOK 400 based on input from independent market actors.
Based on these key parameters and an operational cost of MNOK 7 annually, the analysis shows an accumulated EBITDA of MNOK 620
after 30 years in production and a positive NPV after 19 years with an investment of MNOK 360 and after 22 years with an investment of
MNOK 400. With an external contribution of 20% of the needed capital, a positive NPV is obtained after 18 years with an initial investment
of MNOK 400.
It is recommended that a new transit provider should have a presence in the national Internet Exchange Point (NIX) in Oslo, promote the
establishment of a regional IX in Kristiansand (KIX) and evaluate presence in other cities depending on market segmentation
As part of a more complete business plan one should consider and evaluate offering additional services to the market higher up in the value
chain (e.g. Managed IP) to increase the ARPU.
Lastly, it is believed that a new next generation direct connection to the continent is a prerequisite for attracting global content providers
(e.g. Google) to Norway.

1   IP Transit Prices Continue Falling, Major Discrepancies Remain
2   Statnett submarine Fiber Evaluation, 2015

© Iserv Computing 2016                                                  3
A business case for investment and operation of a submarine fiber cable

Overall Summary

The scope of this report is to evaluate a business case for a company investing in a 100 Gbps submarine fiber cable from south of Norway
to the continent.
The Business and Customer Segment
The core business segment for a thought company – with the working name Sørlandsfiber – is foremost to act as an Internet Service
Provider (ISP) offering Internet Transit (or IP Transit) and peering services primarily to other ISPs and content providers at wavelengths of 10
and 100 Gbps (100G). Other services at this level (e.g. dark fiber) and services at higher levels in the value chain (e.g. Managed IP) are
discussed, but note addressed in the business case.
Existing Infrastructure
The current number of international connections – with a few exceptions not influencing the business case - are 7 cables, 4 from east of
Norway via Sweden (not counting railroad and overhead power supply routes and routes from Trøndelag an Nordland), 2 offshore-specific
cables to Great Britain via installations in the North Sea and 1 (not counting Denmark-Norway 5 & 6) to Denmark from south of Norway.
None of the existing connections are 100G networks according to our best knowledge.
The Technology behind the Service Offered
Wavelength Division Multiplexer (WDM) adoption as used in 100G networks has revolutionized the cost per bit in transport; optical fiber
networks can carry multiple Terabits of data per second at cost points significantly less than a decade ago. It provides a level of scalability
above any other technology in the market, multiplying the fiber capacity in enterprise, access, backhaul, metro and long haul networks.
Traffic growth
The forecasted exponential growth in IP traffic, and thus a growing IP Transit market, is the underlying driving force for investing in
communication infrastructure even with a surplus of capacity in existing infrastructure for long haul traffic.

© Iserv Computing 2016                                                  4

A business case for investment and operation of a submarine fiber cable

Overall Summary cont.

Traffic Growth (cont.)
The overall growth in IP peak traffic is, by Cisco, estimated to grow with a factor of 4.6 during the next five years. The most optimistic
estimates by Analysis Mason, for average traffic growth are by a factor of 6 for a period of six years. Taken peak traffic and other factors into
account, a compound annual growth rate (CAGR) of about 50 percent is expected.
Capacity
Today there is a surplus of capacity in existing infrastructure for long haul traffic. The demand for capacity has grown internationally by
about 50% annually. New services (e.g. IoT) and growth in existing services (e.g. VoD, 4K, CDN) drives the need for more capacity and
increased speed and thus the need for investment in infrastructure. Next generation backbone and long haul access delivering 100G is
expected to take higher market shares at the expense of 10G networks with surplus capacity due to the beneficial characteristics, such as
speed and quality of service, of 100G networks.
Internet Transit Prices
While traffic grows exponentially, Internet Transit prices has fallen steadily for several years. The price has fallen with an average of 15% the
5 last years and is expected to continue this trend in the future at least for existing technology delivering 10 Gbps networks.
Market Turnover Growth
Based on the relative relationship between growth in demand for capacity (50% annually) and fall in transit unit prices (15% annually) a
market turnover growth of 5% annually is a regarded as a conservative estimate.
Return of Investment
For a base case with an initial investment of MNOK 360, 30% market share from year 5 to 18, a 5% average annual increase in overall
market revenue and an annual operational cost of MNOK 7, a positive net present value is obtained after a period of 19 years.

© Iserv Computing 2016                                                  5
A business case for investment and operation of a submarine fiber cable

                 CONTENTS

                 Understanding the Business Case
                 Customer Segments
                 The Driving Forces in IP Traffic Growth
                 Capacity and Traffic Prices
                 Market Turnover Growth
                 Market Value and Market Share Forecast
                 Organization and Competence
                 Forecasting the Return of Investment

© Iserv Computing 2016                                           6
A business case for investment and operation of a submarine fiber cable Understanding the Business Case A company is most often identified by the products and services An illustration of international cables in Norway and Internet Exchange Points offered to the market. Building and operating an international undersea cable to and from Norway is a business that provides access and transport of huge amounts of data over long distances to the market. The business segment for selling data capacity is primarily that of an Internet Service Provider (ISP). This is a business segment with its own ecosystem where capacity and infrastructure access are both sold at fixed price/capacity ratios and/or just exchanged between different ISPs with no, or at a low, cost. In both cases the purpose is to broaden its own network and improving the service to the market. This is actually how the Internet is assembled. ISPs connects or hook up to each others networks either directly or via one or more official exchange points, called an Internet Exchange Point (IX). NIX in Oslo is an example of a national IX. (See sample figure on right). The services are differentiated with different price models based on how the access is offered to the market and type of customers. Typical customers are other ISPs and content providers with a need for fast data transfer transporting large amounts of data. Next, the technology, offered services and the customer segments are discussed in some detail to get a better overview of the business case. © Iserv Computing 2016 7
A business case for investment and operation of a submarine fiber cable

Optic Fiber Technology, Bandwidth and Cost Estimates

The distance for a direct cable is +/- 550 (For NordLink: Tonstad – Wilster 540) kilometers in linear distance. Today, equipment exist from
multiple vendors with transport of 100-Gbps wavelengths over fully uncompensated networks, up to 3000 km (Cisco) of unregenerated
optical spans¹. Cisco claims as of June 2012, that they have shipped over 2 000 100 Gpbs ports and the technology is steadily improving
(claims that they now can span 4 800 km without amplifying the signal)¹.
Several sample business cases exist. Internet2 deployed the first intercontinental 100 Gbps transatlantic link between North America and
Europe in 2013 ². In 2014 the project was expanded to include a second 100 Gbps along with terrestrial redundancy in U.S. and Europe.
The most recent announced project, wit a planned opening in 2018, is Pacific Light Cable Network (PLCN) that will have 12,800 km of fiber
and an estimated cable capacity of 120 Tbps, making it the highest-capacity trans-Pacific route
GCX Global Network is another business case offering bandwidth services up to 100 Gbps around the globe ³ The CLion project may also
serve as a reference for a 100 Gbps connection from Finland to Germany.
As an example technology, Wavelength Division Multiplexer (WDM) adoption as used in 100 Gbps networks has revolutionized the cost per
bit of transport; optical fiber networks can carry multiple Terabits of data per second at cost points unimaginable less than a decade ago. It
provides a level of scalability above any other technology in the market, multiplying the fiber capacity in enterprise, access, backhaul, metro
and long haul networks.
By providing high performance, low latency, and efficient (1 hop) access, a 100 Gbps connection would be the next generation network that
would outperform competitors and thus have the ability to take a considerable market share with business opportunities to deliver services
(big data, CDN …) positioned higher in the value chain over long haul distances.
Details about what communication technology will serve this business case best is an evaluation of technical possibilities and constraints,
balanced with cost, capacity and future demand. A more detailed analysis has to be conducted to estimate the capital need for a 100 Gbps
connection. Based on input from different sources in the market an estimated investment in the range MNOK 360 – 400 is used in the
financial analysis.
¹ Cisco ONS 15454 100 Gbps Coherent DWDM Trunk Card and Cisco Systems demonstrates 100 Gigabit technologies
² Grid and Cloud Computing: Concepts and Practical Implementations
³ GCX Global Network

© Iserv Computing 2016                                                                        8
A business case for investment and operation of a submarine fiber cable

Products and Core Services - Internet Transit and Peering

Internet Transit and to a certain degree peering is the core services offered. Dark fiber should also be considered as part of the portfolio.
However, this is usually a service that requires individual agreements where the customer needs and own market position, to avoid
competition on the same connection, should be considered. This is especially important, when offering a product with superior speed and
quality of service in the market, where the customer may become a competitor with the possibility to offer a product with the same
characteristics as your own product. Dark fiber as a product will not be discussed further, but It is also worth mentioning that a consortium
of investors may be established with part ownership in a new ISP dividing ownership of fiber pairs between them.
The commercial interconnect relationships that allow networks to directly and indirectly connect are referred to as peering and transit
relationships. Peering is when two or more networks interconnect directly with each other to exchange traffic. While many think peering is
“free” to both networks, that’s almost never the case. In its simplest form the parties are given access to each other networks on an equal
basis without any payments between the parties (settlement free). Like transit, there are many types of peering both public and private, and
paid and settlement free. As mentioned, peering is between two networks whereas transit allows you to connect to multiple networks.
Transit is where one network agrees to carry traffic that flows between another network and all other networks connected to it. No single
provider in the market connects directly to all the other networks on the Internet, so any network that provides transit will deliver part of
their traffic indirectly through multiple other transit networks. Transit providers routers lets other networks carry traffic to the network that
has bought the transit and get a fee for that service. In short all the transit provider is doing is allowing multiple networks to exchange traffic
with one another.

© Iserv Computing 2016                                                   9
A business case for investment and operation of a submarine fiber cable

Internet exchange point, Content Delivery Network and Managed IP

An Internet exchange point (IX or IXP) is a physical infrastructure through which Internet service providers (ISPs) and Content Delivery
Networks (CDNs) exchange Internet traffic between their networks.
The primary purpose of an IXP is to allow networks to interconnect directly, via the exchange, rather than through one or more third-party
networks. The advantages of the direct interconnection are numerous, but the primary reasons are cost, latency, and bandwidth. Traffic
passing through an exchange is typically not billed by any party, whereas traffic to an ISP's upstream provider is. The official national IPX is
NIX (1 & 2) which is situated in Oslo. There are regional IPXs in Stavanger, Bergen, Trondheim and Tromsø. Sørlandsfiber should have a
presence in Oslo, evaluate presence in other cities depending on market segmentation and promote the establishment of a regional IXP in
Kristiansand (KIX).
A content delivery network is a globally distributed network of proxy servers deployed in multiple data centers. The goal of a CDN is to serve
content to end-users with high availability and high performance. CDNs serve a large fraction of the Internet content today, including web
objects (text, graphics and scripts), downloadable objects (media files, software, documents), applications (e-commerce, portals), live
streaming media, on-demand streaming media, and social networks ¹.
Most CDNs are operated as an Application Service Provider (ASP) on the Internet (also known as on-demand software or software as a
service (SaaS)).
Content providers such as media companies and e-commerce vendors pay CDN operators to deliver their content to their audience of end-
users. In turn, a CDN pays ISPs, carriers, and network operators for services.
It is expected that a new high performance international connection will transport a large share of data volumes generated by CDNs.
Managed IP are enterprise services provided by network operators, that manage network-centric applications that run over enterprise
customers IP. This is a fast growing market where services are offered from centralized locations distributed around the world boosting
international traffic. Operators offering Managed IP services lease dedicated bandwidth from ISPs and is direct or indirect (via other ISPs) a
market segment for Sørlandsfiber

¹ Content Delivery Network

© Iserv Computing 2016                                                 10
A business case for investment and operation of a submarine fiber cable

                 CONTENTS

                 Understanding the Business Case
                 Customer Segments
                 The Driving Forces in IP Traffic Growth
                 Capacity and Traffic Prices
                 Market Turnover Growth
                 Market Value and Market Share Forecast
                 Organization and Competence
                 Forecasting the Return of Investment

© Iserv Computing 2016                                           11
A business case for investment and operation of a submarine fiber cable
The Market and Customer Segments
For Internet transit and peering, primary target customers are Telenor’s International IP-network
national and international ISPs.
It is not a prerequisite that ISPs own their own infrastructure.
Newcomers renting space with high performance connections
(e.g. InfraGreen, Green Mountain) is a fast growing market with ¹
demand for high capacity.
Typical costumers would be (the list serves as a sample and is far
from exhaustive):
• Telcos - Telenor, Telia Norge
• Power companies – BKK, Lyse (Altibox)
• ISPs – Xfiber, Tampnet, TDC, Broadnet, Telecomputing
• Media - NRK, Schibsted, Arkena, Get, TV2, Netflix
• CDN/ASP – Infragreen, Green Mountain, Basefarm, Evry,
Telecomputing
• International CDN: Google, Softlayer/IBM, Amazon, Microsoft
• Managed IP – Orange, NordVPN, Kvantel
The figure on right serve as an example of a potential customer
and competitor with the largest International IP-network in Norway.
¹ Internet Service Portofolio – Global IP Transit
© Iserv Computing 2016 12A business case for investment and operation of a submarine fiber cable
CONTENTS
Understanding the Business Case
Customer Segments
The Driving Forces in IP Traffic Growth
Capacity and Traffic Prices
Market Turnover Growth
Market Value and Market Share Forecast
Organization and Competence
Forecasting the Return of Investment
© Iserv Computing 2016 13A business case for investment and operation of a submarine fiber cable
The big Picture on the need for Communication Infrastructure
The magnitude of the future growth in IP traffic is the foundation for this business case. The growth will increase the demand for high speed
connections and capacity which again will determine the size of the future market for services like IP Transit. An overview of the future
market as a whole and by technology measured in IP traffic growth forms the basis for estimating the future cash flow for Sørlandsfiber.
The overall increase in IP traffic, the estimated traffic price level and available international capacity are crucial factors for a long term
investment in fiber. To get an overall long term view of traffic growth, both the driving forces assumed today and general assumptions about
the spread and assimilation of information technology in general on a global basis is assumed. This is the foundation for decision making
about investment in communication lines; Nearly all growth in data traffic will influence the economics of fiber line vendors. Below is some
global key figures from Cisco Virtual Network Index (VNI) Forecast indicating that the general growth in data consume – and in traffic – will
be considerable in the short term and there are clear indicators that this trend will be the case in the long run.
¹
¹ VNI Complete Forecast Tool
© Iserv Computing 2016 14A business case for investment and operation of a submarine fiber cable
Global Growth rates in Overall IP Traffic and in Connections
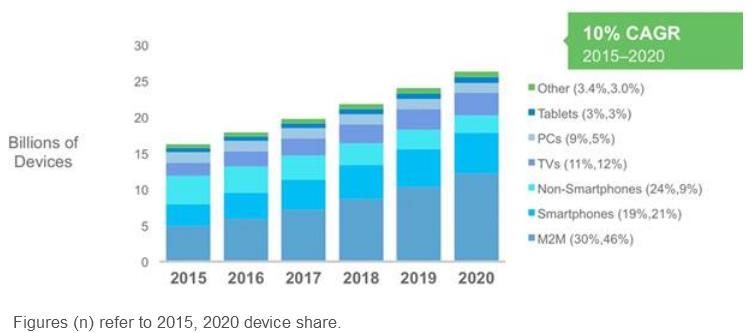
Cisco VNI ¹ estimates that the overall, Internet and Business IP Figure Global Devices and Connections Growth
traffic from 2015 to 2020 will increase;
• by a factor of nearly 3 for Overall IP, with a compound annual
growth rate (CAGR) of 22 percent; and ²
• by a factor of 4.6 for busy hour (peak) Internet traffic;
• at a CAGR of 18 percent for business IP traffic; and
• from 10GB monthly per capita in 2015 to 25GB in 2020.
Analysis Mason² has estimated a growth rate by a factor of 6 from
2015 to 2021 which is about 40% annual growth while Nexia³ in
the Statnett Submarine Fiber Evaluation report estimates an
annual growth rate of 50%.
Cisco also notes that with a peak traffic factor of 4.6 the
underlying capacity requirements may very well have a higher
growth rate than IP traffic.
To give an impression of how unknown or not predicted factors
have influenced demand for capacity, machine-to-machine (M2)
communication - largely due to the Internet of Things (IoT) wave -
may serve as an example.
M2M connections will be the fastest-growing category of devices,
growing nearly by a factor of 2.5 at 20-percent CAGR, to 12.2
billion connections by 2020.
¹ Cisco VMI Global IP Traffic Forecast, 2015-2020
² Fixed network data traffic: Worldwide trends and forecasts 2016–2021 ³ Statnett submarine Fiber Evaluation, 2015
© Iserv Computing 2016 15A business case for investment and operation of a submarine fiber cable
IP Growth Rates in Scandinavia
The Scandinavian countries are mature compared to most countries when it comes to coverage and penetration of fixed broadband (FBB).
Coverage is almost 100% in Norway² and the penetration is 39,5 subscriptions per 100 inhabitant¹. In countries with a high coverage and
penetration the dominant driving force in IP traffic growth are services. New services (e.g. IoT) and growth in existing services (e.g. VoD)
drives the need for more capacity and thus the need for investment in infrastructure.
Cisco’s VNI Index³, which is one of the most extensive surveys, does have figures for Sweden but not for Norway. The utilization of services
and penetration of FBB does not differ much between the two countries. Sweden has 35,7 subscriptions per 100 inhabitant¹. Norway’s
average internet speeds increased by 55 percent (20.1 Mbps (Peak speed: 69 Mbps)) over the previous year, enough to catapult the nation
past Sweden (18.8 Mbps) to claim the fastest internet in Europe⁴.
For Norway, based on figures from Sweden, IP traffic is estimated to grow 2-fold (Peak Internet traffic: 3.6) from 2015 to 2020, with a
compound annual growth rate of 17% (Peak Internet traffic 29%)³.
³
¹ OECD Broadband Portal
² Bredbåndsdekning 2014
³ Cisco VMI Global IP Traffic Forecast, 2015-2020 ⁴ Norway has Europe’s fastest internet: report
© Iserv Computing 2016 16A business case for investment and operation of a submarine fiber cable
The Driving Forces in IP Traffic Growth
200GB per next-generation access (NGA) connection per month Figure 1: Compound Annual Growth Rate (CAGR) in global fixed IP traffic, by type, 2015–2021
is fast becoming commonplace. Operators need to understand 7000
the speed of change — and the scale of the potential 6000
Exabytes per year
unaddressed demand — in order to balance network investment 5000 24%
x6.0 CAGR
appropriately (Source: Analysis Mason). 4000
3000 31%
The main driving forces CAGR
2000
• NGA - Is characterized by a step change in speed and quality of 1000
39%
broadband availability and services 0 CAGR
Providing a high speed submarine fiber connection connected 2015 2016 2017 2018 2019 2020 2021
to NGA fixed broadband (FBB) infrastructure will give a startup Internet Managed IP Multicast TV Mobile data
company a competitive advantage. Due to quality and Source: Analysys Mason
availability this may be a preferred link compared to existing
international lines by ISP’s and network operators • Fixed access has a much flatter cost and price base than
mobile
• Managed IP - Enterprise services provided by network Depending on the rate of traffic growth, fixed may become more
operators, that manage network-centric applications that run cost effective than mobile for delivering traffic to homes, where
over enterprise customers IP. most data is consumed. Understanding the level of traffic at
This market is estimated to an CAGR of 31% . which mobile-only becomes less economic than investing in
• Internet Global system of interconnected computer networks fixed is vital for new fixed investment cases.
that use the TCP/IP linked to devices worldwide (39% CAGR) • 4K resolution on on-premises equipment and multicast TV
Internet traffic growth in general will increase the demand for stimulates growth further.
international communication lines. The increased demand for Content spend is assumed to shift rapidly from pay and linear
capacity is mainly routed through the ISP operation of telco’s, TV to Over-the-top content (OTT - SVoD and TVoD), accelerating
network operators and ISPs the change. New services as download-to-own and virtual
reality (VR) will add even more traffic.
© Iserv Computing 2016 17A business case for investment and operation of a submarine fiber cable
The importance of OTT services as a growth factor in IP traffic WE
- Analysis Mason expect average FBB usage to be close to 400GB per month by 2021
The markets in the Nordic countries and the UK already have Figure 15: Average Internet usage per FBB connection, selected Western Europe markets,
>100GB per connection usage (Source: Analysis Mason) year-end 2015
140 70%
Year-on-year change 2014—2015
GB per FBB connection per month
• Multicast TV (24% CAGR) - Information addressed to a group of 120 60%
destination computers simultaneously utilizing other network
100 50%
elements, such as routers, switches and cellular network base
80 40%
stations.
60 30%
Multicast TV constitutes a considerable proportion (24% CAGR) 40 20%
of the total traffic volume. Duplicating content from network 20 10%
elements nearby a group of consumers reduce the need for 0 0%
long distance traffic. If the source is international the effect France Germany Italy Nordic Spain UK
may be opposite. region
Source: Analysys Mason
• Over-the-top content (OTT) - Internet based streaming services, Figure 16: Average Internet usage per NGA, non-NGA and blended broadband connection,
generally named Video on Demand (VoD) offering different Western Europe, 2014–2021
business models (pay by content (TVOD), subscription (SVoD)) 600
GB per connection per month
• Catch-up services – A kind of OTT offering free Internet 500
television service for viewing TV programs after they have been 400
broadcasted NGA
300
• 4K – High resolution display devices Blended
200
Non-NGA
The greatest single factor in determining this usage is the
100
availability of OTT/catch-up services suitable for the market, and
not the availability or the take-up levels of NGA products. The 0
Nordic region benefits from widespread availability of OTT video. 2014 2015 2016 2017 2018 2019 2020 2021
Source: Analysys Mason
.
© Iserv Computing 2016 18A business case for investment and operation of a submarine fiber cable
CONTENTS
Understanding the Business Case
Customer Segments
The Driving Forces in IP Traffic Growth
Capacity and Traffic Prices
Market Turnover Growth
Market Value and Market Share Forecast
Organization and Competence
Forecasting the Return of Investment
© Iserv Computing 2016 19A business case for investment and operation of a submarine fiber cable Backbone Capacity It is the traffic volume that determines the need for capacity in any backbone net, including Internet transit access to international lines. Almost all IP traffic cross national borders. Almost, because some content are delivered on a national basis and some services as e.g. video on demand (VoD) to some degree use multicasting and content delivery network (CDN) technology to reduce long distance traffic. Loosely, this is achieved by both technologies by distributing local or national copies of content to multiple users. This is a service typically offered by ISPs. Another trend is the growth in cloud based services offered by content providers operating datacenters where national borders are subordinate. They are typically spread around the globe. E.g. estimates point to a growth of 200 new datacenters in Europe the next 4 to 5 years. This trend point to an increased need for Internet transit access. Also note that datacenters located in Norway will generate high volumes of outbound international traffic. It should be noted that content providers more and more exchange traffic in their own network and these content network operators avowedly do not resell their bandwidth, but they do swap capacity ¹. This extends the addressable market pressure and price erosion. For Norway, it is more likely that they would utilize a new direct submarine connection to and from the continent than investing in their own. These trends are hard to estimate. In this business case, the estimated growth rates in IP traffic will correspond proportional to capacity where available capacity always have to exceed the traffic volume to account for increases in average and peak traffic and redundancy. To which extend, is a risk judgment, but 20% excess should give a reasonable risk factor. As a consequence, service providers plan network capacity according to peak rates – and other factors as latency, jitter and so on - rather than average rates. This mean that we should estimate future need for capacity for peak traffic plus excess capacity. Based on the assumptions for excess capacity and forecast of peak IP traffic a compound annual growth rate (CAGR) will be about 50% in Norway. The Nexia¹ and the Peering Report² estimates that the annual unit growth in capacity is around 50%. ¹ Statnett submarine Fiber Evaluation, 2015 ² A Business Case for Peering in 2010 © Iserv Computing 2016 20
A business case for investment and operation of a submarine fiber cable

Traffic Prices

Different price models exists for selling capacity (e.g. 10 GigE port/month), but the common price unit is Mbps/month (megabit per second
per month). In general this is a subtle theme because providers does usually not disclose what they pay for transit.
The Nexia¹ and the Peering Report² assumes that the unit prices has been falling at around 30% annually. The price estimates are with
references to the Peering report from 2010² where unit prices from 2011 to 2015 are estimates. Historical data shows that the unit price
has decreased in average of 14 percent compounded annually (CAGR) between 2012 and 2015³. For future price estimates a decline of
CAGR 15% is assumed in the business case.
The demand for capacity between south west of Norway to the internet exchanges in London, Frankfurt, Amsterdam (the biggest in Europe)
will be more beneficial for a new cable due to an alternative and a more effective route, higher bit rates and better quality parameters such
as lower latency and less jitter (cause loss of transmitted data between network devices). This calls for a higher price than the average
market price and a 10% on average as used in the business case.
Latency is typically (the time a signal use to travel to a destination and back to the source) influenced by the number of hops and the quality
of network components. A direct connection, new hardware and new software calls for lower latency and jitter. These quality parameters
are important for ISPs buying capacity.

¹ Statnett submarine Fiber Evaluation, 2015
² A Business Case for Peering in 2010
³ IP Transit Prices Continue Falling, Major Discrepancies Remain

© Iserv Computing 2016                                                21
A business case for investment and operation of a submarine fiber cable

                 CONTENTS

                 Understanding the Business Case
                 Customer Segments
                 The Driving Forces in IP Traffic Growth
                 Capacity and Traffic Prices
                 Market Turnover Growth
                 Market Value and Market Share Forecast
                 Organization and Competence
                 Forecasting the Return of Investment

© Iserv Computing 2016                                           22
A business case for investment and operation of a submarine fiber cable Market Turnover Growth To estimate the market turnover growth for IP Transit and peering services the following parameters are used: • The overall increase in peak IP traffic is estimated to a factor of 4 over the next 5 years • This growth in IP traffic drives the demand for capacity which is estimated to a growth rate of 50% annually (corrected for existing surplus capacity) • The overall Internet Transit unit prices has fallen annually by about 15% over the last five years • The ratio between an annual growth of 50% and the annual decline in IP Transit unit prices of 15% is assumed to be constant over the period for which the investment analysis is conducted. • Based on the relative relationship between growth in demand for capacity (50% annually) and fall in transit unit prices (15% annually) a market turnover growth of 6% annually in the building period and 5% annually thereafter is assumed to be a conservative estimate that is applied to the analysis. Other uncertain parameters that may influence the annual growth rate is: • With a peak traffic factor of 4 - 6 the underlying capacity requirements may very well have a higher growth rate than IP traffic. • How excess capacity and NGA networks will influence transit prices is a critical parameter with a relatively high degree of uncertainty © Iserv Computing 2016 23
A business case for investment and operation of a submarine fiber cable

                 CONTENTS

                Understanding the Business Case
                Customer Segments
                The Driving Forces in IP Traffic Growth
                Capacity and Traffic Prices
                Market Turnover Growth
                Market Value and Market Share Forecast
                Organization and Competence
                Forecasting the Return of Investment

© Iserv Computing 2016                                           24
A business case for investment and operation of a submarine fiber cable Market Share and Competition A service provider usually need more than one physical international connection due to need for redundancy and multiple international destinations. The total infrastructure for a large account customer will indirect consist of connection points from multiple vendors. A new direct connection to the continent with a high quality of service (QoS) will likely be part of the IP-net portfolio for larger accounts and the preferred connection for smaller ISPs. Due to the mentioned quality parameters and number of hops (e.g. avoid transit through Sweden and/or Denmark ) to international exchange points the connection will probably outperform competitors (e.g. Skagerrak 4 & 5) in most cases. It is more a question of degree of participation in an overall infrastructure than calculating the market share by counting customers value; - The customer base will overlap. Of the 8 international connections from south of Norway, Skagerrak 4 owned by Statnett and Skagerrak 5 owned by TDC/Telenor, are probably the nearest competitors (and potential customers). To which degree the Skagerrak connection owned by TDC/Telenor is active and in production is uncertain. The other 6 connections either go through Sweden (4) or is owned by Tampnet (2) (EQT fund) who delivers connectivity to offshore installations and vessels. Tampnet has indicated that they are considering to move in to the wholesale market, but we have not so far seen any evidence for this. Skagerrak 4 & 5 has their endpoints in north of Denmark while the two Tampnet destinations are in England and Scotland. This reduce the significance of excess capacity (which also is hard to estimate) in existing connections for the benefit of new connections. Nexia¹ estimates a market share of 8% for NordLink in 2023, which is a proportionate share among a total of 12 physical connections counting ring networks as double. The share is difficult to quantify and is at the same a highly significant parameter. We believe that a market share of 25% - 30% is achievable. Before a startup, a detailed market analysis should be conducted.. ¹ Statnett submarine Fiber Evaluation, 2015 © Iserv Computing 2016 25
A business case for investment and operation of a submarine fiber cable

Market Value and Market Share Forecast

• The overall market value for IP Transit and peering in 2015 is estimated to about MNOK 40 ¹
• The market is estimated to have an overall value of MNOK 86 in 2030 and MNOK 230 in 2050
• It is expected that a 100 Gbps connection will achieve a transit price that is about 10% higher in average than the
  current market price
• A market share for a 100 Gbps connection is estimated to 30% obtained 5 years after production startup:
    • Introducing a new Internet Transit service which outperforms existing services with higher bandwidth (100 Gbps)
      and better QoS (latency, jitter) and lesser number of hops to the continent
    • Larger increase in over-the-top (OTT) content (VoD, 4K, big data, CDN, Catch-up services, Multicast TV) of the total
      increase in IP traffic will increase the demand for higher bandwidth
• It is expected that the existing market will respond in a way where this new connection either will be the primary or
  one of, usually 3, redundant connections
• A future terrestrial 100 Gbps connection to Oslo and Stavanger would improve the competition further

¹ Statnett submarine Fiber Evaluation, 2015

© Iserv Computing 2016                                           26
A business case for investment and operation of a submarine fiber cable
CONTENTS
Understanding the Business Case
Customer Segments
The Driving Forces in IP Traffic Growth
Capacity and Traffic Prices
Market Turnover Growth
Market Value and Market Share Forecast
Organization and Competence
Forecasting the Return of Investment
© Iserv Computing 2016 27A business case for investment and operation of a submarine fiber cable
Organization and Competence
• AN ISP operating one direct long-haul connection is a highly automated operation using provisioning and surveillance software with
automatic messaging and alarms
• The most important areas are operations including support and marketing/sales
• Operations
• Tailored to deliver a service, based on market requirements, with high uptime, availability and QoS
• 24/7 surveillance, monitoring and support
• Marketing & Sales
• Introducing a next generation service to the market should present itself as an innovative and disruptive ISP
• With ISPs as customers, sales activities requires technical expertise in addition to sales competence
• Resources
• 2 senior technical resources with civil engineer or informatics at master level in communication
• 2 senior sales resources with experience and insight in communication technology
• Sales resources should have a competence level to perform support as a backup
• A CEO with market and technical insight and a strategic ability to introduce new services higher up in the value chain to the market
• For the investment period the number of resources is constant. A smaller increase in the number of resources has a marginal effect
on the investment analysis.
The overall operational cost is estimated to MNOK 7 annually, including infrastructure maintenance and IX costs.
© Iserv Computing 2016 28A business case for investment and operation of a submarine fiber cable
CONTENTS
Understanding the Business Case
Customer Segments
The Driving Forces in IP Traffic Growth
Capacity and Traffic Prices
Market Turnover Growth
Market Value and Market Share Forecast
Organization and Competence
Forecasting the Return of Investment
© Iserv Computing 2016 29A business case for investment and operation of a submarine fiber cable The Business Case Base Scenario 1: ROI (NPV > 0) 19 years Base Scenario 1: Return on Investment period • Building period: 2018 - 2020 • Production startup: 2021 • Investment: MNOK 360 • Overall market value 2016: MNOK 40 • Overall annual growth in market value: 6% in building period and then 5% • Market share: Increments of 5% to max 30% after 5 years and decrements of 5% to a minimum of 10% after 20 years • Calculation interest: 7% • No. of employees: 5 • Annual operation cost: MNOK 7 Scenario 2: ROI (NPV > 0) 22 years • Investment increased from MNOK 360 to MNOK 400 Scenario 3: ROI (NPV > 0) 22 years • Maximum market share reduced from 30% to 25% © Iserv Computing 2016 30
A business case for investment and operation of a submarine fiber cable

Sensitivity and ROI

The model is based on a step vise decline from 30% in 2040 (20           Impact on variations in investment, market share and external contribution of 20%
years) to 10% market share from 2043 due to new competition
and technology. An annual continued increase in demand and                   The analysis shows, without any external capital
supply until 2050 is assumed which is also considered the end-of-            contribution, a variation in ROI from 19 to 25 years
life of the business case.                                                   depending on variations in the level of investment and
An external capital contribution of 20%, effectively reducing the            market share
investment with the same percentage, is shown in the table on the                                                                Maximum
right but not discussed in this report.                                                   External                                market
The model is most sensitive to the exogenous initial investment            Capital need contibution            Investment         share           NPV > 0
                                                                             MNOK 360                 20 %        MNOK 288               25 %      19 years
and market share parameters which again are influenced by the                MNOK 360                 20 %        MNOK 288               30 %      17 years
estimated 5% market growth for Internet Transit services.                    MNOK 360                  0%         MNOK 360               25 %      22 years
                                                                             MNOK 360                  0%         MNOK 360               30 %      19 years
The table in the figure on the right shows the impact with minor             MNOK 400                 20 %        MNOK 320               25 %      21 years
variations in both the level of investment and the market share.             MNOK 400                 20 %        MNOK 320               30 %      18 years
                                                                             MNOK 400                  0%         MNOK 400               25 %      25 years
The base case shows that with an initial investment of MNOK 360              MNOK 400                  0%         MNOK 400               30 %      22 years
and a market share of 30% a positive NPV is obtained after 19
years.
The worst case scenario is an investment of MNOK 400 and a
market share of 25% resulting in a positive NPV after 25 years.
The accumulated EBITDA after 25 years for the base case is
MNOK 540 and MNOK 620 after 30 years

© Iserv Computing 2016                                              31
A business case for investment and operation of a submarine fiber cable Main Sources • Internet – Whitepapers and articles • Analysis Mason - Fixed network datatraffic: Worldwide trends and forecasts 2016–2021 • Mordor Intelligence – Global Optical Transport Network Market (2016) • Telegeography Statistics • “Nexia” - Statnett Submarine Fiber Evaluation (2015) and references • OECD Broadband Portal • Cisco VNI Index and Equipment • Various International Fiber Cable Projects (e.g. C lion) • Various Norwegian articles related to the business case • Unofficial contacts in the ISP business area © Iserv Computing 2016 32
You can also read