Indian Economy on the Eve of Union Budget 2019-20 (Interim)
←
→
Page content transcription
If your browser does not render page correctly, please read the page content below
Indian Economy on the Eve of Union Budget
            2019-20 (Interim)
                                Steady……strong……fastest moving
                                economy

                              January 2019

            PHD RESEARCH BUREAU
    PHD CHAMBER OF COMMERCE AND INDUSTRY
PHD House 4/2 Siri Institutional Area, August Kranti Marg, New Delhi 110016
       Phone: 91-11-49545454 | Fax: 91-11-26855450, 26863135
          Email: research@phdcci.in | Website: www.phdcci.in
Indian Economy on the Eve of Union Budget 2019-20 (Interim): Steady…strong…fastest moving economy

                                 Table of Contents

 S. No.                               Topic                                   Page No.

     1         Trend of GDP Growth Rate                                             4

     2         Key Economic Indicators                                              5

     3         Current Economic Situation                                           7

     4         Budget Expectations                                                 14

                                  2 | PHD Research Bureau
Indian Economy on the Eve of Union Budget 2019-20 (Interim): Steady…strong…fastest moving economy

Executive Summary

The journey of Indian economy has been promising as the economic growth trajectory
increased from steady during 1960s to 1990s to strong in 2000s and fastest in the 2010s.
The advent of economic reforms has not only enhanced the economic growth, but also
provided a conducive and promising business environment to the citizens of India.

During the last five years, a broad based strength in the economic indicators have been
observed as the growth rate of real GDP has increased from 6.4% in FY2014 to 7.2% in
FY2019. The per capita income has increased from Rs 79,118 in FY2014 to Rs 1,25,397 in
FY2019. Exports growth has increased from 7.8% in FY2014 to 12.1% in FY2019. FDI
inflows have increased from USD36 billion in FY2014 to USD62 billion in FY2019.
Industry growth has increased from 3.8% in FY2014 to 7.8% in FY2019. GFCF growth has
increased from 1.6% in FY2014 to 12.2% in FY2019. Forex reserves have increased from
USD304.2 billion in FY2014 to USD393.2 billion in FY2019.

In the financial market segment, the BSE Sensex has increased from 22386 in FY2014 to
35749 in FY2019. In the business segment, India’s ranking in World Bank’s EODB
rankings has improved from 142nd in 2014 to 77th in 2019. Whereas, inflation has come
down from 9.5% in FY2014 to 3.3% in FY2019. Accordingly, monetary stance softened
from 8% in FY2014 to 6.5% in FY2019.

Going ahead, the economy needs further bold measures to boost the investment
environment and to trigger demand growth to the next level. Time has come to
rationalise the direct taxes starting from reduction in Corporate Tax to a level of 25% for
all corporate tax payers, without any turnover criteria. Further, continuous reforms in
housing and construction sector, increase in public investments in agricultural
infrastructure, credit availability to small and marginal farmers, focus on twin merit
goods of education with skill development and basic health with safety and continuous
reforms in agriculture sector to improve farm productivity and income levels are some
of the areas which should be focused upon in the budget.

                                          3 | PHD Research Bureau
Indian Economy on the Eve of Union Budget 2019-20 (Interim): Steady…strong…fastest moving economy

1.         Trend of GDP Growth Rate

The GDP growth rate trend of Indian economy has changed from being steady to strong
and now to fastest in the world. In 1960s, the growth rate of GDP has been at 4.0%,
which decreased to 2.9% in 1970s. Decade of 1980s recorded a steep rise in the GDP
growth rate, making the average growth rate rise to 5.6%. In 1990s and 2000s, the
average growth rate increase to 5.8% and 7.2% respectively. Over the nine years,
spanning from 2010 to 2019, the average growth rate of India has been recorded at
7.3%.

In the last five years, that is from 2014-15 to 2018-19, the average growth rate of GDP
has been at 7.7%. This has made India the fastest moving emerging economy in the
world economic system. The macro-economic environment has improved significantly
during the last few years. Inflation is contained, fiscal consolidation is on the right path
and foreign investment flows are growing year after year. During the last few years,
government has undertaken a plethora of reforms and corresponding budgetary
allocations for each and every segment of the population to facilitate all-inclusive
growth and sustainable development of the economy.

According to the IMF, India is a bright spot in the global ecosystem and India’s growth is
looking very lucrative in the coming years. India’s growth has surpassed many emerging
and developing economies. Recent IMF data suggests that India is the fastest growing
economy in the world and this trend will continue in 2019 and 2020 also. Recently, NITI
Aayog expects India to grow at 9-10% by 2022-23 which would raise the size of the
economy in real terms from USD2.7 trillion in 2017-18 to nearly USD4 trillion by 2022-
23.

                                     GDP Growth Rate (in Percentage)
      9
                                                                                                       7.7
      8                                                                   7.2           7.3
      7                                                    5.8
                                             5.6
      6
      5         4.0
      4                       2.9
      3
      2
      1
      0
              1960s          1970s         1980s          1990s         2000s       2010-2019 Lat Five Years
     Source: PHD Research Bureau, complied from RBI, Planning Commission (Note: Data of last five years pertains
     to 2014-15 to 2018-19, in which data for 2018-19 are from First Advance Estimates)

                                       4 | PHD Research Bureau
Indian Economy on the Eve of Union Budget 2019-20 (Interim): Steady…strong…fastest moving economy

2.          Key Economic Indicators

During the last 4-5 years, the Indian economy has witnessed remarkable improvement in
macro-economic environment with lead indicators in positive trajectory. The real GDP
growth has increased from 6.4% in 2014 to 7.2% in 2019. Per-capita income at current
prices has exhibited an increasing trend from Rs. 79,118 in 2014 to Rs. 1,25,397 in 2019.
The overall inflation has contained over the last few years as the WPI inflation decreased
from 5.2% in 2014 to 4.4% in 2019 and CPI inflation dipped from 9.5% in 2014 to 3.3% in
2019 which is highly encouraging.

The exports growth has steadily increased from 7.8% in 2014 to 12.1% in 2019 and the
total trade of the country has improved from USD 764.5 billion in 2014 to USD 769.1
billion in 2019. The fiscal deficit as share of GDP declined from 4.5% in 2014 to 3.3% in
2019. Further, India recorded a consistent increase in foreign inflows over the last few
years. The FDI inflows have increased from USD 36.0 billion in 2014 to USD 61.9 billion in
2019. The exchange rate in 2014 was INR/USD 60.5 however it is expected to dwindle
between INR/USD 69-67 in 2019.

Going ahead, the industry growth is expected to increase from 3.8% in 2014 to 7.8% in
2019, while the services growth is also expected to show a positive trend, increasing
slightly from 7.7% in 2014 to 7.9% in 2019. On the flip side, the agriculture sector is
expected to grow at 3.8% in 2019. The public consumption has increased from 0.6% in
2014 to 9.2% in 2019. The GFCF grew from 1.6% in 2014 to 12.2% in 2019.

Other factors which stood in India’s favor are forex reserves, which increased from USD
304.2 billion in 2014 to USD 393.2 billion in 2019, BSE Sensex, which increased from
22386 in 2014 to 35749 in 2019. The average crude oil price (Rs./ 1BBL) decreased from
Rs 5982.3 per barrel in 2014 to Rs 4497.1 per barrel in 2019. The Reserve Bank of India
has reduced repo rate from 8% in 2014 to 6.5% in 2019.

At the global charts, the Indian economy is looking remarkably attractive in comparison
to its performance in the last five years. The improvement in the Ease of Doing Business
from 142nd in 2014 to 77th in 2019 is the significant outcome of the diligent efforts of
the government towards improving business environment in the economy. The
improvement in World Bank’s Ease of Doing Business rankings has been observed
primarily due to significant improvement in dealing with construction permits with
improvement and trading across borders.

                                       5 | PHD Research Bureau
Indian Economy on the Eve of Union Budget 2019-20 (Interim): Steady…strong…fastest moving economy

                        Summary of Economic Indicators
   S. No.      Economic Indicators                     FY14                                       FY19
      1        Real GDP Growth                                          6.4%                     7.2%*
                                                                               %
      2        Per Capita Income at current prices                    79,118                  1,25,397*
      3        WPI Inflation**                                          5.2%                     4.4%º
      4        CPI Inflation!                                           9.5%                     3.3% º
      5        Exports Growth                                           7.8%                    12.1%*
      6        Imports Growth                                          -8.1%                     13% º
      7        Fiscal Deficit as % of GDP                               4.5%                    3.3%*@
      8        Current Account Deficit as % of GDP                      1.7%                     2.7% º
      9        FDI Inflows                                         USD 36.0 bn             USD 61.9 bn▪▪
     10        Exchange Rate (INR/USD)                                 60.50                    69-67 º
     11        Agriculture Growth**                                     5.6%                     3.8%*
     12        Industry Growth**                                        3.8%                     7.8%*
     13        Services Growth**                                        7.7%                     7.9%*
     14        Private Consumption                                      7.3%                     6.4%*
     15        Public Consumption                                       0.6%                     9.2%*
     16        GFCF (Growth)                                            1.6%                    12.2%*
     17        Forex Reserves                                     USD 304.2 bn              USD 393.2 bn⸗
                             #
     18        BSE Sensex                                              22386                   35749***
     19        Crude Oil (Rs./1 BBL)                                  5982.36                  4497.1⸗⸗
     20        Repo Rate                                               8.0%®                    6.5%®®
     21        EODB Ranking                                             142                        77
     22        Total Trade                                        USD 764.5 bn            USD 769.1 bn▪▪
 Source: PHD Research Bureau, compiled from various sources
                                                                                  %
 Note: *According to the First Advance Estimates of National Income, 2018-19; Data pertains to first revised
 estimates of National Income, 2016-17; ** Data pertains to the new base year 2011-12; *@Data pertains to Budget
 Estimates of 2018-19; ^^Data pertains to April-August FY2019; !Data pertains to old base year 2004-05; ® Data
 pertains to 28-01-2014; ®® Data pertains to RBI Monetary Policy, December 2018, ^^^Data pertains to IMF’s WEO
                                                                                        st
 April 2018 forecast; ▪data pertains to April to November 2018-19; ⸗ data pertains to 21 Dec 2018; ⸗⸗average of
 FY19 till 18 Jan 2019; ▪▪data pertains to FY2017-18; º PHD Research Bureau Estimates; # Yearly average; ***data
 pertains to 31 st January 2019.

                                  6 | PHD Research Bureau
Indian Economy on the Eve of Union Budget 2019-20 (Interim): Steady…strong…fastest moving economy

      3.       Current Economic Situation

      3.1       First Advanced Estimates of National Income, 2018-19

      According to First Advanced Estimates of National Income, GDP estimated at 7.2% in
      FY2019 as compared to 6.7% in FY2018. The agriculture sector growth stands at 3.8% in
      FY2019 from 3.4% in FY2018. Manufacturing sector registered a growth of 8.3% in FY2019
      as compared to 5.7% in FY2018. Construction registered a growth of 8.9% in FY19 as
      compared to 5.7% in FY2018. Growth of Trade, Hotel, Transport, and Communication
      has been registered at 6.9% in FY2019 from 8.0% in FY2018. Financial, Real Estate and
      Service registered a growth a 6.8% in FY2019 as compared to 6.6% in FY2018. GVA for
      ‘Public Administration and Defence and Other Services’ is expected to grow by 8.9% as
      compared to growth of 10.0% in 2017-18.

                                First Advance Estimates of GVA at Basic Price
                                                                                                 Percentage
                                               Gross Value Added at Basic Prices
                                                                                                 change     over
                                               in 1st Advance Estimates (in crore)
Industry                                                                                         previous year
                                                        2017-18           2018-19
                                       2016-17                                           2017-18        2018-19
                                                       (PE)              ( IstAE)
1. Agriculture, Forestry &Fishing     17,16,746        17,74,573         18,42,873            3.4           3.8
2. Mining &Quarrying                  3,71,066         3,81,965          3,85,135             2.9           0.8
3. Manufacturing                      20,48,711        21,66,267         23,46,216            5.7           8.3
4. Electricity, Gas, Water
                                      2,44,934         2,62,496          2,87,109             7.2           9.4
Supply& other Utility Services
5. Construction                       8,78,110         9,28,484          10,11,322            5.7           8.9
6. Trade, Hotels, Transport,
Communication and Services            21,37,102        23,07,684         24,67,622            8.0           6.9
related to Broadcasting
7. Financial, Real Estate &
                                      24,37,857        25,99,927         27,75,970            6.6           6.8
Professional Services
8.    Public   Administration,
                                      14,13,103        15,54,759         16,92,530           10.0           8.9
Defence and other Services
 GVA at Basic Price                   1,12,47,629      1,19,76,155       1,28,08,778          6.5           7.0
Source: PHD Research Bureau compiled from CSO and MOSPI

                                          7 | PHD Research Bureau
Indian Economy on the Eve of Union Budget 2019-20 (Interim): Steady…strong…fastest moving economy

3.2     November 2018 core infra grows at 3.5%

The core infrastructure grows at 3.5% in November 2018 as against 4.8% in October
2018. The combined index of Eight Core Industries stood at 128.5 in November, 2018.
This was 3.5% higher as compared to the index of November, 2017. Cement and
Refinery products growth stands at 8.8% and 2.3% respectively in the month of
November 2018. In cumulative terms, core infrastructure industries registered a growth
of 5.1% as during April – November 2018-19 as against 3.5% during April- November
2017-18.

              Sector wise trend in monthly production                                (% growth)
                  Sector                        Weight                Oct 18                 Nov 18
      Crude Oil                                  8.98                  (-)5.0                 (-)3.5
      Natural Gas                                6.88                  (-)0.9                   0.5
      Petroleum Refinery Products               28.04                   1.3                     2.3
      Coal                                      10.33                   11.3                    3.7
      Fertilizer                                 2.63                 (-)11.5                 (-)8.1
      Electricity                               19.85                   10.9                    5.4
      Cement                                     5.37                   18.4                    8.8
      Steel                                      17.92                  2.6                    6.0
      Overall                                     100                   4.8                    3.5
 Source: PHD Research Bureau, compiled from the office of the economic advisor to the Govt. of India

3.3     November 2018 IIP decline to 0.5%

Growth in industry output, as measured in terms of IIP, for the month of November
2018 declined to at 0.5% as compared to 8.4% in October 2018. The growth in the three
sectors mining, manufacturing and electricity in November 2018 stands at 2.7%, (-) 0.4%
and 5.1% respectively over November 2017. Primary goods growth stands at 3.2%,
capital goods growth stands at (-) 3.4%, intermediate goods growth stands at (-) 4.5%,
infrastructure/construction goods growth stands at 5.0%, consumer durables stands
at (-) 0.9% and consumer non-durables growth stands at (-) 0.6% during November 2018
as compared to the previous year.

      Recent growth pattern in IIP                                                      (% growth)
                                           Weight    April-   April- October November
                                            in IIP November November  2018     2018
                                                    2017-18  2018-19
 Mining                                      14.3     3.0      3.7     7.2       2.7
 Manufacturing                               77.6     3.1      5.0     8.2     (-)0.4

                                   8 | PHD Research Bureau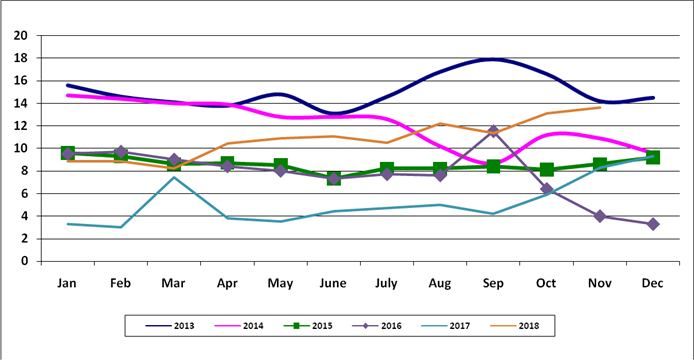
Indian Economy on the Eve of Union Budget 2019-20 (Interim): Steady…strong…fastest moving economy

 Electricity                                 7.9          5.3            6.6          10.8            5.1

 Primary goods                               34.0         3.5            4.8          6.1              3.2
 Capital goods                               8.2          1.3            7.2          17.0           (-)3.4
 Intermediate goods                          17.2         1.1            0.7          1.9            (-)4.5

 Infrastructure/construction goods           12.3          3.9           8.3          8.9              5.0
 Consumer durables                           12.8        (-)1.5          8.2          18.0           (-)0.9
 Consumer non-durables                       15.3          9.6           3.9          8.8            (-)0.6
 Source: PHD Research Bureau, compiled from CSO

3.4      December 2018 CPI inflation falls to 2.19%

The all India general CPI inflation (Combined) for December 2018 (Prov.) falls to 2.19%
from 2.33% in November 2018. The inflation rates for rural and urban areas for
December 2018 (Prov.) are 1.65% and 2.91%, respectively, as compared to 1.71% and
3.12% respectively, for November 2018. Rate of inflation during December 2018 are for
fuel and light (4.54%), housing (5.32%), transport and communication (4.30%),
education (8.38%) and health (9.02%) etc.

      Consumer Price Inflation (Combined)                                               (Percentage)

Source: PHD Research Bureau, compiled from CSO

3.5      December 2018 WPI inflation falls to 3.8%

The WPI inflation falls to 3.8% in December 2018 as compared to 4.64% in November
2018, 5.54% in October 2018, 5.22% in September 2018, 4.62% in August 2018 and
5.27% in July2018. The fall in WPI inflation in the month of December 2018 is attributed
to fall in the price of potato (48.68%), Petrol (1.57%) and LG (6.87%). Build up inflation
rate in the financial year so far was 3.27% compared to a build up rate of 2.21% in the
corresponding period of the previous year. The WPI inflation for manufactured products

                                   9 | PHD Research Bureau
Indian Economy on the Eve of Union Budget 2019-20 (Interim): Steady…strong…fastest moving economy

stands at 3.59% for December 2018 as against 4.21%for November 2018.

       Trend in WPI Inflation                                                             (Y-O-Y)

 Source: PHD Research Bureau, Complied from the office of the Economic Advisor to the Govt. of India

3.6      Gross bank credit grows at 14% in November 2018

Gross bank credit grows at 14% in November 2018 as against 13.1% in October 2018.
The gross bank credit growth stands at 8.5% in November 2017. 2017. On a year-on-
year (y-o-y) basis, non-food bank credit increased by 13.8 in November 2018 as against
13.4% in October 2018. Credit to agriculture and allied activities increased by 7.7% in
November 2018 as against 8% in October 2018. Credit growth to infrastructure,
textiles, chemical and chemical products and all engineering accelerated. However,
credit growth to basic metal & metal product, cement & cement products, gems &
jewellery and paper & paper products contracted/decelerated.

      Monthly trend in growth of gross bank credit (%)                                       (Y-o-Y)

 Source: PHD Research Bureau, compiled from RBI

3.7      Merchandise exports grew by 0.34% and imports declined by 2.44%

India’s exports during December 2018 were valued at USD 27.93 Billion as compared
to USD 27.83 Billion during December 2017 exhibiting a positive growth of 0.34%.

                                  10 | PHD Research Bureau
Indian Economy on the Eve of Union Budget 2019-20 (Interim): Steady…strong…fastest moving economy
India’s imports during December 2018 were valued at USD 41.01 Billion (Rs
2,90,032.95 crore) which was 2.44% lower in Dollar terms and 7.41% higher in Rupee
terms over the level of imports valued at USD 42.03 Billion (Rs.2,70,015,44 crore) in
December 2017. The major commodity groups of export showing positive growth over
the corresponding month of last year are Petroleum Products (13.18%); Organic &
Inorganic Chemicals (5.5%); Plastic & Linoleum (20.18%); RMG of all Textiles (2.77%)
and Electronic Goods (50.81%).
Merchandise Apr- May- June- July- Aug- Sept- Oct- Nov- Dec-
18 18 18 18 18 18 18 18 18
Exports (USD billion) 25.91 28.86 27.7 25.77 27.84 27.95 26.98 26.50 27.93
Growth (%) 5.17 20.18 17.57 14.32 19.21 -2.15 17.86 0.8 0.34
Imports (USD billion) 39.63 43.48 44.3 43.79 45.24 41.93 44.11 43.17 41.01
Growth (%) 4.6 14.85 21.31 28.81 25.41 10.45 17.62 4.31 2.44
Trade Balance (USD billion) -13.72 -14.62 -16.6 -18.02 -17.39 -13.98 -17.13 -16.67 -13.08
Source: PHD Research Bureau, compiled from Ministry of Commerce and Industry, Govt of India
3.8 India’s CAD increased to 2.9% of GDP in Q2 of 2018-19 from 1.1% of GDP in Q2
of 2017-18
India’s current account deficit (CAD) stands at US$ 19.1 billion (2.9 per cent of GDP) in
Q2 of 2018-19 increased from US$ 6.9 billion (1.1 per cent of GDP) in Q2 of 2017-18 and
US$ 15.9 billion (2.4 per cent of GDP) in the preceding quarter. The widening of the CAD
on a year-on-year (y-o-y) basis was primarily on account of a higher trade deficit at US$
50.0 billion as compared with US$ 32.5 billion a year ago.Net services receipts increased
by 10.2 per cent on a y-o-y basis mainly on the back of a rise in net earnings from
software and financial services. Private transfer receipts, mainly representing
remittances by Indians employed overseas, amounted to US$ 20.9 billion, increasing by
19.8 per cent from their level a year ago.
Major Items of India's Balance of Payments (BoP)
(US$ Billions)
July-September 2018 P July-September 2017 April-September 2018- April-September 2017-
19P 18
Credit Debit Net Credit Debit Net Credit Debit Net Credit Debit Net
A. Current 160.0 179.1 - 145.5 152.4 -6.9 315.7 350.7 - 285.4 307.3 -21.9
Account 19.1 35.0
1. Goods 83.4 133.4 - 76.1 108.5 - 166.8 262.6 - 149.2 223.6 -74.4
50.0 32.5 95.8
Of which:
POL 12.1 35.2 - 9.0 23.7 - 23.5 69.9 - 16.5 46.5 -30.0
23.1 14.6 46.5
11 | PHD Research BureauIndian Economy on the Eve of Union Budget 2019-20 (Interim): Steady…strong…fastest moving economy
2. Services 50.1 29.8 20.2 47.4 29.0 18.4 98.3 59.3 38.9 93.3 56.6 36.7
3. Primary 5.6 14.3 -8.7 4.5 13.0 -8.6 11.0 25.5 - 9.2 23.6 -14.4
Income 14.6
4. 20.9 1.5 19.4 17.5 1.8 15.7 39.7 3.3 36.4 33.7 3.5 30.2
Secondary
Income
B. Capital 131.1 112.9 18.2 147.1 139.7 7.4 273.7 238.8 34.9 302.8 279.9 22.9
Account
and
Financial
Account
Of which:
Change in 1.9 0.0 1.9 0.0 9.5 -9.5 13.2 0.0 13.2 0.0 20.9 -20.9
Reserves
(Increase (-
)/Decrease
(+))
C. Errors & 0.9 0.9 0.4 -0.4 0.1 0.1 1.0 -1.0
Omissions
(-) (A+B)
Source: RBI P: Preliminary. Note: Total of subcomponents may not tally with aggregate due to rounding off.
3.9 ECBs Stand at USD 1.9 billion During November 2018
Indian firms have raised about USD 1.9 billion through external commercial borrowing
(ECBs) by automatic and approval route in November 2018 as against USD 1.4 billion in
October 2018. The borrowings stood at USD 3.02 billion in November 2017. India has
received gross ECBs worth around USD 359 billion between FY2001 and FY2019 (till
November 2018). The lion’s share in ECBs during the month of November 2018 is held
for On-lending/Sub-lending by about 37% of the total borrowings followed by general
corporate purpose by around 35% and working capital purpose at about 16%.
External commercial borrowings since August 17 (USD billion)
Source: PHD Research Bureau, Complied from Note: ECB contains both automatic and approval routes
12 | PHD Research BureauIndian Economy on the Eve of Union Budget 2019-20 (Interim): Steady…strong…fastest moving economy
3.10 November 2018 fiscal deficit stands at 114.8 % of actual to BEs
The gross fiscal deficit of the central government stands at 114.8% of the actual budget
estimates (BEs) at the end of November 2018 as compared to 112% of the actuals to
budget estimates in the corresponding period of the previous year. The primary deficit was
registered at 759.9% of the actuals to budget estimates at the end of November 2018 as
compared to 1288.9% of the actuals to budget estimates during corresponding period of
the previous year. The revenue receipts at the end of November 2018 of the central
government stands at 50.4% of the actuals to budget estimates as compared with
53.1% of the actuals to budget estimates at the end of November 2017.
Differentials in use of fiscal deficit space at the end of Oct’ 2018 vis-à-vis Oct’ 2017
(in %)
Source: PHD Research Bureau, compiled from Government of India, Accounts, Government of India
3.11 Direct Tax collections at Rs. 8.74 lakh crore for FY 2018-19 up to December
The provisional figures of gross Direct Tax collections up to December, 2018 are at Rs.
8.74 lakh crore, which is 14.1% higher than the gross collections for the corresponding
period of last year. The net Direct Tax collections represent 64.7% of the total Budget
Estimates of Direct Taxes for FY 2018-19 (Rs. 11.50 lakh crore).
The growth rate of gross collections for CIT is 14.8%, while that for PIT (including STT) is
17.2%. After adjustment of refunds, the net growth in CIT collections is 16.0% and that
in PIT collections is 14.8%.Advanced tax collection stands at Rs. 3.64 lakh crore, which is
14.5% higher than the Advance Tax collections during the corresponding period of last
year. The growth rate of Corporate Advance Tax is 12.5% and that of PIT Advance Tax is
23.8%.
13 | PHD Research BureauIndian Economy on the Eve of Union Budget 2019-20 (Interim): Steady…strong…fastest moving economy
4. Budget Expectations
Continuous reforms in agriculture sector to improve farm productivity and income
levels, increased disposable income of the middle class vis-a-vis rationalisation of the
direct taxes would give a further boost to the overall economic growth of the country.
At the global charts, the Indian economy is looking remarkably attractive due to its
performance in the last five years. The improvement in the Ease of Doing Business from
142nd in 2014 to 77th in 2019 is the significant outcome of the diligent efforts of the
government towards improving the business environment in the economy. What needs
to be accelerated is a much greater interaction with Indian Businesses at the highest
level in the Government of India. At this juncture, the economy needs further bold
measures to boost the investment environment and to trigger demand growth to the
next level.
The macro-economic environment has improved significantly during the last four years.
Inflation has been contained remarkably, fiscal consolidation is on the right path and
foreign investment flows are growing year after year. During the last four years, the
government has been making continuous efforts to uplift industrial growth which has
increased significantly from 3.8% in FY14 to 5.5% in FY18 and is expected to be 7.8% in
FY19. To bolster the industrial sector further, double digit manufacturing growth with
increased participation of manufacturing sector MSMEs would create maximum
opportunities for employment for the growing young workforce in India.
Land reforms such as increase in the lease period and creation of land banks for the use
of industry should be strengthened. Further reforms in labour laws and an emphasis on
productivity are required to facilitate the manufacturing firms to enhance their
competitiveness, although “Tenure Employment” is a great step forward. Continuous
reforms in housing and construction sector would definitely create employment
opportunities for millions of unskilled, semi skilled and skilled workforce. It should be
noted that urbanisation has potential to shift disguised unemployment in agriculture
sector to construction activities.
The increase in public investments in agricultural infrastructure would attract private
investments in cold storage, warehousing and supply chain of agriculture produce in
order to reduce food wastages and get them to urban citizens at moderate rates. It shall
also raise the returns to agriculturists. To facilitate infrastructural development,
strengthening of integrated public transport projects such as roadways, railways and
waterways would reduce the logistics and time costs to businesses and enhance
employment creation. Privatisation of railway and road transport on the lines on
aviation industry is the answer for the future. Tourism is the largest investment market
14 | PHD Research BureauIndian Economy on the Eve of Union Budget 2019-20 (Interim): Steady…strong…fastest moving economy
in India, which has the larger number of stakeholders even than the stock exchanges in
India. It is time to give this a further boost in private sector investment by not
considering it a luxury.
In India, start-ups have made good strides to foster a new business environment. Going
ahead, government should provide an exemption from angel tax to the start-ups to
attract more and more innovative minds in entrepreneurship. Further, focus on twin
merit goods of education with skill development and basic health with safety should
continue with a longer term vision.
Consistent indirect tax revenue growth, along with reduction in GST rates by the
government indicates that the tax base is widening and economic activity is rapidly
expanding in India. Time has come to rationalise the direct taxes starting from reduction
in Corporate Tax to a level of 25% for all corporate tax payers, without any turnover
criteria. This will provide a boost to economic growth and would result in widening of
the Direct Tax net, enhance collections and promote compliance further.
Income up to Rs. 3.5 lakhs should be considered for tax exemption, instead of the
present Rs. 2.5 lakhs. The maximum personal income tax rate should be towards 25% to
increase the personal disposable income which will boost demand in the economy. The
Maximum marginal slab should also be raised to Rs. 15 Lacs instead of Rs. 10 Lacs. It is a
settled principle that reduction in tax rate widens the tax net and promotes compliance.
For all the above sectors to come of age, India needs to be a more tax compliant nation.
For this reason, it is time to invest in Big Data analytics to ensure that all potential tax
payers pay all the taxes that they should be paying. And let us not do it through a raid-
raj or tax terrorism, but with the help of data mining and making an example of major
offenders and doing away with exemptions.
15 | PHD Research BureauIndian Economy on the Eve of Union Budget 2019-20 (Interim): Steady…strong…fastest moving economy
STUDY TEAM
Dr. S P Sharma
Chief Economist
Ms. Megha Kaul Ms. Kritika Bhasin Ms. Shivani Mehrotra Mr. Sanjay Kumar Sharma
Economist Research Officer Research Associate Research Trainee
Disclaimer
“Indian Economy on the Eve of Union Budget 2019-20 (Interim): Steady…Strong…Fastest
Moving Economy” is prepared by PHD Research Bureau. This report may not be reproduced,
wholly or partly in any material form, or modified, without prior approval from the Chamber.
It may be noted that this report is for information purposes only. Though due care has been
taken to ensure accuracy of information to the best of the PHD Chamber’s knowledge and
belief, it is strongly recommended that readers should seek specific professional advice before
taking any decisions.
Please note that the PHD Chamber of Commerce and Industry does not take any responsibility
for outcome of decisions taken as a result of relying on the content of this report. PHD Chamber
of Commerce and Industry shall in no way, be liable for any direct or indirect damages that may
arise due to any act or omission on the part of the Reader or User due to any reliance placed or
guidance taken from any portion of this report.
Copyright 2019
PHD Chamber of Commerce and Industry
ISBN No. 978-93-84145-68-2
ALL RIGHTS RESERVED
No part of this publication including the cover, shall be reproduced, stored in a retrieval system, or
transmitted by any means, electronic, mechanical, photocopying, recording or otherwise, without the
prior written permission of, and acknowledgement of the publisher (PHD Chamber of Commerce and
Industry).
16 | PHD Research BureauIndian Economy on the Eve of Union Budget 2019-20 (Interim): Steady…strong…fastest moving economy
PHD Research Bureau
PHD Research Bureau; the research arm of the PHD Chamber of Commerce and Industry was
constituted in 2010 with the objective to review the economic situation and policy
developments at sub-national, national and international levels and comment on them in order
to update the members from time to time, to present suitable memoranda to the government
as and when required, to prepare State Profiles and to conduct thematic research studies on
various socio-economic and business developments.
The Research Bureau has been instrumental in forecasting various lead economic indicators
national and sub-national. Many of its research reports have been widely covered by media and
leading newspapers. Recently, the Research Bureau has undertaken various policy projects of
Government of India including Framework of University-Industry Linkages in Research assigned
by DSIR, Ministry of Science & Technology, Study on SEZ for C&AG of India, Study on Impact of
Project Imports under CTH 9801 for C&AG of India, among others.
Research Activities Comments on Economic Newsletters Consultancy
Developments
Research Macro Economy Economic Trade &
Studies Affairs Investment
Newsletter Facilitation
(EAC) Services (TIFS)
State Profiles States Global
Development Economic
Monitor
(GEM)
Impact Infrastructure Trade &
Assessments Investment
Facilitation
Services (TIF)
Thematic Foreign exchange State
Research market Development
Reports Monitor
(SDM)
Releases on Global Economy Forex and
Economic & International FEMA
Development Trade Newsletter
17 | PHD Research BureauIndian Economy on the Eve of Union Budget 2019-20 (Interim): Steady…strong…fastest moving economy
Studies Undertaken by PHD Research Bureau
A: Thematic research reports 26. Participated in a survey to audit SEZs in India
1. Comparative study on power situation in with CAG Office of India (November 2014)
Northern and Central states of India 27. Role of MSMEs in Make in India with reference
(September2011) to Ease of Doing Business in Ghaziabad (Nov
2. Economic Analysis of State (October 2011) 2014)
3. Growth Prospects of the Indian Economy, Vision 28. Exploring Prospects for Make in India and Made
2021 (December 2011) in India: A Study (January 2015)
4. Budget 2012-13: Move Towards Consolidation 29. SEZs in India: Criss-Cross Concerns (February
(March 2012) 2015)
5. Emerging Trends in Exchange Rate Volatility (Apr 30. Socio-Economic Impact of Check Dams in Sikar
2012) District of Rajasthan (February 2015)
6. The Indian Direct Selling Industry Annual Survey 31. India - USA Economic Relations (February 2015)
2010-11 (May 2012) 32. Economy on the Eve of Union Budget 2015-16
7. Global Economic Challenges: Implications for (February 2015)
India (May 2012) 33. Budget Analysis (2015-16)
8. India Agronomics: An Agriculture Economy 34. Druzhba-Dosti: India's Trade Opportunities with
Update (August 2012) Russia (April 2015)
9. Reforms to Push Growth on High Road 35. Impact of Labour Reforms on Industry in
(September 2012) Rajasthan: A survey study (July 2015)
10. The Indian Direct Selling Industry Annual Survey 36. Progress of Make in India (September 2015)
2011-12: Beating Slowdown (March 2013) 37. Grown Diamonds, A Sunrise Industry in India:
11. Budget 2013-14: Moving on reforms (March Prospects for Economic Growth (November
2013) 2015)
12. India- Africa Promise Diverse Opportunities 38. Annual survey of Indian Direct Selling Industry
(November 2013) 2014-15 (December 2015)
13. India- Africa Promise Diverse Opportunities: 39. India’s Foreign Trade Policy Environment Past,
Suggestions Report (November 2013) Present and Future (December 2015)
14. Annual survey of Indian Direct Selling Industry- 40. Revisiting the emerging economic powers as
2012-13 (December 2013) drivers in promoting global economic
15. Imperatives for Double Digit Growth (December growth(February 2016)
2013) 41. Bolstering MSMEs for Make in India with special
16. Women Safety in Delhi: Issues and Challenges to focus on CSR (March 2016)
Employment (March 2014) 42. BREXIT impact on Indian Economy (July 2016)
17. Emerging Contours in the MSME sector of 43. India’s Exports Outlook (August 2016)
Uttarakhand (April 2014) 44. Ease of Doing Business : Suggestive Measures
18. Roadmap for New Government (May 2014) for States (October 2016)
19. Youth Economics (May 2014) 45. Transforming India through Make in India, Skill
20. Economy on the Eve of Union Budget 2014-15 India and Digital India (November 2016)
(July 2014) 46. Impact of Demonetization on Economy,
21. Budget 2014-15: Promise of Progress (July 2014) Businesses and People (January 2017)
22. Agronomics 2014: Impact on economic growth 47. Economy on the eve of Budget 2017-18 (January
and inflation (August 2014) 2017)
23. 100 Days of new Government (September 2014) 48. Union Budget 2017-18: A budget for all-inclusive
24. Make in India: Bolstering Manufacturing Sector development (January 2017)
(October 2014) 49. Annual Survey of Indian Direct Selling Industry
25. The Indian Direct Selling Industry Annual Survey 2015-16 (February 2017)
2013-14 (November 2014)
18 | PHD Research BureauIndian Economy on the Eve of Union Budget 2019-20 (Interim): Steady…strong…fastest moving economy
50. Worklife Balance and Health Concerns of 73. Rajasthan: The State Profile (April 2011)
Women: A Survey (March 2017) 74. Uttarakhand: The State Profile (June 2011)
51. Special Economic Zones: Performance, Problems 75. Punjab: The State Profile (November 2011)
and Opportunities (April 2017) 76. J&K: The State Profile (December 2011)
52. Feasibility Study (socio-Economic Survey) of 77. Uttar Pradesh: The State Profile (December
Ambala and Rohtak Districts in Haryana (March 2011)
2017) 78. Bihar: The State Profile (June 2012)
53. Goods and Services (GST): So far (July 2017) 79. Himachal Pradesh: The State Profile (June 2012)
54. Reshaping India-Africa Trade: Dynamics and 80. Madhya Pradesh: The State Profile (August
Export Potentiality of Indian Products in Africa 2012)
(July 2017) 81. Resurgent Bihar (April 2013)
55. Industry Perspective on Bitcoins (July 2017) 82. Life ahead for Uttarakhand (August 2013)
56. Senior Housing: A sunrise sector in India (August 83. Punjab: The State Profile (February 2014)
2017) 84. Haryana: Bolstering Industrialization (May 2015)
57. Current state of the economy (October 2017) 85. Progressive Uttar Pradesh: Building Uttar
58. Equitable finance to fulfill funding requirements Pradesh of Tomorrow (August 2015),
of Indian Economy (October 2017) 86. Suggestions for Progressive Uttar Pradesh
59. The Wall of Protectionism: : Rise and Rise of (August 2015)
Protectionist Policies in the Global Arena, 87. State profile of Telangana- The dynamic state of
(November 2017) India (April 2016)
60. India-Israel Relations: Building Bridges of 88. Smart Infrastructure Summit 2016-
Dynamic Trade(October 2017) Transforming Uttar Pradesh (August 2016)
61. Role of Trade Infrastructure for Export Scheme 89. Smart Infrastructure Summit 2016-Transforming
(TIES) in Improving Export Competitiveness Uttar Pradesh : Suggestions for the State
(November 2017) Government (August 2016)
62. India - China Trade Relationship: The Trade 90. Rising Jharkhand: An Emerging Investment Hub
Giants of Past, Present and Future (January (February 2017)
2018) 91. Punjab: Roadmap for the New Government
63. Analysis of Trade Pattern between India and Suggestions for the Industrial and Socio-
ASEAN(January 2018) Economic Development – Focus MSMEs ease of
64. Union Budget 2018-19 – (February 2018) doing business (May 2017)
65. Ease of Doing Work for Women: A survey of 92. Prospering Himachal Pradesh: A Mountain of
Delhi NCR (February 2018) Opportunities (August 2017)
66. Restraining Wilful Defaults: Need of the hour for 93. Kashmir: The way forward (February 2018)
Indian Banking System (March 2018) 94. Analysis of State Budgets for 2018-19: Select
67. Impact of GST on Business, Industry and Sates (March 2018)
Exporters (April 2018) 95. Rising Uttar Pradesh One District One Product
68. India – Sri Lanka Bilateral Relations: Reinforcing Summit (August 2018)
trade and investment prospects (May 2018) 96. Rajasthan: Steady Strides into the Future-
69. Growth Prospects of the Indian Economy: Road Emerging Growth Dynamics and the Way
to US $5 Trillion Economy(May 2018) Forward (September 2018)
70. India's Free Trade Agreements Dynamics and 97. Rising Jharkhand: Economic Profile (January
Diagnostics of Trade Prospects(May 2018) 2019)
71. India – UK Trade Relations and Societal Links: 98. Rising Jharkhand: Skill Development to Spur
Way Forward (June 2018) Socio-Economic Growth (January 2019)
72. Rural Economy: Road to US $5 Trillion
Economy(September 2018)
B: State profiles
19 | PHD Research BureauTeam, PHD Research Bureau
Dr. S P Sharma
Chief Economist
Email: spsharma@phdcci.in
Ms. Megha Kaul
Economist Ms. Surbhi Sharma
Developments in Economic Policy & Business Associate Economist
Environment & Economic Affairs Committee Developments in Trade Policy, Banking and
Ms. Kritika Bhasin Financial Markets & Foreign Trade and
Research Officer Investment Committee
Macroeconomic Developments in National
and International Arena
& Ease of Doing Business Committee
Ms. Bhawna Kakkar
Ms. Shivani Mehrotra Research Associate
Research Associate Trade and Investment Facilitation Services
States, Agriculture & Rural Developments & (TIFS)
Task Force on SMEs in the Services Sector
Mr. Sonu Kumar Sah
Mr. Sanjay Kumar Sharma Research Trainee
Research Trainee Data Mining on Foreign Trade
Data Mining on Economy
Ms. Sunita Gosain, Secretarial Assistant
Associated Research Scholars
Ms. Ashima Dua,
Research Scholar
International TradeIndian Economy on the Eve of Union Budget 2019-20 (Interim): Steady…Strong…Fastest Moving Economy
21 | PHD Research BureauYou can also read