Investor Presentation - For the quarter ended June 2021 3rd August 21 - Tata Consumer Products

Page created by Lee Mccormick
 
CONTINUE READING
Investor Presentation - For the quarter ended June 2021 3rd August 21 - Tata Consumer Products
Investor
Presentation
For the quarter ended June 2021

3rd August 21
Investor Presentation - For the quarter ended June 2021 3rd August 21 - Tata Consumer Products
Disclaimer
Certain statements made in this presentation relating to the Company’s objectives, projections, outlook, expectations, estimates,
among others may constitute ‘forward-looking statements’ within the meaning of applicable laws and regulations. Actual results
may differ from such expectations, projections etc., whether express or implied. These forward-looking statements are based on
various assumptions, expectations and other factors which are not limited to, risk and uncertainties regarding fluctuations in
earnings, competitive intensity, pricing environment in the market, economic conditions affecting demand and supply, change in
input costs, ability to maintain and manage key customer relationships and supply chain sources, new or changed priorities of
trade, significant changes in political stability in India and globally, government regulations and taxation, climatic conditions,
natural calamity, commodity price fluctuations, currency rate fluctuations, litigation among others over which the Company does
not have any direct control. These factors may affect our ability to successfully implement our business strategy. The company
cannot, therefore, guarantee that the ‘forward-looking’ statements made herein shall be realized. The Company, may alter, amend,
modify or make necessary corrective changes in any manner to any such forward looking statement contained herein or make
written or oral forward-looking statements as may be required from time to time on the basis of subsequent developments and
events.

                                                                                                                                     2
Investor Presentation - For the quarter ended June 2021 3rd August 21 - Tata Consumer Products
Agenda

Executive summary       Performance overview     Progress against strategic
                                                 priorities

Macro environment       Business performance –   Business performance
                        India                    – International

Financial performance   Outlook
Investor Presentation - For the quarter ended June 2021 3rd August 21 - Tata Consumer Products
We are Tata Consumer Products
                                                                                            In a nutshell

                                                                                            Integrated F&B company         #2 branded tea player
                                                                                            with rich heritage of Tata,    globally
                                                                                            aspiring for a larger share
                                                                                            of the FMCG World

                                                                                            ₹ 11.6K crore consolidated     Reach to almost 200mn
                                                                                            revenue in FY21 with current   households in India and
                                                                                            market cap of ~₹70k Cr.        distribution to ~2.5mm retail
                                                                                                                           outlets

Largest salt brand in India   2nd Largest tea brand in      4th largest tea brand in UK &
                              India                         largest tea brand in Canada

                                                                                            Among the top 10 F&B           ~2900 employees worldwide
4th largest R&G coffee        National brand                #1 natural mineral water        companies in India
brand in USA                  in pulses, spices and mixes   brand in India

                                                                                                                                                           4
Investor Presentation - For the quarter ended June 2021 3rd August 21 - Tata Consumer Products
Executive Summary
    During the quarter, Consolidated Revenue grew 11% YoY despite a challenging operating environment and a high base.

    Despite a severe second wave of COVID, India business performed well while International markets saw a decline owing to pantry loading in the
     base quarter.

    Overall, India business1 grew 25% led by

        o India Beverages2 business growth of 28%, with 3% volume growth

        o India Foods business growth of 20%, with 17% volume growth

    International business declined 13%, with an underlying (constant currency) decline of 16%3, cycling an elevated base driven by pantry loading.

    EBITDA margin for the quarter was 13.4%, up 300 bps QoQ, but down 452bps YoY, driven by higher A&P investments in the India business in the
     current quarter and low-cost tea inventory that benefitted the base quarter.

    Group net profit declined 42% YoY, however, adjusted for exceptional items, it declined 27%.

    We continued to invest behind our brands to drive long term growth and we gained market share in both the core categories of tea and salt in India.

    We now have a harmonized Pan-India distribution system and have substantially completed the integration of Soulfull.

    We continue streamline operations & driving synergies, including network optimization in India & simplification of International business.

1 Includes  India beverages & India Foods business, including NourishCo.
2 Including NourishCo, but volume doesn’t include Nourishco volumes
3 Like to like, adjusted for the impact of exit from International Foodservice business, the decline was 9% (12% in constant currency terms)

                                                                                                                                                       6
Investor Presentation - For the quarter ended June 2021 3rd August 21 - Tata Consumer Products
COVID-19 update - India
    Second wave vs first wave                                        Business Continuity                                        Supply Chain
•      Widespread impact across rural/hinterland                 •    All factories and plantations were operational            •   Secured raw materials and packaging supply chains;
                                                                                                                                    Ongoing risk management to ensure supply continuity
•      More infections in our own /extended ecosystem            •    Stringent guidelines and Covid SOP implemented to
                                                                      ensure health & safety of employees                       •   Re-alignment of sales teams to reduce exposure.
•      No pantry loading unlike last year                                                                                           Tele-marketing deployed aggressively
                                                                 •    Continued “Work from Home” where possible
•      Restricted market opening timings.
                                                                 •    C.80% of Starbucks stores operational across India,
•      Disruption in last mile logistics                              with restricted dine-in and store operating hours 1

    Innovative ways of working                                   Employee well-being                                            Social initiatives
•      D2C – Tatanutrikorner, Soulfull, Sonnets, Tata Tea 1868   • Covering vaccination costs for employees and their family    • Covering vaccination costs for business partners in the
                                                                   members, vaccination drives organized at multiple              extended ecosystem.
•      Starbucks – increased thrust on delivery                    locations.
                                                                                                                                • Iss baar #Sabkeliye Jaago Re campaign asking people
•      Remote third-party audits and remote management of        • Multiple health & wellbeing initiatives covering physical,     to help support staff get vaccinated
       quality checks                                              emotional and mental well being.

•      Virtual on-boarding and trainings for new joiners         • Heightened focus on employee recognition.

1 As   of 30th June 2021.
                                                                                                                                                                                            7
Investor Presentation - For the quarter ended June 2021 3rd August 21 - Tata Consumer Products
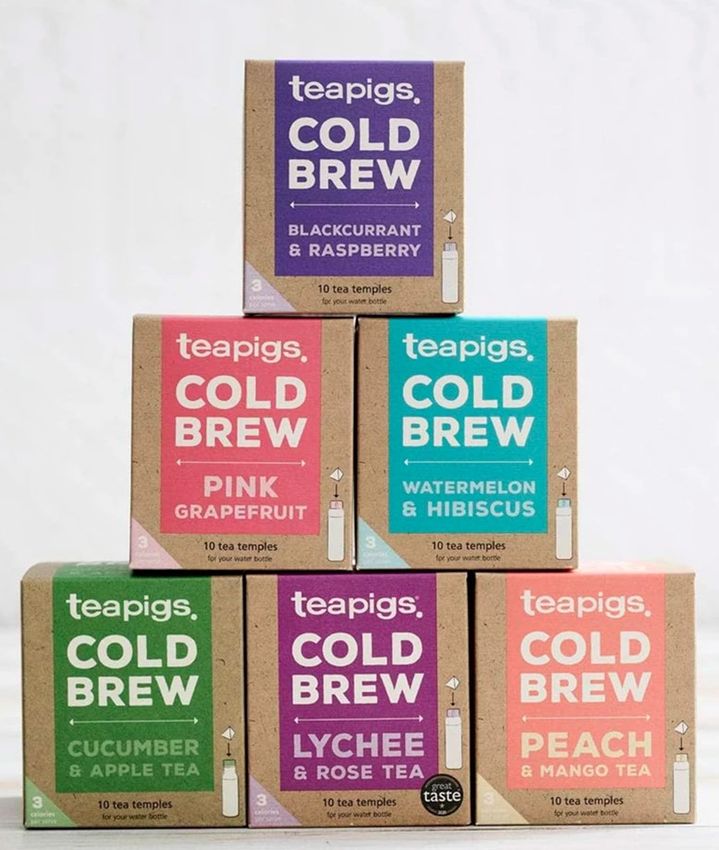
Key Businesses snapshot – Q1FY22

                                                                                                                                 International Beverages

In ₹ Cr                                    India Beverages                             India Foods                      US Coffee                       International Tea                   Tata Coffee     Consolidated#
(unless specified)                                                                                                                                                                        (incl. Vietnam)

Revenue                                            1,267                                      705                          296                              472                               241             3,008

Revenue Growth                                     28%                                       20%                           -18%                             -3%                               5%               11%
Constant currency growth                                                                                                   -15%                             -10%                              6%               10%

Volume Growth                                      3%                                        17%                           -16%                             -9%                               -6%

        Key Brands

Note:
a) India Beverages revenue includes India Packaged Beverages + NourishCo (subsidiary effective May’2020), but volume doesn’t include Nourishco volumes
b) International tea business includes UK, Canada, USA, Australia, Europe and Middle East (Middle East has been regrouped from India Beverages in FY21 to International tea from FY22).
c) Tata Coffee incl. Vietnam and excl. USCoffee (EOC)
d) Consolidated revenue includes other non-branded business and Inter-segment eliminations
e) # We exited Foodservice (International) business, adjusted for that, Consolidated Revenue grew 12% on a like-to-like basis (11% constant currency)

                                                                                                                                                                                                                            9
Investor Presentation - For the quarter ended June 2021 3rd August 21 - Tata Consumer Products
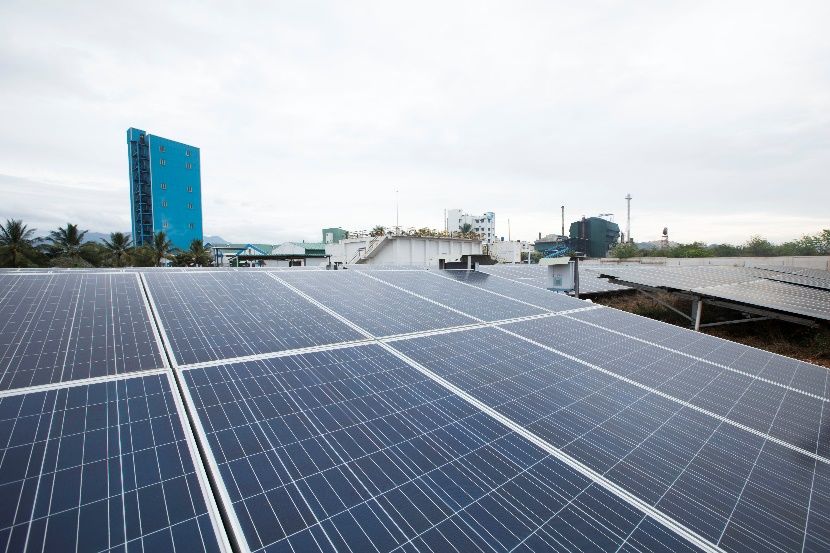
Group Performance at a glance – Q1FY22

                                            ₹ 3,008 Cr.                        ₹ 403 Cr.    ₹ 340 Cr.        ₹ 200 Cr.          ₹ 203 Cr. ~₹ 2,169 Cr.
                                                      Revenue                     EBITDA     PBT (bei)^   Group Net Profit   Group Net Profit   Net Cash$
                                                                                                                                       (bei)^

Growth (Y-on-Y)                                               11%                   -17%          -22%               -42%               -27%

Margin%                                                                            13.4%         11.3%               6.7%               6.8%

Margin expansion
                                                                                 -452 bps     -476 bps           -608 bps           -345 bps
(Y-on-Y)

EPS                                                                                                            2.01 (EPS)

EPS Growth (Y-on-Y)                                                                                           - 43% (EPS)

  ^ before   exceptional items
  $ Cash   and Cash equivalents (net of total borrowings) as at Jun 30, 2021

                                                                                                                                                     10
Strategic Priorities

  The picture can't be displayed.

 Strengthen &                       Drive Digital    Unlock     Create Future   Explore new        Embed
accelerate core                     & Innovation    synergies    Ready Org      opportunities   sustainability
   business

                                                                                                                 12
Fuelling our brands
                                                     Tata Tea Chakra Gold Care Driving
                                                     awareness & trials of value added variant,
                                                     Chakra Gold Care in TN
                                                                                                                                                    India business1 A&P
                                                                                                                                                           Q1FY22

                                                                                                                                                         +53% YoY
                                                                                                       Scale up and expansion in southern markets
                                                                                                       of AP, Telangana and Karnataka.
Ongoing hyperlocal campaigns across all core
markets for Tata Tea Premium.
                                                                                                                                                        Market share

                                                                                                                                                        Tea +170 bps1

Tata Sampann Spices #SpiceUpYourHealth in priority markets –
with multimedia extensions in OOH / Print .
                                                                                                                                                        Salt + 370 bps1
                                                                                     Tata Sampann Continues to be contextual on social media with
                                                                                     participation in relevant occasions

 1 Standalone    Financials
 2 Source:   Nielsen – Value share, JQ’21 vs JQ’20                                                                                                                         13
                                                                                                                                                                          13
Making consistent gains on reach & premiumization
                                                       Direct coverage

                                                                               On track for

                                                                                                       # Rural distributors1
                            as of Sep’20                  as of Jun’21         by Sep’21

                                                                                              Pan-India Harmonized Distribution System

                                     Value growth in premium salts portfolio

                                                                                                     Ecommerce +153% YoY
                                                                                                         7.3% of Sales2

                                                                                                       Institutional channel
                                                                                                            +144% YoY
1 total number of rural distributions as of June’21.
2   % of India business (excl Nourishco) in Q1FY22
                                                                                                                                    14
Strong momentum post second wave of COVID
  Urban direct outlets billed                India F&B revenue growth (%)                             India F&B Volume growth (%)
                                                                                           India Foods                   India Packaged Beverages

                                     1.12     41                                                                        23
 1.00                                                                                       30
              0.96          0.93                       36
                                                                                                                                 16
                                                                                   21
                                                                          22
                                                                                                               14                                   3
                                                                11                                    8

                                                                                                                                           -7
MAR'21       APR'21        MAY'21   JUN'21   Q4FY21   APR'21   MAY'21   JUNE'21   Q4FY21   APR'21   MAY'21   JUNE'21   Q4FY21   APR’21   MAY’21   JUNE’21

Indexed to Mar’21 levels

                                                                                                                                                            15
Embedding Digital across the value chain

   Digital strategy   Enterprise data platform     Continued focus on
     and vision           set-up initiated       key business initiatives

                                                                            16
Continuing the momentum on innovation - India
        Tata Salt                 Tata Tea                     Eight O’Clock                   Tata Sampann
       Super Lite             Chakra Gold Care                                                Dal Tadka Masala

                             New dust blend that packs   A range of Premium International       Range of Dal Tadka
 India's 1st and only salt
                              the traditionally known     Coffee offerings; with its Single   Masalas to enhance the
with 30% low sodium than
                               benefits of 5 natural        origin and flavored Roast &        taste of everyday dals
    regular iodized salt
                                    ingredients                    Ground coffees

                                                                                                                        17
Continuing the momentum on innovation – Intl.
   Himalayan - UK               Teapigs Kombucha                 Teapigs Cold Brew                  Good Energy -                  Good Earth -
                                        UK                              UK                              UK                          Australia

Himalayan Natural Water –                                     Launch of 6 variants of Teapigs   Organic Natural Energy Drink    Good Earth launched in
                            Launch of 3 variants of Teapigs
 Launch of our premium                                             cold brew in the UK.          with natural caffeine from     Australia in 4 flavors –
                                 kombucha in cans
 mineral water in the UK.                                       These all-natural infusions             Guayusa leaf.           Hibiscus, Rose & Sweet
                                                               have been specially made to       2 variants launched in UK -   Berries, Tropical Mangos,
                                                                 brew easily in cold water      Blood Orange and Tangerine,    Rooibos Chai and Ginger,
                                                                                                     and Raspberry and            Turmeric & Lemon.
                                                                                                         Blueberry

                                                                                                                                                       18
Soulfull integration update
Key Highlights

        Organization structure and policies harmonized

        Ensured billing through TCPL within ~45 days of deal closure; 3x GT outlet expansion achieved

        Completed critical process integration across 10 functions within 90 days of deal closure

        Completed Sales IT and related integration

        Preserved agility & entrepreneurial culture while integrating back-end into the TCPL India platform, including the
        innovation process

                                                                                                                             19
Recent changes in the Leadership team

     Mr. Prashant Parameswaran                          Mr. Puneet Das                                            Ms. Deepika Bhan
     Managing Director & CEO                            President – Packaged                             ‘        President – Packaged
     Tata Consumer Soulfull Pvt. Ltd.                   Beverages(India and South Asia)                           Foods (India)

                         Mr. T.V. Swaminathan                                 Mr. Punit Gupta
                         Global Chief Digital Officer                         Senior Vice President –Strategy and M&A

                                                                                                                                         20
Enhancing ESG disclosures

          ESG reporting

 Introduction of an interactive tool on our
website to enhance disclosures, reporting
           and ease of access.

                                              21
Macro and commodity overview
  Global GDP growth rates                                                                                   Commodity price trend
                                                                                                                            Tea Prices                                                       Coffee Prices
                                                                                                      %
                                                                                                21.0 20.5
                                                                                                                                                            $c / KG                                                     147
                                                                                                     12.2    190        188            189   194           180                                       107
                                                                                                                                                                                                                              $c/ LB
       5.4                                                                                                           272                                                       96
             2.1 4.6    2.3 3.3          4.0
                                                                                        1.6                  219                                         215₹ / KG
                                   0.3                                        0.5                                                  194
 2.0
                                                                -2.8                                                                         158
       1.5      1.4         1.2                                           -2.4          0.4                                                                                                                                   $c/ LB
                                                       -9.0
                                      -2.2                                                    -6.1                                                          ₹ / KG                                                       68
                                                              -7.4     -8.5      -7.3                                   163                                                    64
                                                                                                                                       153   145                                                     54
                                                                                                                                                           122
                                                       -21.4                                                 106
                                               -24.4

  Q1FY20 Q2FY20 Q3FY20 Q4FY20 Q1FY21 Q2FY21 Q3FY21 Q4FY21 Q1FY22E                                           Q1FY21   Q2FY21       Q3FY21 Q4 FY21 Q1FY22                    Q1 FY20              Q1 FY21              Q1 FY22
                                                                                                                     North India Tea          South India Tea
                       India GDP growth           US GDP growth               UK GDP growth                          Kenya Tea                                                      Arabica Coffee           Robusta Coffee

•. India GDP growth rate has seen a sequential recovery since Q1FY21, with all                              • North India tea prices saw an uptick sequentially, however June saw some tapering off.
   major economic indicators moving in the right direction. However, with the
                                                                                                            • Kenya tea prices have come down YoY as well as QoQ.
   second wave of COVID, these estimates have been revised downwards.
                                                                                                            • Both Arabica and Robusta coffee prices saw an increase YoY.
• US & UK GDP growth/ estimates continued to see an increase during the
  quarter. The outlook going forward also looks more optimistic given the current
  pace of vaccination.
                                                                                                                                                     Source: North India and South India tea auction (Tea Board of India) | Mombasa tea
                                                                                                                                                     auction (EATTA) | International Coffee Exchange

Source: NSO, tradingeconomics.com, Nomura Research
                                                                                                                                                                                                                           23
Market context – category growth rates
              US                                        UK                                       Canada               India
                                                                                                                     +28.4%
                                                                                                                                   • Regular black hot tea category continued to
                                                                                                                                     witness a decline in the US & Canada, owing
                                                                                                                                     to the pantry stocking effect in the base
                                                                                                                                     quarter. In the UK, regular black tea decline
                                                                                                                                     YOY slowed down from the previous quarter.

                                                                                                                                   • Non-black tea (Fruit & Herbal, Specialty,
                                                                                                                                     Decaf.) continues to grow in the UK but the
                                                           4.2%                                                                      category growth reversed in Canada during
                                                                                                                                     the quarter, owing to stringent COVID led
                                                                                                                                     restrictions and a high base effect.
                    -0.7%
                                                                                                                                   • Indian branded tea category registered a
          -7.3%                                                                                    -7.2%                             growth of ~ 28% in Q1, partly due to the
                                                -7.6%                                                                                impact of the lockdown in the base quarter.

                                                                                                                                   • US Coffee declined during the quarter, again
                                                                                       -19.8%
-21.7%                                                                                                                               owning to an elevated base last year. The
                                                                                                                                     decline seen in k-cups was much lower than
+21.1% +18.9% +14.8%                           -0.6%       +9.5%                       +19.1%       +32.4%            -5.4%
                                                                                                                                     that seen in bags..

    US Regular Black Hot Tea                  UK Regular Black Tea                  Canada Regular Black Tea   India Branded Tea
    US Bags Coffee                            UK Fruit & Herbals Tea                Canada Speciality Tea
    US K-cup Coffee

Source: Nielsen: 12 weeks (Value) – June‘21                12 weeks (Value) – June’20, Nielsen

                                                                                                                                                                          24
India Packaged Beverages
                                                                                            Performance commentary

                                                                          +24%
                                                                                            • Revenue for the quarter grew                      • EBIT Margin for the segment
                                                                                              24%, with 3% volume growth,                         improved QoQ, however
                                                                                              impacted by disruption caused by                    contracted YoY led by tea cost
                                                                        Revenue Growth        second wave of COVID.                               inflation and increased A&P.

                                                                                            • Coffee revenue grew 14% during                    • Market share leadership in tea in
                                                                                              the quarter.                                        Ecommerce channel.2

A well-known Tata Tea “Jaago Re” campaign aims to sensitize and urge
people to help the under privileged in their vaccination journey.
                                                                           +3%
                                                                        Volume Growth1

                                                                                            Other updates
                                                                                            • Tata Tea “Jaago Re” campaign                      • Kanan Devan Dust relaunched in
                                                                                              extended to spread awareness                        TN.
   Media campaign                                                                             and help with the vaccination of
   across all major
   channels to                                                         ~140bps                those with limited means.

   communicate Tata                                                    Market Share gain3
   Tea Agni value
   proposition.
                                                                                                              1 Tea   volume growth 2 Source: Nielsen, Jun’21
                                                                                                              3 Source:   Nielsen – Value share, Moving Annual Total (MAT) basis Jun’21 vs Jun’20

                                                                                                                                                                                       26
India Foods
                                                                                                  Performance commentary

                                                                               +20%               • Salt revenue grew 20% during the
                                                                                                    quarter, despite a high base.
                                                                                                                                                  • Tata Sampann portfolio grew 12%,
                                                                                                                                                    due to pantry loading in the base
                                                                                                                                                    quarter, bringing the 2-year CAGR
                                                                            Revenue Growth                                                          to ~30%.
                                                                                                  • Continued to drive premiumization
                                                                                                    with Premium Salts portfolio
                                                                                                    growing 34% during the quarter.

Tata Salt SuperLite: Launch of India’s first-ever specially-formulated
30% low sodium salt, adding to our repertoire of Premium Salt                  +17%
offerings                                                                    Volume Growth

                                                                                                  Other updates
                                                                                                  • Launch of Tata Salt SuperLite, with          • Tata Sampann Spices recorded
                                                                                                    30% Less Sodium.                               strong growth in the ecommerce

                                                                           +240bps
                                                                                                                                                   channel.
                                                                                                  • Tata Sampann poha is the highest
                                                  TV Commercial building                            rated product in its category on
                                                  awareness about the      Market share gain in     Amazon.
                                                  proposition of                   salt*
                                                  “Unpolished Tata
                                                  Sampann Dal”                                                   * Source: Nielsen – Value share, Moving Annual Total (MAT) basis Jun’21vs Jun’20

                                                                                                                                                                                            27
NourishCo (100% Subsidiary)
                                                                                                       Performance commentary
   Sales as a % of PY

                                                                                      87Cr
                                                       186%          191%                             • Revenue grew 91% YoY bringing         • Roll-out of Himalayan in
                                                                                                        the 2-year CAGR to 12%, despite         Ecommerce and MT channels is
                                                                                                        the severe adverse impact of            seeing good traction.
                                             109%                                     Revenue           COVID on OOH consumption.
                                   82%
                         64%
                                                                                                      • The growth was broad based with
                                                                                                        all products growing strongly, with
                                                                                                        Tata Water Plus delivering yet
                        Q1 FY21   Q2 FY21   Q3 FY21   Q4 FY21       Q1FY22                              another exceptional quarter.

                                                                                     +91%
                                                                                   Revenue growth
                                                                                                       Other updates
                                                                                                      • Geography and capacity expansion      • Himalayan continued to add key
                                                                                                        on track.                               institutional accounts despite the
                                                                                                                                                second wave of COVID

                                                                                      4.8x
                                                                                   Tata Water Plus#

Tata Fruski communicated the core proposition of a tongue tickling, lip-smacking                                                                      #   382% YoY revenue growth in Q1
range of street-inspired beverages with unique campaigns.

                                                                                                                                                                                  28
Tata Coffee (inc Vietnam) (~58% Subsidiary)
                                                                                                 Performance commentary

                                                                                  +5%#
                                                                                                 • Revenue for the quarter grew 5%                Extractions
                                                                                                   led by the extractions business,             • Overall extraction business grew
                                                                                                   which helped offset the decline in             21%, with growth seen in both
                                                                                Revenue Growth     coffee plantations.                            Vietnam and domestic business,
                                                                                                                                                  which was impacted by nationwide
                                                                                                                                                  lockdown last year.
                                                                                                   Plantations
                                                                                                 • The quarter saw value growth in              • Vietnam business recorded highest
                                                                                                   Tea (better realization) while Coffee          ever EBIT driven by higher
                                                                                                   revenue declined YoY, due to a

                                                                                  -23%
Instant Coffee Division Theni won the Gold Award by the Society of                                                                                volumes and a higher proportion of
                                                                                                   high base.                                     premium blends.
Energy Engineers and Managers for Energy (SEEM) as a recognition
for its efforts towards achieving sustainable energy performance at the unit.
                                                                                  Plantations
                                                                                Revenue Growth

                                                                                                    Other updates                                   .

                                                                                  +21%           • ICRA has upgraded Tata Coffee’s
                                                                                                   long- term rating to AA+ (stable),
                                                                                  Extractions      on company’s fund-based bank
                                                                                Revenue Growth     facilities.

GHG Audit as per ISO 14064 by British Standards Institute was
                                                                                                                    #   Tata Coffee performance above including Vietnam. Does not include EOC
completed in June. Carbon sequestration accounting (in-house)
completed for FY20-21 (> 2 Lacs MT Co2e sequestered)
                                                                                                                                                                                     29
Tata Starbucks (JV)
                                                                                                      Performance commentary

                                                                                      84%             • While revenue for the quarter grew
                                                                                                        371% on a depressed base of last
                                                                                                        year, it was still 61% indexed to
                                                                                                                                             • Continuous impetus on planning
                                                                                                                                               and executing various cost saving
                                                                                                                                               initiatives.
                                                                                  Stores re-opened*     Q1FY20 (baseline).

                                                                                                      • April and May performance was        • Delivery contribution increased to
                                                                                                        impacted by localized lockdowns,       27%, driven by several focused
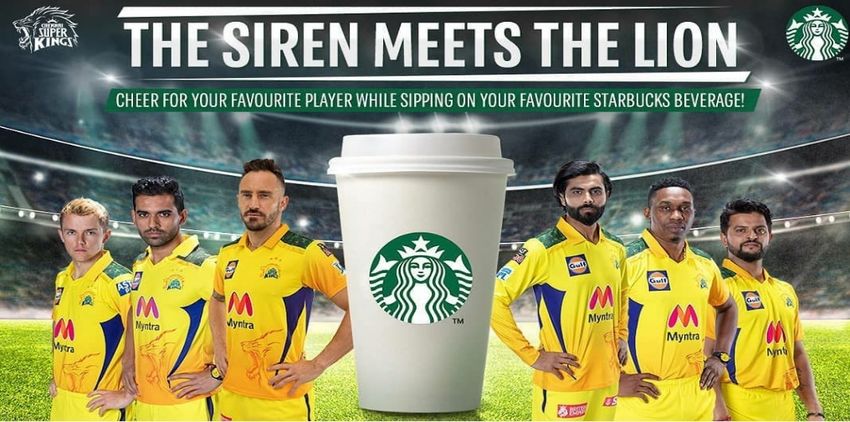
Partnered with Chennai Super Kings during IPL
                                                                                                        June saw a V-shaped recovery           initiatives, to offset the decline in
2021
                                                                                                        with the gradual easing of             dine-in.
                                                       Launch of Starbucks                              restrictions on store operations.

                                                                                      219
                                                       merchandise on Tata CLiQ
                                                       Luxury platform

                                                                                    Total Stores
                                                                                                       Other updates
                                                                                                      • Introduced its signature coffee      • Tata Starbucks has partnered
                                                      98%                                                                                      with Swastha, an NGO
                                                90%                                                     essentials on Tata CLiQ Luxury
                                      84%                               83%
  Sales indexed to

                                                                                                        platform.                              established by Tata Coffee aimed
   FY20 baseline

                                                            64%                                                                                at of differently abled children of
                                53%

                                                                                        18
                                                                                                      • Rolled out exclusive offers for My     Kodagu, Coorg.
                                            ‘
                                                                  36%                                   Starbucks Rewards (MSR)
                          27%
                                                                                                        Members on Delivery platform.
                     1%                                                                Cities

                                                                                                                                                                    * As of end June’21

                                                                                                                                                                               30
UK
                                                                                     Performance commentary

                                                                -13%                • Revenue for the quarter declined
                                                                                      11% (constant currency) owing to
                                                                                      pantry up-stocking that led to 12%
                                                                                                                                   • Specialty OOH channel is seeing fast
                                                                                                                                     recovery.
                                                              Revenue Growth^
                                                                                      growth in the base quarter last year.        • Good Earth tea continues to attract
                                                                                                                                     younger consumers and Good Earth
                                                                                    • Tetley continued to grow share in              kombucha is seeing good traction in
                                                                                      Fruit & Herbal segment with the                OOH and Specialty Grocery
                                                                                      new Herbals range.                             channels.

                                                               +14%
                                  Teapigs launched its own
                                  range of kombucha
                                                                                    • Integrated Teapigs with the                  • Setting up a dedicated e-commerce
                                                              Teapigs revenue         mainline sales system to sell a                team for UK and Europe and an
                                                                 Growth#              3-brand portfolio.                             integrated back end i.e., fulfillment
                                                                                                                                     centers for all tea brands.

                                                                                    Other updates

                                                               19.9%
                                                                                    • Teapigs continued to see strong              • Good Earth launched Good Energy,
                                                                                      growth, driven by fast recovery in             an organic natural energy drink
                                                                                      Specialty OOH and Grocery                      created from guayusa, an herbal tea
                                                             Value Market share*      channels.                                      base from Ecuadorian rainforest
                                                              (in everyday black)                                                    packed with caffeine and
Launch of Good Energy – an                                                          • Premium mineral water Himalayan                antioxidants.
organic natural energy drink to                                                       launched online & on Amazon;
augment the brand portfolio.                                                          retail expansion underway.
                                                                                                               ^ Constant currency ex Teapigs business # Constant currency growth
                                                                                                               * Source: Nielsen – Value share, Moving Annual Total (MAT) basis – June’21

                                                                                                                                                                              32
USA
                                                                       Performance commentary

                                                      -15%
                                                                      • Coffee: Revenue for the quarter              • Tea (excluding Empirical): Revenue
                                                                        declined 15% (constant currency),              for the quarter declined 8%
                                                                        due to pantry loading that led to 26%          (constant currency), on an elevated
                                                     Coffee Revenue     growth in the base quarter last year.          base that saw 25% growth in the
                                                         Growth^                                                       base quarter.
                                                                      • Retail coffee category saw a decline
                                                                        during the quarter, lapping an               • Tetley outperformed the black hot
Expanding Tetley, Good Earth and teapigs offerings                      elevated base of last year, however            tea category while Good Earth

                                                       -8%
                                                                        showing signs of rebound in June.              Sensorial blends & Teapigs
                                                                                                                       continued their momentum in the
                                                                      • 32-count K-Cups and Café Arriba                Specialty tea segment.
                                                      Tea Revenue       innovations continued to perform well
                                                        Growth^         with distribution build.

                                                                        Other updates
                                                                      • Launched Tetley Irish Breakfast with          • America reopens, with increased

        New campaign
                                                      4.5%              ShopRite with an aim to expand
                                                                        presence in other retailers.
                                                                                                                        footfall in stores, café’s – taking
                                                                                                                        share away from eCommerce and
        ‘Overdelivery in every                        *Coffee Bags                                                      Retail
        Cup’ across platforms                         Market Share    • New notable business wins for
                                                                        teapigs at Whole Foods, Sprouts

                                                                                                  ^ Constant Currency, excluding Foodservice (Empirical)
                                                                                                  Source: *Nielsen – Value share, Moving Annual Total (MAT) basis – Jun’21

                                                                                                                                                               33
Canada
                                                                                                  Performance commentary

                                                                                -25%              • Revenue for the quarter declined
                                                                                                    25% (constant currency), due to
                                                                                                    pantry loading that led to 32%
                                                                                                                                                • Continued strong performance of
                                                                                                                                                  Tetley Super Teas range.
                                                                              Revenue Growth^
                                                                                                    growth in the base quarter last
                                                                                                    year.

                                                                                                  • Tetley has gained market share*,
                                                                                                    both in regular and specialty tea.

                                                                                -26%
  Tetley Cold Infusions campaign across media platforms with Penny
  Oleksiak , a well-known Olympic Gold Medalist
                                                                              Revenue growth in
                                                                                Specialty tea^

                                                                                                  Other updates
                                                                                                  • Both Tetley Cold Infusions and              • Kickstarted summer campaign for
                                                                                                    Tetley Super teas have achieved               building awareness and trials for
                                                                                                    increased distribution at key                 Cold Infusions.

                                                                                  29%               accounts.

                                                                               *Market share
Adding new variants to Cold Infusion   Teapigs portfolio boosted with Feel-                                               ^ Constant Currency
                                                                                                                          Source: *Nielsen – Value share, Moving Annual Total (MAT) basis – Jun’21
                                       Good teas

                                                                                                                                                                                          34
Awards & Recognitions
                        1. Corporate                              2. Manufacturing
                           Governance                                Excellence
                          Featured in the ‘Leadership’ category        Nonoi Packaging Center won the
                          as assessed by IiAS on the IFC-              Silver in the India Green
                          BSE-IiAS Indian Corporate                    Manufacturing Challenge amongst
                          Governance Scorecard.                        the top manufacturing units in
                                                                       India by International Research
                                                                       Institute for Manufacturing.

                        3. Environmental                          4. Credit Rating
                           leadership                                  ICRA upgraded Tata Coffee’s
                                                                       long- term rating to AA+ (stable),
                          ICD Theni won the Gold Award from
                                                                       on the company’s fund-based
                          the Society of Energy Engineers
                                                                       bank facilities.
                          and Managers for Energy (SEEM)
                          as a recognition of their efforts in
                          achieving sustainable energy
                          performance at the unit.

                                    5. Most Chosen FMCG Brand
                                         Tata Consumer Products awarded as the 5th Most
                                         Chosen FMCG Brand of India for 2020 by Kantar
                                         Worldpanel.

                                                                                                      35
Highlights – for the quarter ended Jun’21
                                                                                            REVENUE:
               Standalone               (in ₹ Cr)   Consolidated                (in ₹ Cr)
                                                                                            Group Revenue grew by 11% (10% in constant
                                                                                            currency)
Revenue from

                                                                    294       3,008
 operations

                              361     1,966            2,714                                •   India Beverages (including Nourishco) grew by
                    1,605                                                                       28%.

                                                                   +11%                     •   India Foods grew by 20%.

                             +22%                                                           •   Tata coffee (incl Vietnam) grew by 5% (6% in
                                                                                                constant currency).
                                                                                            •   International business declined 13% (-16% in
                                                                                                Constant currency), last year had gains on
                   Q1FY21   Growth   Q1FY22            Q1FY21      Growth   Q1FY22              account of pantry stocking
                                                                                                   •   Excluding exited markets decline on like-
                                                                                                       to-like basis is 9% (-12% in constant
                                                                                                       currency).
                                                         486
                     326     - 52                                   - 83       403          EBITDA:
  EBITDA

                                        274
                                                                                            Group EBITDA declined 17%
                            -16%                                   -17%
                                                                                            •   India Business mainly on account of an increase
                                                                                                in A&P YoY and low-cost tea inventory in the base
                                                       Q1FY21      Growth   Q1FY22              quarter.
                   Q1FY21   Growth   Q1FY22
                                                                                            •   International Business - COVID related pantry
                                                                                                stocking by consumers last year.

                                                                                                                                             37
Financials: Standalone and Consolidated
                     Standalone                                            Profit and Loss Statement                                             Consolidated

       Q1FY22             Q1FY21          Change %                            (all nos. in ₹ Crores)                               Q1FY22            Q1FY21     Change %

            1,966            1,605              22 %      Revenue from operations                                                        3,008         2,714        11 %
              274              326             (16) %     EBITDA                                                                          403            486       (17)%
          13.9 %            20.3 %                        %                                                                             13.4 %        17.9 %
              239              296             (19)%      EBIT                                                                            336            424       (21)%

          12.2 %            18.4 %                        %                                                                             11.2 %         15.6%
              378              335              13 %      PBT before exceptional items                                                    340            436       (22) %
                 -             (21)                       Exceptional items                                                                (4)            63
              (74)             (82)                       Tax                                                                             (96)          (110)
              304              232              31 %      PAT                                                                             241            389       (38)%
          15.5 %            14.5 %                        %                                                                              8.0%          14.3%
                                                          Group Net Profit (incl. JVs & Associates)                                       200            346       (42) %

Group Consolidated Net Profits for the quarter declined 42% YoY on account of following :
•  Lower EBITDA as previous year had the benefit of softer tea commodity cost in India and pantry stocking in International business.
•  Last year benefitted from an exceptional item of accounting gains on conversion of NourishCo from a Joint venture to a subsidiary.
•  Group net profit, adjusted for exceptional items, on like-to-like basis declined by 27%

                                                                                                                                                                            38
Segment-wise Performance
                                                                                     Revenue - Branded business
Particulars                      Segment Revenue           Segment Results

₹ Cr                         Q1 FY22 Q1 FY21    Change Q1 FY22 Q1 FY21   Change
                                                                                                                  46 % India beverages
                                                   (%)                         (%)
                                                                                                                  26%     India foods
India Beverages                1,267     989       28%     151     212       (29)%                                28 % International beverages

India Foods                     705      589       20%      96     115       (16)%

International Beverages         768      879     (13)%      96     129       (25)%

Total Branded business         2,739   2,457       11%     343     455       (25)%   Segment results – Branded business

Non branded business            278      264       5%       19      14        34%
                                                                                                                  44 % India beverages

Others / Unallocated items       (9)      (7)             (25)      30                                            28 % India foods
                                                                                                                  28 % International beverages
Total                          3,008   2,714       11%     336     499       (33)%

                                                                                                                                          39
Outlook
Macros
   Second wave of COVID-19 in India is now receding and there seems to be a V-shaped recovery since second half of June.

   Our International markets (US, UK, Canada) are seeing a return to pre-COVID demand trends of packaged tea and coffee categories.

Business
   With the second wave abating, we are focused on accelerating the momentum in our businesses.

   In India Packaged beverages, we are seeing moderation in tea costs and we will stay focused on competitive and profitable growth.

   With the ongoing distribution expansion and innovations, momentum in India Foods business will continue.

   With increased mobility, we expect to see improving trend in Starbucks and further acceleration in Nourishco business.

   International business has started to see normalisation of in-home consumption of tea and coffee – we will continue to step up our focus on
    non-black tea offerings, innovations in coffee and RTD beverages.

                                                                                                                                             41
Thank You
For more information

Nidhi Verma                                                  For media queries
Head – Investor Relations & Corporate Communication          Satya Muniasamy
nidhi.verma@tataconsumer.com                                 satya.muniasamy@tataconsumer.com

Write to us at
investor.relations@tataconsumer.com

Call us at
+91-22-61218400

Last 10-year financials are available on Historical financial data

     tataconsumer.com                         TataConsumer                       tata-consumer-products/   tataconsumerproducts/

                                                                                                                                   42
Shareholding information                                                                  Quarter Ended June’20

Pattern as on 30th June, 2021                     Stock data

                                                  BSE Ticker                                 500800
                      Others 5%

                                  Promoter and    NSE Ticker                                 TATACONSUM
                                  promoter
 Individual                       Group           Market Capitalization (June 30, 2021)      ₹695.2 bn
 21%                              35%
                                                  Number of Shares Outstanding               921.6 Mn.

MFs/ UTI/ AIFs
9%

         Insurance
                                  Foreign
         Companies/
                                  Institutional
         Banks
                                  Investors
         5%
                                  25%

                                                                                                          43
You can also read