INVESTOR PRESENTATION - June 2021 - Innovid
←
→
Page content transcription
If your browser does not render page correctly, please read the page content below

INVESTOR
PRESENTATION

June 2021

DISCLAIMERS
     This presentation is provided for informational purposes only and has been prepared to assist interested parties in making their own evaluation with respect to a potential business combination between Innovid, Inc. (the “Company” or
     “Innovid”) and ION Acquisition Corp 2 Ltd. (“ION”) and related transactions (collectively, the “Proposed Transactions”) and for no other purpose. This presentation is for information purposes only and is being provided to you solely in your
     capacity as a potential investor in considering an investment in Innovid. Any reproduction or distribution of this presentation, in whole or in part, or the disclosure of its contents, without the prior consent of Innovid is prohibited. By
     accepting this presentation, each recipient and its directors, partners, officers, employees, attorney(s), agents and representatives agrees: (i) to maintain the confidentiality of all information that is contained in this presentation and not
     already in the public domain; and (ii) to return or destroy all copies of this presentation or portions thereof in its possession following the request for the return or destruction of such copies.
     Forward-Looking Statements
     This presentation includes “forward-looking statements” within the meaning of the federal securities laws, opinions and projections prepared by the Company’s and ION’s management. These forward-looking statements generally are
     identified by the words “expects,” “will,” “projected,” “continue,” “ increase,” and/or similar expressions that concern the Company’s or ION’s strategy, plans or intentions, but the absence of these words does not mean that a statement is
     not forward-looking. Such statements are made pursuant to the safe harbor provisions of the Private Securities Litigation Reform Act of 1995 and are based on management’s belief or interpretation of information currently available.
     Because forward-looking statements are predictions, projections and other statements about future events that are based on current expectations and assumptions, they are subject to inherent uncertainties, risks and changes in
     circumstances that are difficult to predict and many of which are outside of the Company’s or ION’s control. Actual results and condition (financial or otherwise) may differ materially from those indicated in the forward-looking statements.
     These forward-looking statements are subject to a number of risks and uncertainties that could cause actual results and conditions to differ materially from those indicated in the forward-looking statements, including, but not limited to, the
     various summary risk factors related to the Proposed Transactions that have been provided to you separately. The list of factors provided separately is not exhaustive. You should carefully consider the foregoing factors and the other risks
     and uncertainties described in the “Risk Factors” section of ION’s final prospectus related to its initial public offering, the Proxy Statement/Registration Statement (as defined below) and other documents filed by ION from time to time with
     the Securities and Exchange Commission (“SEC”). There may be additional risks that the Company and ION do not presently know or that they currently believe are immaterial that could also cause actual results to differ from those
     contained in the forward-looking statements. In addition, forward-looking statements reflect the Company’s and ION’s expectations, plans or forecasts of future events and views as of the date of this presentation. Accordingly, you should
     not place undue reliance upon any such forward-looking statements in this presentation. Neither the Company, ION nor any of their affiliates have any obligation to update this presentation.
     Additional Information and Where to Find it
     In connection with the Proposed Transactions, ION is expected to file with the SEC a registration statement on Form S-4 containing a preliminary proxy statement/prospectus relating to the Proposed Transactions (the “Proxy
     Statement/Registration Statement”), and after the registration statement is declared effective, will mail the proxy statement included therein to holders of ION’s ordinary shares in connection with ION’s solicitation of proxies for the vote by
     the ION shareholders with respect to the Proposed Transactions and other matters as described in the Proxy Statement/Registration Statement. ION urges its shareholders and other interested persons to read, when available, the Proxy
     Statement/Registration Statement and amendments thereto and documents incorporated by reference therein, as well as other documents filed with the SEC in connection with the transactions, as these materials will contain important
     information about ION, the Company and the Proposed Transactions. When available, the definitive proxy statement included in the Proxy Statement/Registration Statement will be mailed to ION’s shareholders. Shareholders of ION will
     also be able to obtain copies of such documents, without charge, once available, at the SEC’s website at www.sec.gov, or by directing a request to: ION Acquisition Corp 2 Ltd., 89 Medinat Hayehudim Street, Herzliya 4676672, Israel.
     No Representations and Warranties
     This presentation is for informational purposes only and does not purport to contain all of the information that may be required to evaluate a possible investment decision with respect to Innovid. The recipient agrees and acknowledges that
     this presentation is not intended to form the basis of any investment decision by the recipient and does not constitute investment, tax or legal advice. No representation or warranty, express or implied, is or will be given by Innovid or any of
     its affiliates, directors, officers, employees or advisers or any other person as to the accuracy or completeness of the information in this presentation or any other written, oral or other communications transmitted or otherwise made
     available to any party in the course of its evaluation of the Proposed Transactions and no responsibility or liability whatsoever is accepted for the accuracy or sufficiency thereof or for any errors, omissions or misstatements, negligent or
     otherwise, relating thereto. The recipient also acknowledges and agrees that the information contained in this presentation is preliminary in nature and is subject to change, and any such changes may be material. Innovid disclaims any
     duty to update the information contained in this presentation.
     Participants in Solicitation
     ION and its directors and executive officers, under SEC rules, may be deemed to be participants in the solicitation of proxies of ION’s shareholders in connection with the Proposed Transactions. Shareholders of ION may obtain more
     detailed information regarding the names, affiliations and interests of ION’s directors and executive officers in ION’s final prospectus for its initial public offering filed with the SEC on April 13, 2021 and in the Proxy Statement/Registration
     Statement when available. Information concerning the interests of ION’s participants in the solicitation, which may, in some cases, be different than those of ION’s shareholders generally, will be set forth in the Proxy Statement/Registration
     Statement when it becomes available.

2|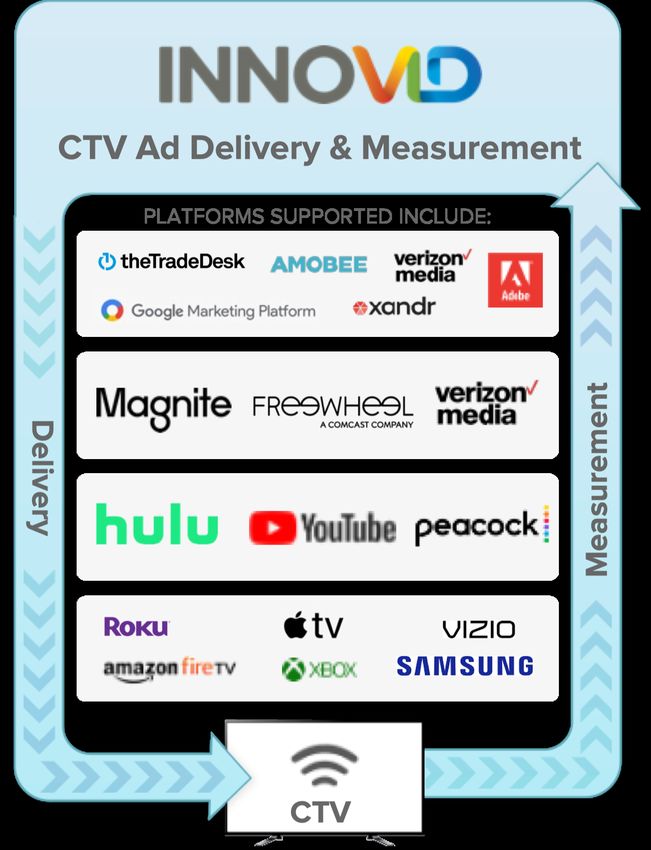
DISCLAIMERS (cont’d)
     Statement Regarding Non-GAAP Financial Measures
     The financial information and data contained this presentation is unaudited and does not conform to Regulation S-X promulgated by the SEC. Accordingly, such information and data may not be included in, may be adjusted in, or may be
     presented differently in, any proxy statement, prospectus or other report or document to be filed or furnished by ION, the Company or any entity that is party to the Proposed Transactions with the SEC. Certain financial measures in this
     presentation are not calculated pursuant to U.S. generally accepted accounting principles (“GAAP”). These non GAAP financial measures are in addition to, and not as a substitute for or superior to measures of financial performance
     prepared in accordance with GAAP. There are a number of limitations related to the use of these non-GAAP financial measures as compared to their nearest GAAP equivalents. For example, other companies may calculate non-GAAP
     financial measures differently or may use other measures to evaluate their performance, all of which could reduce the usefulness of the non-GAAP financial measures herein as tools for comparison. You should review the Company’s
     audited financial statements, which will be presented in the Proxy Statement/Registration Statement to be filed with the SEC in connection with the Proposed Transactions, and not rely on any single financial measure to evaluate the
     Company’s business.
     Use of Projections
     This presentation also contains certain financial forecasts, including projected annual revenue, gross profit and Adjusted EBITDA. Innovid's independent auditors have not studied, reviewed, compiled or performed any procedures with
     respect to the projections for the purpose of their inclusion in this presentation, and accordingly, no independent auditor has expressed an opinion or provided any other form of assurance with respect thereto for the purpose of this
     presentation. These projections are for illustrative purposes only and should not be relied upon as being necessarily indicative of future results. In this presentation, certain of the above-mentioned projected information has been provided
     for purposes of providing comparisons with historical data. The assumptions and estimates underlying the prospective financial information are inherently uncertain and are subject to a wide variety of significant business, economic and
     competitive risks and uncertainties that could cause actual results to differ materially from those contained in the prospective financial information. Projections are inherently uncertain due to a number of factors outside of Innovid's control.
     While all financial projections, estimates and targets are necessarily speculative, Innovid believes that the preparation of prospective financial information involves increasingly higher levels of uncertainty the further out the projection,
     estimate or target extends from the date of preparation. Accordingly, there can be no assurance that the prospective results are indicative of future performance or that actual results will not differ materially from those presented in the
     prospective financial information. Inclusion of the prospective financial information in this presentation should not be regarded as a representation by any person that the results contained in the prospective financial information will be
     achieved.
     Unaudited Estimated Results
     The Company’s preliminary unaudited estimated results contained in this presentation have been prepared in good faith by, and are the responsibility of, management based upon the Company’s internal reporting, and an independent
     auditing firm has not audited, reviewed, compiled or performed any procedures with respect to the preliminary financial results. Such results are subject to business, economic, regulatory and competitive uncertainties and contingencies
     and actual results may vary and those variations may be material. As such, Innovid's actual results and financial condition as reflected in the financial statements that will be included in the registration statement on Form S-4 for the
     Proposed Transactions may be adjusted or presented differently from the historical financial information herein, and the variations could be material.
     No Offer or Solicitation; Private Placement
     This presentation is not a proxy statement or solicitation of a proxy, consent or authorization with respect to any securities or in respect of the proposed transaction and shall not constitute an offer to sell or a solicitation of an offer to buy
     the securities of ION or the Company nor shall there be any sale of any such securities in any state or jurisdiction in which such offer, solicitation, or sale would be unlawful prior to registration or qualification under the securities laws of
     such state or jurisdiction. The securities to which this presentation relates have not been registered under the Securities Act of 1933, as amended (the “Securities Act”), or the securities laws of any other jurisdiction. This presentation relates
     to securities that Innovid would intend to offer in reliance on exemptions from the registration requirements of the Securities Act and other applicable laws. These exemptions apply to offers and sales of securities that do not involve a
     public offering. The securities have not been approved or recommended by any federal, state or foreign securities authorities, nor have any of these authorities passed upon the merits of this offering or determined that this presentation is
     accurate or complete. Any representation to the contrary is a criminal offense.
     Trademarks
     This presentation contains trademarks, service marks, trade names, and copyrights of the Company, ION and other companies, which are the property of their respective owners. Solely for convenience, some of the trademarks, service
     marks, trade names and copyrights referred to in this presentation may be listed without the TM, SM © or ® symbols, but the Company and ION will assert, to the fullest extent under applicable law, the rights of the applicable owners, if any,
     to these trademarks, service marks, trade names and copyrights.

3|
PRESENTERS AND SENIOR LEADERSHIP

             ZVIKA NETTER               TANYA ANDREEV-KASPIN                   GILAD SHANY                        AVROM GILBERT
            CEO & CO-FOUNDER                        CFO                              CEO                                 COO

       Serial entrepreneur with over     Leads finance, accounting,     CEO of ION Acquisition Corp. 1        President and COO of ION
          28 years of experience          legal and HR functions at        and 2, Co-CEO of ION            Acquisition Corp. 1 and 2, Co-CEO
         launching, managing and                   Innovid              Acquisition Corp. 3, Managing      and President of ION Acquisition
      growing technology companies                                        Partner of ION Crossover                      Corp. 3
                                        Prior to Innovid, spent eight            Partners (ICP)
        Prior to co-founding Innovid,     years in finance roles at                                         COO of growth tech companies
      founded and served as CEO for         several technology            Prior to co-founding ICP, 10       SimilarWeb & Seeking Alpha
       several technology companies     companies and four years at     years of experience investing in
                                                     PwC                 public and private companies            8 years public & private
                                                                          with Baron Capital (NY) and       investments, including equities
                                                                         Magma Venture Partners (TLV)      analyst with UBS & venture capital
                                                                                                             at Jerusalem Global Ventures

4|
AGENDA
   Introduction

   Overview

   About Innovid

   Go-to-Market Strategy

   Investment Highlights

   Financial Information

   Growth Strategy

   Valuation & Comparables

INTRODUCTION

ION – GLOBAL REACH, LONG-TERM VALUE

      ION ISRAEL FUND           ION CROSSOVER PARTNERS                                 ION ACQUISITION
                                                                                       CORP (SPAC)
                                                                                       IACA (BCA)

                                                                               Q4 20
                                                    Q3 18
                   2006                                                                IACB (Public)
                                                                                       IACC (Public)

                                                                       Q4 18
                                   2015

                SOVEREIGN WEALTH FUND                       ION TECH FUND

                                          Total AUM: >$2bn
7|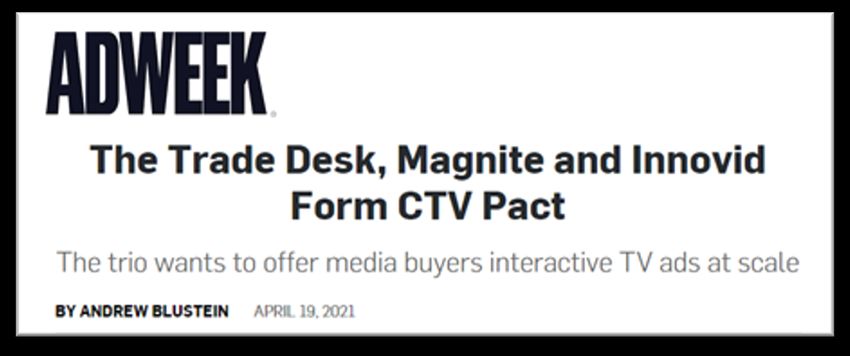
ION INVESTMENT THESIS – MARKET LEADING
     EXPOSURE TO CONNECTED TV GROWTH

      1                  TV ADVERTISING IS A $200B MARKET SHIFTING FROM LINEAR TV TO CTV
                         As “cord cutting” audiences move to CTV, and OTT publishers grow, brand advertising dollars follow

      2                  MARKET-LEADING INDEPENDENT CTV ADVERTISING PLATFORM
                         Used by >40% of major global advertisers to manage ad campaigns in a fragmented CTV market

      3                  VISIONARY, FOUNDER-LED, FIRST-TO-MARKET PLAYER WITH DEEP MOAT
                         Proprietary tech to future-proof for CTV roadmap + Unmatched Partner Network (TTD, MGNI, Peacock, Roku, Hulu, etc.)

      4                  DIFFERENTIATED SOFTWARE COMPANY TO RIDE THE EXPLOSIVE GROWTH OF CTV
                         80%+ gross margins, 37% Revenue Growth, 94% logo retention + upside from advanced capabilities

     Source: Dentsu, eMarketer, Kantar (https://www.kantar.com/), Winmo (https://www.winmo.com/)
8|   Note: $200bn estimate includes 2021 traditional TV ad spend of $169bn and assumes 2021 global CTV ad spend is ~2x US ad spend of $13bn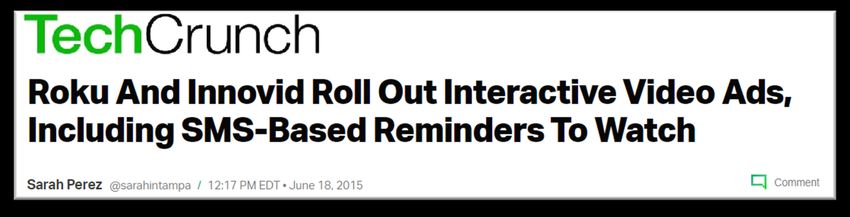
OVERVIEW
THE TV
 ECOSYSTEM
 IS SHIFTING
                                                                             $200 BILLION
                                                                                      LINEAR TV
 $200 BILLION
 of TV ad spending

 $15 - $20 BILLION
 of estimated ad spending                                                                                                                                CTV
 on CTV today                                                                $15-20
                                                                            BILLION

10 |                        Source: Dentsu, eMarketer
                            Note: $200bn estimate includes 2021 traditional TV ad spend of $169bn and assumes 2021 global CTV ad spend is ~2x US ad spend of $13bn
CTV CREATES OPPORTUNITIES
AND CHALLENGES
Centralized
Creative
Ad-Delivery
Personalization
and Interactivity
Advanced
Measurement
11 |Leading Independent Ad Delivery and
Measurement Platform for Connected TV
Empowering advertisers to shift investment
from linear to connected TVABOUT INNOVID
PEOPLE-FIRST: AN AWARD-WINNING CULTURE
       INNOVID’S Company Values
       Our shared values unite our team and drive
       our award-winning company culture

       Be GENEROUS                                                  HQ

       Be DARING

       Be UNBEATABLE

                                                                         SELECT INVESTORS

       ~365 Employees
              NYC Headquarters          4.8           99%
             15 Offices Worldwide      star rating   CEO approval

14 |
FOCUSED ON CTV BEFORE THERE WAS CTV
INNOVID = “INNOVATION + VIDEO”
Focus on CTV has led to a growing list of
industry firsts and key milestones:
INVENTION IS INGRAINED IN INNOVID’S DNA
2008 - 1st PATENT ü Insert interactive objects into
1st CTV advertising Exclusive Roku
video content
SDK to market ACR integration
ü Video-associated objects
ü Serving objects to be inserted
1stMRC certification 1st
ad serving into to videos and tracking usage
for CTV measurement Peacock statistics
ü Real-time monitoring of
1st interactive Named a leader sentiment with respect of a
Super Bowl ad by Forrester desired phrase
ü Analyzing sentiment based on
term taxonomies of UGC
15 |DELIVERING AND MEASURING ADS
ACROSS ALL MAJOR TV MEDIUMS
Innovid’s CTV advertiser software platform:
CTV Ad Delivery & Measurement
ü Automatically uploads and encodes advertising
creative to stream ads to any screen or device
ü Manages the physical delivery of ads –
Measurement
Media
Delivery
connecting marketers and publishers in real-time
Ecosystem
ü Independently measures performance across the
widest breadth of MRC accredited metrics
CTV
16 |PARTNERING ACROSS
THE ADTECH ECOSYSTEM
Fragmentation complicates advertising - we work with,
not against, the leading players in the technology stack CTV Ad Delivery & Measurement
INNOVID INTEGRATES ACROSS AD TECH: PLATFORMS SUPPORTED INCLUDE:
Demand Side Platform (DSP)
Programmatic Media Buying
Measurement
Supply Side Platforms (SSP)
Delivery
Programmatic Media Selling
Publisher Apps
Stream Content
Connected TV Devices
Connecting the TV to the Internet
17 |
CTVSTRATEGIC, EXCLUSIVE PARTNERSHIPS
TO ADVANCE CTV ADVERTISING
Leading in CTV innovation as acknowledged by industry-
first and exclusive relationships with leading providers
18 |GO-TO-MARKET
OUR GO-TO-MARKET STRATEGY

                                    Selling to brands,
                                    used by agencies

                                    Primary CTV technology
                                    platform used by our clients

                                    Technology fees based on
                                    ads delivered, not media
                                    spend

20 | Source: Kantar (https://www.kantar.com/), Winmo (https://www.winmo.com/)
  16
FOCUSING ON THE NEEDS OF
THE LARGEST TV ADVERTISERS
DISTRIBUTION OF TV AD SPEND BY TOP 200 US TV ADVERTISERS
HIGH CONCENTRATION AT THE TOP:
200 top U.S. TV
ADVERTISERS
represent
~ 75% of total U.S.
TV AD SPEND
21 | Source: Kantar (https://www.kantar.com/), Winmo (https://www.winmo.com/)
14INNOVID IS THE TRUSTED
DELIVERY PLATFORM
DISTRIBUTION OF TV AD SPEND BY TOP 200 US TV ADVERTISERS
ESTABLISHED FOOTPRINT:
INNOVID is already a
trusted ad delivery platform
~40%
of the top 200 U.S.
TV advertisers
22 | Source: Kantar (https://www.kantar.com/), Winmo (https://www.winmo.com/)
15 Source: Kantar
Note: Boxes represent relative U.S. TV spend by advertiser for Innovid and largest competitorDIFFERENTIATED OFFERING IS
WHY WE WIN WITH TV ADVERTISERS
Differentiated
CTV Technology + Unique
Market Position 120%+
2020 Annual Net
Revenue Retention
Only ad-server built to CTV Independent
True platform offering Not a media business
37%
(Ad Serving, Creative Tools, and Measurement) Projected Revenue
CAGR (2020 – 2023)
Proprietary SDK integrations Source of truth
Proprietary partnerships
Zero conflicts 80-85%
with entire ecosystem Gross Margins
A Highly Defensible and Expanding Moat
23 | Net Revenue Retention: Net Revenue Retention (NRR) Rate is calculated as percentage of revenue retained from existing core platform customers, including expansion revenue, downgrades, and churn.
17 Note: Retention is calculated for core platform clients; core clients represented ~89% of total 2020 revenueCTV IS DRIVING THE GROWTH IN OUR BUSINESS
CTV Impression Volume Growth Impression Volume by Device
(impressions in billions) (impressions in billions)
12
250 ’17 – ’20
h
wt
% Gr
o CAGR
10
780 YoY
‘2 200
De
c
61%
8 CTV
74Y% wt h 150
6 Y Gro
o
9
c ‘1
De
4 61o%Y Growth 100 8%
‘18 Y Mobile TV +
Dec Desktop TV
2 50
-
-
18
19
-19
19
-18
-18
20
0
20
9
8
-19
19
-18
18
0
0
20
2017 2018 2019 2020
-2
l-1
l-1
l-2
-2
v-
n-
v-
p-
p-
n-
v-
ay
ay
n
ar
ar
p-
Ju
Ju
ay
ar
No
Ju
No
Ja
Ja
Se
Se
No
Ja
Se
M
M
M
M
M
M
Desktop TV Mobile TV CTV
Source: Company data
24 | An immaterial volume (less than 5%) of impressions which are not automatically classified by device were omitted from the historical 2018-
23 2020 data in the impression chart. Revenue from these impressions is included in the company revenue by device on a prorated basis.CTV DRIVES OUR IMPRESSION VOLUME ACCELERATION
Impression Volume by Device Illustrative Global Market Potential
(impressions in billions)
CTV 626
Mobile TV ’18A – ’23E TV
CAGR (Linear + CTV)
Desktop TV 1
462
$200B
341
65%
CTV
234
186
148 16%
Mobile TV +
Desktop TV
2023
2018A 2019A 2020A 2021E 2022E 2023E
2
YoY Growth: $8B
CTV: 67% 60% 77% 58% 53% 2020
Other TV 13% 10% 26% 15% 14%
(Mobile/Desktop): $2B3 Note: Graphic is
not to scale.
Source: Company data, Dentsu, eMarketer, Kantar (https://www.kantar.com/), Winmo (https://www.winmo.com/)
An immaterial volume (less than 5%) of impressions which are not automatically classified by device were omitted from the historical 2018-2020 data
in the impression chart. Revenue from these impressions is included in the company revenue by device on a prorated basis.
Note: Illustrative market size based on current global TV advertising spend of $200 billion and Company data assuming constant $20 media CPM
1. $200bn estimate includes 2021 traditional TV ad spend of $169bn and assumes 2021 global CTV ad spend is ~2x US ad spend of $13bn
25 | 2. Projected 2023 CTV advertising spend for Innovid customers assuming constant $20 media CPM
3. Estimated 2020 CTV advertising spend for Innovid customers assuming constant $20 media CPMSTRONG PRICING WITH UPSIDE POTENTIAL
Impression Volume Has Grown ~2x While Pricing Has Been Stable
Tech Usage Fees,
$1.00 Not Media Spend
~2x
$0.75
“Always On” Every
Impression
$0.50
$0.31
$0.30
$0.25 Price Increases
from Cross-Sell and
Up-Sell
$0.00
Jan-18 Jul-18 Jan-19 Jul-19 Jan-20 Jul-20 Jan-21
Average Cost per Thousand Total Impression Volume
26 | Source: Company dataCTV DRIVES OUR PROJECTED REVENUE ACCELERATION
Annual Revenue
($ in millions)
CTV
$177 ’18A – ’23E
Mobile TV
CAGR
Desktop TV
$130
63%
61%
CTV
$95
56%
$69
48%
$56
$48 40%
21%
30%
29%
11%
33%
48% 47% 43%
38% Mobile TV +
Desktop TV
31% 23% 18% 14% 10% 8%
2018A 2019A 2020A 2021E 2022E 2023E
YoY Growth:
CTV: 57% 65% 59% 67% 60% 53%
Other TV (Mobile/Desktop): 3% 4% 5% 19% 16% 14%
Total Growth: 11% 17% 21% 38% 37% 36%
27 |PLATFORM EXTENSIONS DRIVE FUTURE REVENUE
Personalized ads
Interactive capabilities / experience
Most advanced CTV SDK
Innovid’s SDK powers Trade Desk, Magnite,
CTV Roku and Hulu
Personalization Leader in The Forrester Wave: Creative Advertising
Technology, 2020
Universal “Source of truth”
CTV
Ad Delivery Unbiased insight and data
TV-first, cookieless and compliant identity solution
CTV
Measurement Uniquely positioned to win as the ad server
Launched 2020 Driving industry-wide standardization
28 |
26FINANCIAL INFORMATION
KEY FINANCIAL HIGHLIGHTS

       ~$130M                                               § Highly predictable and visible re-occurring revenue:
       2022E Revenue
                                                                   ► Existing              clients generate ~90% of revenue each year1

          ~37%
           2022E                                                   ► Strong             net dollar retention over the last 3-years, exceeding 120% in 2020
       Revenue Growth

                                                                   ► Low          customer churn with 94% core customer retention in 2020
           ~81%
           2022E
                                                                   ► Strong     and stable pricing with path to higher margins with further adoption of
        Gross Margins
                                                                        highly differentiated products

       ~$16M                                                § Significant operating leverage, with low incremental costs as client impression
            2022E
                                                                   volumes grow
          Adj. EBITDA

30 |   1. Revenue from existing clients was 88%, 89%, and 88% in 2018, 2019, and 2020 respectively
STRONG AND INCREASING CORE CUSTOMER
# of Core Clients Core Client Retention Net Revenue Retention
% of Total Revenue
84% 85% 89%
121%
1%
0C A GR: 1 110%
114%
’18-’2 95
85 94%
88%
77 84%
2018 2019 2020 2018 2019 2020 2018 2019 2020
Net Revenue Retention (NRR) Rate is calculated as percentage of revenue retained from existing core platform customers, including expansion revenue, downgrades, and churn.
31 | Note: Logo retention and NRR are calculated for core platform clients onlyRAPID REVENUE ACCELERATION
($ in millions)
Quarterly Revenue
Q1 Q2 Q3 Q4 $30
$24
$23
$22
$18 $19
$17
COVID
Impact
$14 $14
$14 $13
$11
Q1-19 Q1-20 Q1-21 Q2-19 Q2-20 Q2-21E Q3-19 Q3-20 Q3-21E Q4-19 Q4-20 Q4-21E
YoY 17% 24% 33% 19% (6%) 67% 17% 30% 30% 16% 36% 30%
Growth
32 | Note: Quarterly revenue based on actual results up to and including Q1-21; Q2-21, Q3-21, and Q4-21 based on management projections
32P&L SUMMARY
1 2 ($ in millions)
Historicals Projections
Audited Unaudited Projected Long-Term
2018A 2019A 2020A 2021E 2022E 2023E Margins
Revenue $48.4 $56.5 $68.8 $94.8 $130.1 $177.3
% Growth 11.0% 16.7% 21.8% 37.8% 37.2% 36.3%
Cost of Revenue ($9.4) ($10.6) ($12.7) ($18.0) ($24.7) ($33.7)
Gross Profit $39.0 $45.9 $56.1 $76.8 $105.4 $143.6
% Margin 80.5% 81.3% 81.6% 81.0% 81.0% 81.0% 82% - 85%
R&D ($12.2) ($14.5) ($17.4) ($23.0) ($27.3) ($32.8) 14%
S&M (19.4) (29.0) (28.2) (35.8) (46.9) (56.7) 26%
G&A (5.9) (7.6) (7.9) (10.8) (15.6) (19.5) 8%
Total OpEx ($37.6) ($51.1) ($53.6) ($69.6) ($89.8) ($109.1) 48%
Adjusted EBITDA3 $1.4 ($5.2) $2.6 $7.2 $15.6 $34.6
% Margin 2.9% -9.2% 3.8% 7.6% 12.0% 19.5% ~35%
1. Internal management results prior to PCAOB audit completion
2. No quantitative reconciliation of EBITDA to the most directly comparable GAAP financial measure has been provided for projections because management
33 | cannot reliably predict all of the necessary components of the GAAP financial measure without unreasonable effort
3. Adjusted EBITDA includes add-back of stock-based compensation from 2018 – 2020; stock-based compensation not projected for 2021 – 2023GROWTH STRATEGY
MULTIPLE LEVERS TO DRIVE HIGH
       GROWTH FOR FORESEEABLE FUTURE

                                                                        Win new logos

                                                     Global expansion
                                Upsell additional
                              products & solutions
                                 (Acquisitions &
                                  Home-Grown)
            Benefit from
         volume growth of
         existing customers

35 |
  27
INVESTMENT HIGHLIGHTS
1 Benefiting from the explosive growth of streaming content driving
“cord-cutting”, “cord shavers” and “cord-nevers”
$200 billion of TV ad spend is moving from linear to CTV to reach
2
digital audiences and requires digital infrastructure
Innovid is a leading independent platform for CTV ad delivery and
3
measurement infrastructure
4 Exclusive technology relationships with clients creates strong customer
retention
Predictable business model with consistent cohort performance as
5
client impression volumes scale
Strong revenue growth with high software gross margins while
6
increasing profitabilityVALUATION & COMPARABLES
DEFINING THE PUBLIC COMPABLE
       UNIVERSE FOR INNOVID
       Innovid is an Infrastructure Software Platform, collaborating with High Growth Ad Tech Platforms

                     High Growth Ad Tech Platforms                   Infrastructure Software Platforms

  Market /
   Sector     ü ü ü ü ü
  Business
   Model
              ü                                                    ü ü ü ü
38 |
OPERATIONAL BENCHMARKING
Median: 30.1% Median: 37.8%
54.9%
51.1%
2021E 44.1%
37.8% 36.1% 29.7% 31.5%
REVENUE 28.8% 23.6% 24.2%
GROWTH
Innovid DoubleVerify Magnite Roku Trade Desk Viant BigCommerce Fastly Shopify Twilio
Median: 26.0% Median: 28.9%
40.2%
37.2%
31.6% 32.4% 31.9%
2022E 28.3% 25.9%
23.7% 21.7% 22.5%
REVENUE
GROWTH
Innovid DoubleVerify Magnite Roku Trade Desk Viant BigCommerce Fastly Shopify Twilio
39 | Source: Management projections, FactSet (as of 6/16/21)VALUATION BENCHMARKING
Median: 11.4x Median: 17.9x
27.9x
19.6x
TEV / 2022E 18.5x 14.3x 17.3x
REVENUE 13.8x 9.2x 12.0x 10.8x
8.5x
Innovid DoubleVerify Magnite Roku Trade Desk Viant BigCommerce Fastly Shopify Twilio
Median: 0.4x Median: 0.7x
2022E
0.8x 0.9x
GROWTH ADJ. 0.7x 0.6x 0.5x
REVENUE 0.5x
0.4x 0.4x
MULTIPLE1 0.3x
0.2x
Innovid DoubleVerify Magnite Roku Trade Desk Viant BigCommerce Fastly Shopify Twilio
40 | Source:
1.
Management projections, FactSet (as of 6/16/21)
TEV / 2022 Revenue divided by 2022E YoY Revenue GrowthTRANSACTION SUMMARY
§ Pro forma anticipated enterprise value of $1.1 billion
§ $403 million total anticipated cash proceeds consisting of:
► $253 million from ION Acquisition Corp. 2 Ltd.
► $150 million in target PIPE proceeds expected to be raised at
$10.00 / share, including sponsor participation of up to $50 million at
the Company’s discretion
+ §
§
Existing Innovid shareholders expected to retain ~64% of the pro forma
company
Use of proceeds anticipated to include ~$200 million of cash to
balance sheet, which is anticipated to be used to pursue organic growth
strategies and inorganic growth through opportunistic acquisitions, with
balance of funds raised as secondary proceeds to existing Innovid
shareholders
§ Completion of transaction is expected by Q4 2021
41 |Leading Independent Ad Delivery and
Measurement Platform for Connected TV
THANK YOU.
Investors@Innovid.comAPPENDIX
TRANSACTION OVERVIEW
                                  Anticipated Sources and Uses                                                                Anticipated Pro Forma Valuation and Ownership Split

      Sources ($M)                                                                                                           Pro Forma Valuation ($M)
      SPAC Cash in Trust1                                                      $253                           20%            PF Shares Outstanding3                 131.0
      PIPE Investment2                                                          150                            12%           Share Price                           $10.00
      Innovid Equity Rollover                                                   844                           68%            PF Equity Value                       $1,310
      Total Sources                                                          $1,247                          100%            (+) PF Net Debt / (Cash)4              (210)
                                                                                                                             PF Enterprise Value                   $1,100
                                                                                                                             PF EV / 2022E Revenue                  8.5x
      Uses ($M)                                                                                                              2022E Revenue                          $130
      Cash to Selling Shareholders                                             $163                            13%                              SPAC
      Cash to Balance Sheet                                                     200                            16%                            Investors
                                                                                                                                                19.3%
      Innovid Equity Rollover                                                   844                           68%
                                                                                                                                            SPAC
      Fees and Expenses                                                          40                            3%                          Sponsors
                                                                                                                                             4.8%
      Total Uses                                                             $1,247                          100%
                                                                                                                                                                   Existing
                                                                                                                                               PIPE              Shareholders
       Note: All values in millions except for share price. Assumes no redemptions from SPAC investors. Excludes impact of                     11.4%                64.4%
           7.06m sponsor warrants and 3.16m public warrants
       1.   SPAC cash amount subject to change depending on interest earned
       2. Includes $50.0m Forward Purchase Agreement from SPAC sponsors
       3. Includes 84.42m Innovid rollover shares, 15.00 PIPE shares, 6.33 sponsor shares and 25.30 SPAC shares
44   | 4. PF net cash calculated as pre-transaction net cash of $10m plus cash proceeds from transaction of $200m
NET INCOME TO ADJUSTED EBITDA RECONCILIATION
($ in millions)
1
Historical Annual Results
Audited Unaudited
2018A 2019A 2020A
Net Income ($0.3) ($7.1) ($0.7)
Depreciation and Amortization 0.3 0.4 0.9
Expenses
Finance and Other Expenses, Net 0.6 0.4 0.9
Taxes 0.4 0.7 0.9
Stock-based compensation 0.4 0.4 0.6
Adjusted EBITDA2 $1.4 ($5.2) $2.6
1. Internal management results prior to PCAOB audit completion
45 | 2. Adjusted EBITDA includes add-back of stock-based compensationYou can also read


