Investment Memorandum - Jul 2016 Nhung Thi Hong Nguyen, Quynh Huong Nguyen, Yu Luo, David Bodika - Hire Lily Nguyen | Investment ...
←
→
Page content transcription
If your browser does not render page correctly, please read the page content below
Investment Memorandum
                Jul 2016

Nhung Thi Hong Nguyen, Quynh Huong Nguyen,
            Yu Luo, David Bodika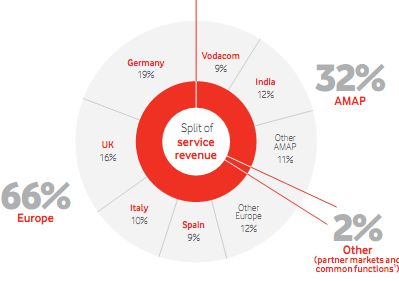
Agenda

     1   INDUSTRY ANALYSIS

     2   COMPANY OVERVIEW

     3   ACQUISITION PROPOSAL

     4   APPENDIX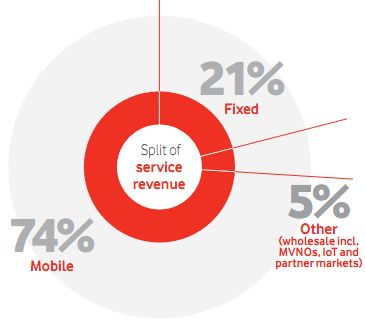
UK Internet Service Providers Industry

Key points within the industry                                                              Key statistics snapshot
•     The UK Internet Service Providers Industry includes operators that deliver internet
      access via fixed lines to businesses, households and the government. The
      industry revenue has grown with a CAGR of 4.6%1 over the past 5 years, much
      outperforming other telecommunications industries
                                                                                            5 ISPs own 92% of market share (2014)
•     The industry is projected to grow at a CAGR of 3.5% to reach £8.7bn over the 5
      years through 2020-212
                                                                                                   Others              8%
•     The market has high level of concentration, with top 5 players having market                    EE         4%
      share of 92%. More than 60 other competitors occupy 6% of market share3                    TalkTalk                     14%
                                                                                             Virgin Media                             20%
•     The industry is characterized by a high level of competition which is favored by
      policy makers as it benefits customers and protects them from potential abuses                  Sky                               22%
      (monopoly or oligopoly)                                                                          BT                                                32%
                                                                                                            0%         10%          20%        30%             40%
•     Competition is likely to increase significantly over the next 5 years as companies
      intend to use their economies of scale to expand their product ranges and client      Moving towards quadruple service
      base. One of the trends is moving towards quadruple service (providing 4
      services including wired and wireless telephony, broadband and TV)
                                                                                                                      BT     Sky     Virgin   TalkTalk    Vodaphone
•     BT’s recent acquisition of EE - the wireless telecom leader - demonstrates the                                                 Media
      move towards quad-play. BT used to be a state-owned monopoly ISP until its
      privatization in the 80s. BT’s acquisition of EE can strengthen its dominant          TV
      position that can hurt competition and other competitors. BT now can
      continue to abuse its control of Openreach (the copper cable system of all other
                                                                                            Broadband
      ISPs), and charge high price to its customers

•     Others ISPs are also considering M&A as a way to expand market share and              Fixed line
      increase competitive advantages. E.g.: Sky is expected to enter mobile telephony
      market, Three can potentially acquire O2.                                             Mobile
1,2  Source: IBIS World
3   Source: Ofcom
UK Internet Service Providers Industry – Five Force Analysis
Threat of new entrants – HIGH Bargaining power of buyers – HIGH
Threat of Price is usually the most important factor in
The barriers to entry in this industry are
new choosing a ISP.
the lowest of all telecommunications
industries. This is highlighted by the high entrants
number of small operation ISPs HIGH
Threat of substitutes - MEDIUM
Substitute for fixed line internet can be mobile
internet. But most ISPs tend to provide both
Bargaining Bargaining
Competitive
power of power of
Rivalry
suppliers buyers
HIGH
HIGH HIGH
Competitive Rivalry – HIGH
Competing market share from well-
established players such as BT is very
Bargaining power of suppliers - HIGH difficult. As competition intensifies in this
The national broadband network (OpenReach) Threat of industry, the need for innovative marketing
is controlled by BT. Other ISPs such as Sky and substitutes and pricing campaigns to win subscribers is
TalkTalk rely on the regulated wholesale access MEDIUM increasing. Large companies with operations
to serve their broadband and telephone across the media sector are in a better
customers position to compete on price.UK Mobile Industry
Key points within the industry Key statistics snapshot
• Industry revenue decreased at a CAGR of 2.7% in 2011-20161, owing to falling demand for voice
services, lower call and text charges and competing attempts to retain customers.
• Industry gained more subscribers thanks to higher demand for data and smartphone. The
proportion of UK adults with smartphone increased from 51% in 2013 to 66% in 20152. Meanwhile,
the number of active mobile subscriptions jumped from 80.6 million in 2010 to 83.7 million in 2015.
4 mobile carriers own 96% of market share (2015)
• However lower average revenue per user reduced overall revenue.
• Concentration in the industry is high, with the four largest companies estimated to account for EE, 31% Vodafone, 25% Others, 4%
95.8% of the market in 2015-163. EE was the market leader in the mobile industry. There are many
small businesses that offer mobile services. None of these companies directly competes with the big
four in a significant way
O2 by Three by
• The resulting pressure on operators has increased the importance of scale. In order to secure Telefonica, Hutchison,
revenue, UK mobile operators have high pressure of increasing customer base to achieve 29% 11%
economies of scale.
Higher demand for smartphone and data Vs. Lower ARPU
• Higher demand for internet browsing, checking
HIGHER LOWER • VoIP apps such as WhatsApp, Skype and
emails, social media, using game, news & other apps
DEMAND FOR AVERAGE Line bypass traditional distribution by
• Rapid growth of online mobile shopping, otherwise Vs.
SMARTPHONE REVENUE PER providing services over the internet
known as m-commerce
AND DATA USER • Competition among mobile carriers
• The development of the app market
DOWNWARD PRESSURE ON INDUSTRY
TOTAL REVENUE
1,3 Source: IBIS World
2 Source: OfcomUK TV Industry
Key points within the industry
• UK TV industry includes providers that bring a deluge of digital, cable, internet and satellite TV services in both paid and free-to-watch options.
• The UK television industry generated £13.2bn in revenue during 2014, a CAGR of 3.5% over the past five years1.
• Pay TV subscription revenue reached £6.0bn in 2014, accounting for 45% of total TV revenue. Pay TV is one of the main drivers behind the industry’s growth, with a
CAGR of 5.2% over the last five years2
• The UK TV market is highly concentrated. Currently the main TV providers in the UK are Sky, Virgin Media, BT and TalkTalk.
• There were 17.4 million pay TV subscribers in the UK in 2014, with Sky accounting for 61% of market share and Virgin Media 22%3
• Sky is the market leader in the UK Pay TV Industry, having been the most successful in developing products, retaining customers and lowering churn (percentage
of subscribers who discontinue their subscriptions)
• TalkTalk just launched TV service in 2013, but has become the fastest company to develop TV business with 1.1 million subscribers in 2015
Total TV industry revenue Pay TV operators ranked by No. of subscribers in the UK in 2015 (in 1.000)
13.5 13.2 14,000
12,000
13.0 12.8 12,000
12.4 12.5
12.5 10,000
12.0 11.8 8,000
11.5 11.1 6,000
3,734
11.0 4,000
1,900
10.5 2,000 1,100 1,000
10.0 -
2009 2010 2011 2012 2013 2014 Sky Virgin Media Freesat TalkTalk BT
1,2 Source: Ofcom
3 Source: Strategy AnalyticsUK Telephone Industry
Key points within the industry
• The industry has struggled in recent years as demand for traditional voice services has fallen. Total industry revenue declined at a CAGR of 4% for the past five
years and is estimated to continue the drop at a CAGR of 3.2% in the next five years1
• Some factors resulting in this trend include:
• Competition from mobile phone operators and other substitute services. The average cost of a mobile call in pence per minute is about a third cheaper than a
fixed-line call2
• Cheaper option for Internet communication media, such as email, instant messaging and VoIP3.
• The market is highly concentrated. BT is the market leader, generating around 54% of industry revenue. Top 4 participants, including BT, Sky, Virgin Media, and
Vodafone, generated about 80% of industry revenue in 20154
• Convergence between mobile and fixed-line telephone services will be an important theme over the next 5 years. Offering bundled packages that combine
telephone, broadband services, cable TV and mobile services in one bill will result in cheaper prices for customers, but will also drive down industry profit margins.
More M&As will be carried out and this will change the competitive landscape of the industry over the next five years4
Fixed-line call volumes have been declining at a CAGR of 9%
Key statistics snapshot over the past 5 years5
140 130 124
Billions of minutes
120 112
103
100 92
80
4 operators own 80% of market share (2015) 80
60
BT, 54% Sky, 13% Vodafone, 5% 40
20
0
Others, 20% 2009 2010 2011 2012 2013 2014
Virgin Media, 8%
1,2,4 Source: IBIS World 5 Source: Ofcom
3 VoIP: Voice over Internet ProtocolAgenda
1 INDUSTRY ANALYSIS
2 COMPANY OVERVIEW
3 ACQUISITION PROPOSAL
4 APPENDIXTalkTalk Group PLC Overview
Summary Financial performance
Headquarter Evesham Street, London, UK (£ mil, except per share data) Projection period
2014A 2015A 2016A 2017E 2018E 2019E 2020E 2021E
Industry Fixed line Telecommunication
Revenue 1,722 1,795 1,835 1,872 1,966 2,025 2,085 2,138
Founding 2002, as part of Carphone Warehouse Group % Growth 3.1% 4.2% 2.2% 2.0% 5.0% 3.0% 3.0% 2.5%
PLC EBITDA 191 199 177 206 241 273 308 342
IPO TALK 2010 on the LSE % Margin 11.1% 11.1% 9.6% 11.0% 12.3% 13.5% 14.8% 16.0%
CAPEX 107 112 166 131 133 132 130 128
Employees 2,290 % of Sales 6.2% 6.2% 9.0% 7.0% 6.8% 6.5% 6.3% 6.0%
Geographic mix UK Share price £ 2.19 FY17E
Full Dil Shares (m) 958 Revenue 1,872 1.12x
Product offering
Equity value 2,100 EBITDA 206 10.2x
Provides broadband and landline telephone Plus Debt 709 FY18E
services for private households under the AOL
Less Cash (10) Revenue 1,966 1.07x
Broadband brand
Fully Dil EV 2,799 EBITDA 241 8.7x
Offers mobile services to phone and
broadband customers through a Mobile Virtual 52-week trading overview
Network Operator (MVNO)
FTSE250
Provides a triple-play package of IPTV, video
on demand, telephony and broadband internet
access with 2 options available – Plus TV or
Essentials TV
TalkTalk
Offers a wide range of voice, data connectivity
products and interconnection services to
business customers and other carriersCompany Overview
Overview TalkTalk’s development owed largely to M&A activities
• TalkTalk Telecom Group PLC is a • UK operations of • Blinkbox (£6m)
• Executel Limited
United Kingdom-based quadruple Tiscali S.p.A • Virgin Media off-net
provider of communication services, +117,000 • GreystoneTeleco +305,000
(£238m) m Limited ((£15m) base (£25m)
which include fixed line broadband, customers customers
• UK Telco Limited • Tesco broadband &
voice telephony, mobile and television
services. (£6m) voice base (£18m)
• TalkTalk is one of the four leading
2010 2012 2015
ISPs in the UK, accounting for 14% of
market share in terms of the number of
broadband subscribers in 2015 2011 2014
• Opal 2CCH &
• The Company offers its services to the Southern The remaining 75%
UK households under TalkTalk brand +1.7m Communications +148,000 stake of Future +230,000
and to businesses under TalkTalk customers Limited (£4m) customers Office customers
Business Communication Ltd
• V Network Limited
(£1m) (£3m)
History Market share has been declining1
23%
• Founded in 2003, TalkTalk was part of Carphone Warehouse
(CPW) for 7 years until 2010 when it demerged and was listed on 20%
18% 17%
the LSE. As one of the leading telecom companies in the UK, 16%
TalkTalk has a relatively short history compared to other 14%
competitors (BT and Sky, founded in 1846 &1989, respectively).
• TalkTalk’s development owed largely to M&A activities and
customer acquisition activities. From 2010 to 2016, TalkTalk has
acquired more than 10 telecommunications companies.
2009 2010 2011 2012 2013 2014
1 Number of subscribers, source: OfcomStrategy Overview
Strategy Low-cost broadband
• Among four key ISPs, BT and Virgin Media Fixed broadband price from major ISPs1
Integration of
customers are positioned at the premium end of the Standard Standard, ≥ 30 ≥ 30
gained through market, with significantly higher price points. & fixed fixed line Mbit/s & Mbit/s,
acquisition They focus on speed reliability of broadband
line & pay TV fixed line fixed line
connections. Sky focuses on content and
discount for packaged services. & pay TV
BT 21.49 24.49 24.49 24.49
Growing range • TalkTalk targets on value-for-money
of data services broadband service through Local Loop EE 26.35 29.35 36.35 39.35
for businesses Unbundling (LLU). Unbundling allows the use
of existing cables from BT to provide services Sky 23.90 33.89 26.40 46.40
to consumers. This can result in higher
TalkTalk 21.70 26.70 31.70 36.70
speeds and lower pricing because TalkTalk is
Delivering value still able to decide their own tariffs Virgin Media - - 34.49 38.99
5 for money quad
play services Key points about TalkTalk’s strategy Broadband complaints per 100k customers2
principles • Low pricing makes TalkTalk more sensitive to 40
competition and price wars in the industry
Improving 30
operating • Maintaining low price in the long term has become
a challenging target. Since May 2015, TalkTalk has 20
efficiency and
announced price increase for 3 times (May, Jun, Oct)
effectiveness in most of service lines and also changed the terms of 10
some of its plans to make them less generous. 0
Q1'14 Q2'14 Q3'14 Q4'14 Q1'15 Q2'15 Q3'15 Q4'15
• Despite spending a great deal of money on M&A,
Offering fibre TalkTalk’s market share has been declining TalkTalk BT
access Sky Virgin Media
• TalkTalk faces more customer complaints than other
ISPs Industry average
1 Source: Pure Pricing UK Broadband Briefing, 10 June 2015
2 Source: OfcomFinancial Highlights
Highlights Revenue mix
• Revenue breakdown includes on-net, off-net1 and corporate customers. Revenue from on-net customers 1,600
1,333 1,399
has increased at CAGR of 6.6% over the past 5 years, while corporate revenue also increased at CAGR 1,400 1,259
of 5%. However, revenue from off-net base has been declining. The off-net base therefore was disposed 1,170
in FY2016 as this is proved to be a less profitable business. 1,200 1,084
1,000
£ million
• Thanks to the Company’s strategy to focus on high-margin products for on-net customers, gross profit
margin improved from 50% in 2010 to 54% in 2016. 800
600
• However, operating expense has been a burden to company’s EBITDA and EPS. Heavy investment 316 322 340 375 384
in customer acquisition, M&A and marketing activities has caused operating expense to increase since 400 287
178 128
the company’s demerger from Carphone Warehouse in 2010. EBITDA, therefore, has been struggling in 200 87 55
recent years.
-
• While EPS has been decreasing, TalkTalk managed to increase dividend per share over the years. 2012 2013 2014 2015 2016
However, the BOD’s commitment to raise dividend per share by 15% each year will put pressure
on the company’s ability to generate cash flow in years to come On-net Off-net Corporate
Historical EBITDA Historical margins EPS and DPS
400 55% 55% 55% 54%
350
343 60% 50% 50% 52% 20 15.9
294 50% 14.9 13.8
300 15 12.0
40% 10.4
£ million
250 219 9.0
187 183 30% 20% 18% 10
200 172 174 5.6 10.6
20% 10% 12% 11% 10% 9% 3.0
150 5 7.7
10% 0.2
100 0% 0 3.7
50 2010 2011 2012 2013 2014 2015 2016 2010 2011 2012 2013 2014 2015 2016
0 -5
2010 2011 2012 2013 2014 2015 2016 Gross margin EBITDA margin Dilutted EPS DPS
1off-net customers refer to customers who are served via BT equipment in local exchanges on a
wholesale basis, rather than via TalkTalk’s own – which is called on-net customersFinancial Highlights (cont.)
Highlights Debt/Equity ratios of major ISPs
• Total debt has nearly doubled over the last five years in order to fund for 3.50 3.07
intensive capital expenditure and continuous growth in dividend. In FY 2016 only, 3.00 2.7
net debt increased by £90m to £679m (FY15: £589m) driven by an increase in the
dividend, exceptional costs and increased capex. TalkTalk total debt to total equity ratio 2.50
is currently at 3.07 times, higher than BT (1.37), Sky (2.70) and Vodafone (0.43) 2.00 1.68
1.37
1.50
• Cash flow from operation activities (CFO) was positive since 2010 and was one of the
major funding sources for TalkTalk’s intensive investing activities 1.00
0.43
0.50
• In the future, the company’s commitment to growth in capital expenditure and dividend
-
will generate more pressure on its cash flow and leverage
TalkTalk BT Sky Vodafone Industry
mean
Historical cash flow Historical leverage
400 25
800 709 3.50
300 20
700 615 3.00
200 15 600
490 2.50
10
£ million
100 500 430 435 400 2.00
£million
5 400
- 1.50
2010 2011 2012 2013 2014 2015 2016 - 300
(100) 200 1.00
(5)
(200) (10) 100 0.50
(300) (15) 0 -
2011 2012 2013 2014 2015 2016
(400) (20)
Total debt Debt/equity
CFO CFI CFF Net change in cashSummary
Market conditions TalkTalk’s strategy options Issues
• Limited resources
1 Organic growth
• Time consuming
• Market is mature
This has been TalkTalk’s strategy for the past 7
Importance
years. The strategy has proved to be costly
of scale in Increased
2 and ineffective, because:
creating dominance Acquiring other
• Market share has been declining
competitive from BT companies
• EBITDA and EPS barely increased
advantage
• BOD face challenges to maintain returns to
Integration shareholders growth in upcoming years
of
telecommu
-nication
services
3 Merging with another What company to merge with to increase
company market power and exploit synergies?
TALKTALK has grown via M&A and has developed a customer base that makes it the 4 th largest ISP in the UK. However, this strategy has not fully
realised the available shareholder value. Our solution is to merge TALKTALK with another company to gain the benefits of increased market power and to
exploit synergiesAgenda
1 INDUSTRY ANALYSIS
2 COMPANY OVERVIEW
3 ACQUISITION PROPOSAL
4 APPENDIXAcquirer Overview – Vodafone Group Plc
Overview Germany & the UK are the biggest markets Fixed services increasing importance
• Vodafone is one of the largest mobile
telecommunications companies in the world,
generating revenue of £41bn in FY2016.
• Vodafone has a global footprint with equity
interests and partnerships across five continents
and over 70 countries and holds the number one or
two positions in terms of market share of revenue in
14 of the countries in which it operates
• 66% of service revenue came from Europe.
Germany and the UK are the largest markets with
revenue accounting for 19% and 16% of total
service revenue in 2016, respectively.
• Vodafone is one of the four biggest mobile
operators in the UK, accounting for 25% of market
share2
Why is Vodafone a potential acquirer UK presence in fixed broadband is still modest
• In recent years, Vodafone has taken advantages of growth opportunities to move from
mobile operator to delivering a broad mix of communication services including mobile, Mobile Fixed
fixed broadband, video content, cloud and hosting and Internet of Things offerings Customers Market Customers Market
• Vodafone’s strategy is to increase market share in fixed broadband. Fixed broadband share share
now accounts for 21% of service revenue, with 13m customers (compared with mobile UK 18.2m 25% 0.1m 5%
revenue of 74% and 462m customers). Vodafone has spent £15bn investing in fixed
businesses in recent years Germany 30.3m 33% 5.8m 20%
• Vodafone’s UK presence in fixed broadband is still modest, with only 101k customers Spain 14.3m 28% 3.0m 22%
and 5% of market share
1 AMAP: Africa, Middle East and Asia Pacific
2 Source: IBIS WorldTransaction Rationale and Summary
Deal headlines Transaction rationale
• As the third biggest ISPs in the UK, TalkTalk provides Vodafone the opportunity to expand its
Deal value £2,320m
presence in the UK fixed broadband market
Nature of bid Friendly • TalkTalk can take advantage of Vodafone’s mobile customer base of 18 million customers to
enhance cross-selling
Premium 10.5%
• Vodafone, with strong free cash flow and healthy balance sheet, can help to invest in TalkTalk’s
Price per share £2.42 infrastructure and technology, and invest in customer acquisition.
• As Vodafone currently has modest presence in the UK fixed broadband market, the merger with
Consideration 80% cash, 20% stock
TalkTalk will not decrease the number of key players, and therefore, will not dissatisfy regulators
Accretion 2.7% FY18; 4.6% FY19 • With larger customer base and scale after the acquisition, TalkTalk and Vodafone can compete
with increased dominance of BT
Estimated synergy FY18: Revenue £59m; SG&A £79m
• Potential synergy can be achieved from cross-selling, higher competitiveness, higher
price, and reduced operating expense thanks to economies of scale
Transaction multiples Valuation range
Equity value (10% premium) £2,320m
Enterprise value £3,019m EV/EBITDA 2,555 3,858
FY18E Revenue £1,996m
FY18E EBITDA £241m DCF 1,911 4,580
No. of diluted shares out 958.2m
- 1,000 2,000 3,000 4,000 5,000
EV/2018E Revenue 1.54x
TalkTalk EV: £3,019m
EV/2018E EBITDA 12.5xForecast and Valuation
Key Forecast Assumptions Valuation
• Off-net customer base is sold Risk Free Rate 1.0% Wd = D/(D+E) 75%
• On-net and corporate revenue grows at 5% in the first 2 years, then growth Market Risk Premium 7.4% We = E/(D+E) 25%
declines due to competition Unlevered beta 0.65 Cost of Debt (Rd) 3.4%
• Gross margin improves from 54% to 55% Levered beta 2.15 WACC 6.0%
Cost of Equity 16.7% Terminal growth 2%
• SG&A remains high in FY17 at 43% of sales, then decreases gradually to
39% of sales in FY21
• Buyer’s tax rate is used for forecast (27%-25%) Sensitivity analysis – Perpetuity Growth Method
• Capex is around 6-7% of sales Total Enterprise Value
Terminal Perpetuity Growth Rate
• Dividend per share grows at 15% in FY17&18, then 10%
1.0% 1.5% 2.0% 2.5% 3.0%
Forecast summary Discount 5.5% 2,776 3,058 3,421 3,904 4,580
Rate 6.0% 2,495 2,715 2,991 3,345 3,817
£mil except per share data (WACC) 6.5% 2,265 2,441 2,656 2,925 3,271
2016A 2017F 2018F 2019F 2020F 2021F
7.0% 2,073 2,217 2,389 2,599 2,861
Revenue 1,835 1,872 1,966 2,025 2,085 2,138 7.5% 1,911 2,030 2,170 2,338 2,543
Growth 2.0% 5.0% 3.0% 3.0% 2.5%
Sensitivity analysis – EBITDA Exit Multiple Method
Gross profit 990 1,011 1,066 1,103 1,142 1,176
Total Enterprise Value
EBITDA 177 206 241 273 308 342 Terminal EBITDA Multiple
Net income 2.00 22.45 39.24 54.65 71.56 90.12 8.5x 9.5x 10.5x 11.5x 12.5x
Discount 5.5% 2,790 3,057 3,324 3,591 3,858
EPS 0.00 0.02 0.04 0.06 0.07 0.09 Rate 6.0% 2,729 2,990 3,250 3,511 3,772
DPS 15.90 18.29 21.03 23.13 25.44 27.99 (WACC) 6.5% 2,670 2,924 3,179 3,433 3,688
7.0% 2,612 2,860 3,109 3,358 3,607
CAPEX 166 131 133 132 130 128 7.5% 2,555 2,798 3,041 3,284 3,527Accretion/Dilution
Pro-forma Income Statement (with synergy) – Combined Company (80% cash)
£mil except per share data 2015A 2016A 2017F 2018F 2019F 2020F 2021F
Revenue 44,022 42,808 45,159 46,178 47,703 49,134 50,576
% Growth 9.9% -2.8% 5.5% 2.3% 3.3% 3.0% 2.9%
Gross profit 21,890 21,026 22,656 23,175 23,947 24,671 25,399
EBITDA 11,908 11,533 12,787 13,487 14,371 15,243 15,947
EBITDA Margin 27.1% 26.9% 28.3% 29.2% 30.2% 31.1% 31.6%
Net income - - 1,529 2,195 3,022 3,751 4,381
Diluted EPS (pence) - - 5.68 7.97 10.78 13.26 15.93
Vodafone Standalone Dil EPS (pence) - 5.70 8.19 11.27 13.99 16.34
£ Accretion / (Dilution) 0.02 0.22 0.49 0.73 0.40
% Accretion / (Dilution) 0.4% 2.7% 4.6% 5.5% 2.5%
FY18 Acrretion/Dilution Sensitivity Analysis
Premium
-5% 0% 5% 10% 15% 20% 26%
20% stock / 80% cash 3.1% 3.0% 2.8% 2.7% 2.6% 2.4% 2.3%
100% cash 3.7% 3.6% 3.5% 3.4% 3.3% 3.1% 3.0%
50% stock / 50% cash 1.9% 1.7% 1.5% 1.3% 1.1% 0.9% 0.7%Trading Statistics of Selected Companies
Quad play Mobile & Fixed line Others
120,000 101,539
EV (£ mil)
100,000
73,414
80,000
54,551
60,000
40,000 20,624
20,000 6,447 2,963 775 549 291
0
Deutsche Telekom Vodafone BT Sky Plc Inmarsat Plc TalkTalk Telecom Plus Plc KCOM Group PLc Manx Telecom Plc
20,000 17,845
EBITDA
15,000
10,192
10,000
6,162
5,000 2,320
477 174 115 57
-
Deutsche Telekom Vodafone BT Sky Plc Inmarsat Plc TalkTalk KCOM Group PLc Telecom Plus Plc
EV/EBITDA
20.00 17.03
13.52 13.51
15.00
8.89 8.85
10.00 7.20
5.69 4.76
5.00
0.00
TalkTalk Telecom Plus Plc Inmarsat Plc Sky Plc BT Vodafone Deutsche Telekom KCOM Group PLc
EV/Sales
10.00 7.72
5.00 2.88 2.67 1.83 1.79 1.61 1.57 1.04
0.00
Inmarsat Plc BT Sky Plc Deutsche Telekom Vodafone TalkTalk KCOM Group PLc Telecom Plus Plc
Source: DatastreamAgenda
1 INDUSTRY ANALYSIS
2 COMPANY OVERVIEW
3 ACQUISITION PROPOSAL
4 APPENDIXTalkTalk Board of Directors
Name Position Period of Background
Office
Sir Charles Dunstone Chairman 2010-present Founded Carphone Warehouse PLC in 1989 and is one of the co-founders of TalkTalk.
John Gildersleeve Deputy Chairman 2010-present Previously a director at Tesco PLC and Vodafone Uk. Also served on the board for Carphone Warehouse
PLC from 2000-2010
Dido Harding CEO 2010-present Previous lines of work include Sainsbury’s Convenience Director, Tesco’s International Support Director
and Commercial Director, having been involved in ‘value added foods’. Gained much of her retail
experience with Kingfisher PLC and Thomas Cook Limited
Iain Torrens CFO 2015-present Group Finance Director of ICAP PLC 2010-2014. Numerous financial roles with ICAP and plc, CP Ships
Limited and Cookson Group plc
Tristia Harrison Managing Director 2014-present Joined Carphone Warehouse PLC in 2000 where she held numerous senior executive positions including
Consumer UK Marketing Director in Sep 2003. Following this she was appointed Group Marketing Director where she
was responsible for CPW, AOL and TalkTalk, as well as being appointed Chief Marketing Officer for Best
Buy Europe in 2000
Charles Bligh Managing Director 2014-present Has 22 years experience working in large product and service businesses internationally including several
Business senior executive roles at IBM.
John Allwood Non-Executive 2010-present Previously COO and Group Finance Director of Mecom Group plc. Former CEO of Orange UK and Mirror
Director Group PC
Brent Hoberman Non-Executive 2010-present Founded lastminute.com, made.com, Founders Forum and PROfounders Capital.
Director
James Powell Non-Executive 2012-present Currenty spent 14 years at Thomsons Reuters having also held numerous senior leadership positions with
Director Solace Systems, Citadel Investment Group and TIBCO Finance Technology during this time.
Sir Howard Stringer Non-Executive 2012-present Previously the Chairman, CEO, President and Representative Corporate Executive Officer at Sony
Director Corporation. Prior to this he spent 30 years as a journalist, producer and executive at CBS Inc.
Ian West Senior Independent 2011-present 20 years of experience in telecoms and media sector. Main jobs included 11 years with BSkyB and co-
Director founding Top Up TV in 2003.TalkTalk Ownership Structure
From 2011 to 2015, the list of major shareholders of the Company stayed relatively similar, with Sir Charles Dunstone and David Ross (the two founders of CPW and
TalkTalk) holding a major stake (respectively more than 30% and 12%). However, in 2015, Capital Research Global Investors increased their stake in TalkTalk from 6.4%
to 12.16%.
Shareholder % Shareholdings (at the end of each financial year)
2011 2012 2013 2014 2015
Sir Charles Dunstone (Chairman) 32.29 31.58 30.79 30.77
Capital Group 5.54 7.5 6.76 6.40 14.82
David Ross (Co-founder) 12.82 12.71 12.42 12.16 12.16
INVESCO Asset Management Ltd. 4.71 3.02 6.75
Alken Asset Management LLP 3.20 4.89
Group ESOT 4.57 4.16 3.57 3.41
Jupiter Asset Management 5.21 4.59 3.91
Fidelity Worldwide Investment (UK) Ltd. 3.21
Schroder Investment Management Ltd. 3.15
M&G Investment 3.04
FMR LLC 4.98
FIL Limited 4.95
Government of Singapore Investment Corporation Pte Ltd. 3.98TalkTalk History and Key Developments
Sir Charles Dunstone and David Ross founded TalkTalk Telecom Group PLC in 2003. For 7 years TalkTalk was part of Carphone Warehouse (CPW) until 2010
when it demerged and became listed on the LSE and a constituent of the FTSE 250 Index.
2002 • TalkTalk’s venture into the fixed line telecoms market began, when Carphone Warehouse acquired Opal Telecom PLC, a fixed line, voice telecommunications
network provider
2006 • TalkTalk’s growing customer base and the relaxation of barriers to entry enabled it to be the pioneers of free broadband. TalkTalk began migrating customers
onto its own network via its own equipment through the exchanges
2007 • TalkTalk bought AOL's UK Broadband business
2010 • Demerged from CPW becoming listed on LSE as a constituent of the FTSE 250 index.
• TalkTalk bought the UK operations of Tiscali S.p.A for £238m and UK Telco Limited for £7m. These 2 acquisitions were both recognized on the Company’s 2010
financial statements
• Started One Company Integration Program to integrated the Tiscali business and deliver efficiencies in operations.
2011 • Launched TalkTalk mobile along with three mobile products.
• Rebranded Opal business as TalkTalk business with the expected benefit of using the recognised name TalkTalk.
• Acquired Opal 2CCH and Southern Communications Limited for total consideration of £4m; and V Network Limited for £1m
• Continued investment in ‘One Company Integration’ program costing £43m.
2012 • Introduced Superfast broadband due to higher demand of customers.
• Launched HomeSafe technology, which protects children from seeing inappropriate content online
• Acquired Executel Limited and GreystoneTelecom Limited
2013 • Became a quad-play service by investing £62m to launch TV service (YouView)
• Launched Making TalkTalk Simpler Program, expecting cost savings of £30m-£50m over 3-5 years
2014 • Added 687,000 customers to YouView TV and succesfully built TV business in only 18 months
• Added 109,000 customers to Mobile base in 2 months, continued progress in Mobile and Fibre
• Acquired the remaining 75% shares of Future Office Communication Ltd costing £3m
2015 • Acquired Blinkbox (UK’s leading provider of multidevice multi platform video) with the purpose of accelerating the development of key features in TV products.
The acquisition cost £6m
• Established as the No.3 pay TV platform in the UK with 1.4m customers
• Acquired Virgin Media’s off-net broadband base for £25m; Tesco’s phone, broadband and homephone base for £18m
• Launched Netflix to customers, resulting in shared revenue with NetflixTalkTalk Income Statement
FY Ended March 31, FY Ended March 31,
2010A 2011A 2012A 2013A 2014A 2015A 2016A 2017P 2018P 2019P 2020P 2021P
Total Revenue 1,686 1,765 1,687 1,670 1,722 1,795 1,835 1,872 1,966 2,025 2,085 2,138
COGS 838 877 803 751 769 815 845 861 899 921 944 962
SG&A 674 660 585 620 762 781 813 805 826 830 834 834
EBITDA 174 228 299 299 191 199 177 206 241 273 308 342
Depreciation 47 60 65 76 77 83 72 83 88 93 99 104
Amortization 111 92 88 78 56 54 59 61 64 67 69 69
Share of joint ventures 0 (1) (1) (4) (7) (8) (8) (8) (8) (8) (8) (8)
EBIT 16 75 145 141 51 54 38 54 80 105 132 161
Interest (Income) / Expense 5 18 18 19 20 22 24 24 28 32 37 41
Provision for Tax 14.0 22.0 (11.0) 22.0 3.0 (40.0) 12.0 7.5 13.1 18.2 23.9 30.0
Diluted Shares Out 952.000 925.000 940.000 931.000 937.000 947.000 958.390 958.390 958.390 958.390 958.390
Net Income 3.00 35.00 138.00 100.00 28.00 72.00 2.00 22.45 39.24 54.65 71.56 90.12
Diluted EPS 0.04 0.15 0.11 0.03 0.08 0.00 0.02 0.04 0.06 0.07 0.09Vodafone Income Statement
FY Ended March 31, FY Ending March 31,
2014A 2015A 2016A 2017P 2018P 2019P 2020P 2021P
Total Revenue 38,346 42,227 40,973 43,249 44,153 45,577 46,944 48,353
COGS 20,382.0 21,317.0 20,937.0 21,624.5 22,076.5 22,788.5 23,472.2 24,176.3
Gross Profit 17,964.0 20,910.0 20,036.0 21,624.5 22,076.5 22,788.5 23,472.2 24,176.3
SG&A 7,278.0 9,201.0 8,680.0 9,082.3 8,941.0 8,887.5 8,802.1 8,703.5
EBITDA 3,647 11,532 10,875 12,542 13,136 13,901 14,670 15,473
Depreciation 4,038.0 5,046.0 5,246.0 5,190 5,078 5,013 4,929 4,835
Amortization 3,522.0 4,519.0 4,252.0 4,325 4,195 4,102 3,990 3,868
EBIT 44,046.0 2,005.0 1,375.0 3,027.4 3,863.4 4,785.6 5,750.7 6,769.4
Interest (Income) / Expense 1,897.0 1,576.0 1,287.0 1,014 1,036 963 1,048 1,118
Provision for Tax (16,582.0) (4,765.0) 3,369.0 503.4 706.9 955.7 1,175.7 1,412.8
Diluted Shares Out 26,682 26,629 26,602 26,602 26,602 26,602 26,602 26,602
IFRS Net Income 59,420 5,917 (3,818) 1,510 2,121 2,867 3,527 4,239
IFRS Diluted EPS 2.23 0.22 (0.14) 0.06 0.08 0.11 0.13 0.16THANK YOU
You can also read