DNA Plc Stronger, bolder and more straightforward - DNA Investor presentation May 2018 - DNA Oyj

Page created by Earl Oliver
 
CONTINUE READING
DNA Plc Stronger, bolder and more straightforward - DNA Investor presentation May 2018 - DNA Oyj
DNA Plc
Stronger, bolder and more straightforward
DNA Investor presentation
May 2018

                                            1
DNA Plc Stronger, bolder and more straightforward - DNA Investor presentation May 2018 - DNA Oyj
Forward looking statement
                This presentation contains, or may be deemed to contain, statements that are not
                historical facts but forward-looking statements. Such forward-looking statements are
                based on the current plans, estimates and expectations of DNA’s management based on
                information available to it on the date of this presentation. By their nature, forward-looking
                statements involve risks and uncertainties, because they relate to events and depend on
                circumstances that may or may not occur in the future. Future results of DNA may vary
                from the results expressed in, or implied by, the forward-looking statements, possibly to a
                material degree. DNA undertakes no obligation to update this presentation after the date
                hereof.

Investor presentation - May 2018                                                                                 2
DNA Plc Stronger, bolder and more straightforward - DNA Investor presentation May 2018 - DNA Oyj
DNA in brief & Finnish telecom market

 Business review
             Highlights of the first quarter of 2018
             Key operational KPIs and development of
              subscription base
             DNA’s strategic targets and market outlook
              for 2018

 Financial review
             Key figures’ development
             Financial targets and dividend policy

 Appendices

Investor presentation - May 2018                           3
DNA Plc Stronger, bolder and more straightforward - DNA Investor presentation May 2018 - DNA Oyj
DNA in brief

Investor presentation - May 2018
                                                  4
DNA Plc Stronger, bolder and more straightforward - DNA Investor presentation May 2018 - DNA Oyj
DNA is one of the leading Finnish telecommunications groups

       Cost-efficiency              Over 3.9 million                     TV
       Streamlined                  Mobile communications and fixed      Finland’s largest cable operator and the
       Agile                        network customer subscriptions       leading pay TV provider

       Innovative

                                     EUR 886 million                      EUR 124 million
     OUR VALUES                      Net sales in 2017                    Operating result in 2017

     FAST
     DNA's customers receive quick
                                     1,601                                64 DNA stores
     and helpful service                                                  Finland’s most extensive retailer of
                                     At the end of 2017, there were       mobile phones, other mobile devices and
     STRAIGHTFORWARD                 1,601 employees working with DNA     mobile subscriptions
     DNA’s approach is clear and
     responsible
                                     Customer                             Strong employee satisfaction
     BOLD                                                                 The personnel's satisfaction with DNA
     We are direct, open-minded      is in the center of DNA’s strategy
                                                                          as an employer is at a record-breaking
     and ready for change                                                 high level

Investor presentation - May 2018                                                                                     5
DNA Plc Stronger, bolder and more straightforward - DNA Investor presentation May 2018 - DNA Oyj
DNA’s had an excellent first year as a listed company

                                                                               Ownership structure
                    Trading in the DNA share began on the Nasdaq Helsinki
                     Stock Exchange on November 2016
                                                                                                 4.0%
                    DNA has today in total more than 13,600 shareholders                            3.5%
                    Market cap is EUR ~2.6 billion (15 May 2018)

                  Largest shareholders, 11 May 2018             % of shares          27.7%
                  Finda Telecoms Oy                                 28.3

                  PHP Holding Oy                                    25.8

                  Ilmarinen Mutual Pension Insurance Co.            3.3                                64.8%
                  Lohjan Puhelin Oy                                 1.7

                  Elo Pension Company                               1.4                                     11 May 2018

                  The State Pension Fund                            0.9
                                                                              Households
                  Mandatum Life Insurance Co                        0.9
                                                                              Financial and insurance institutions
                  Viria Oyj                                         0.8
                                                                              Other Finnish institutions
                                                                              Nominee registered and non-Finnish holders

Investor presentation - May 2018                                                                                           6
DNA Plc Stronger, bolder and more straightforward - DNA Investor presentation May 2018 - DNA Oyj
Long-standing growth in net sales with highly successful track
                 record in acquisition’s integration
                 – both B2C and B2B with a challenger mindset
                                                                                                                                                                     B2B
                 DNA’s net sales have increased steadily                                                                                                             26%
                                                                                                                                                     886
                                                                                                                                            859
                                                                                                                        832       829
                                                                                                 769           765                                                               B2C
                                                                                       728
                                                                              691                                                                                                74%
   EUR million

                                                        647         652

                                              539

                                    397
                   351    371

                   2004   2005     2006      2007       2008       2009       2010     2011      2012      2013        2014       2015      2016     2017

       2001                    2003             2007              2010            2011             2013               2014            2015             2016          2017
   DNA launches           DNA acquires      6 local fixed     DNA acquires    DNA acquires     DNA acquires       DNA acquires       All DNA       DNA becomes     DNA’s net
      mobile               Telia Mobile   line operators        Welho, the        Forte         PlusTV, the      TDC’s Finnish      business          a listed     sales and
     services                Finland      merged to DNA       leading cable    Netservices    leading pay-TV      operations &     operations        company       operating
                                                               company in                        operator        Finnish Shared   under a single                  result reach
                                                                 Finland                                          Networks Ltd        brand                      record levels
                                                                                                                   is founded

Investor presentation - May 2018                                                                                                                                                       7
DNA Plc Stronger, bolder and more straightforward - DNA Investor presentation May 2018 - DNA Oyj
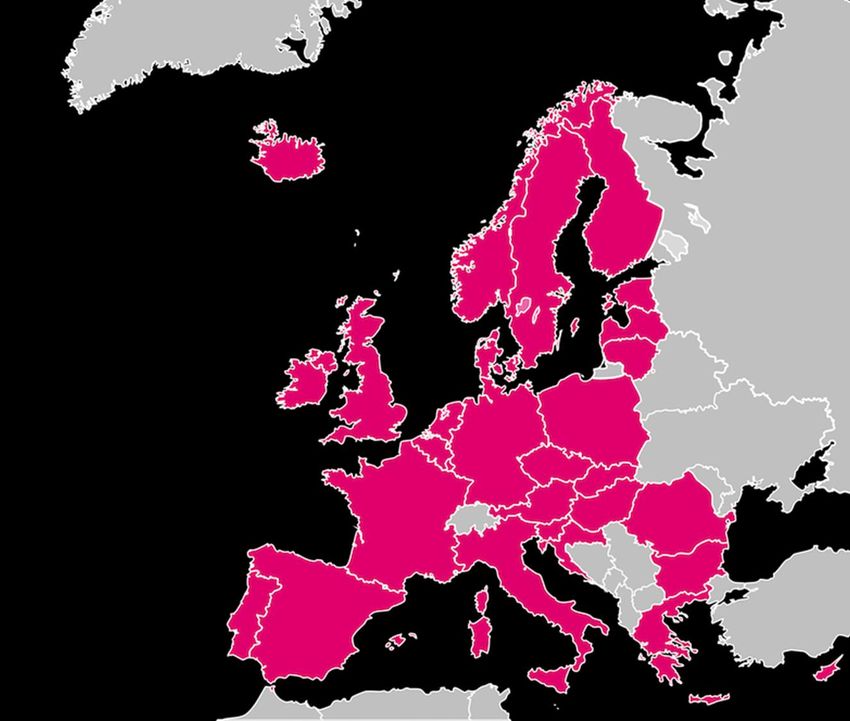
Strong development in DNA’s business
                                                                                 2013                 2017

  Growth in market                 Mobile communications market share            24 %                 28 %
      shares                          Fixed broadband market share               21 %                 27 %

                                                  Net sales                 EUR 765 million    EUR 886 million
   Financial growth
                                             Comparable EBITDA                  25.5 %              30.7 %

                                     Mobile commmunications subs.             2.45 million      2.81 million
       Strong
                                            4G coverage in Finland               42 %               < 99 %
  operational KPI’s
                                        Revenue per user (ARPU)                 18.2 €              18.4 €

         Business                                                                                 Finland

        acquisitions
                                     2010              2011          2012               2013   2014

Investor presentation - May 2018
DNA Plc Stronger, bolder and more straightforward - DNA Investor presentation May 2018 - DNA Oyj
Telecommunications market in transition

  The exponential growth of mobile data has been an          Trend 1
                                                             The demand for faster and better-quality connections is
  important industry trend in recent years.
                                                             growing at an increasing pace – mobile broadband traffic
  The emerging Industrial internet applications will         volumes are fuelled by the growing number of smart phones
                                                             and other smart devices.
  further expand the volume of data traffic, providing new
  kinds of growth opportunities.
                                                             Trend 2
                                                             Customers lead increasingly digital lives and want a
                                                             seamless experience regardless of the service channel

                                                             Trend 3
                                                             The strong growth of the variety of services and smart
                                                             devices continues – the best global services will gain a
                                                             stronger foothold

                                                             Trend 4
                                                             Mobile working, digitisation and the Internet of Things
                                                             will make business more flexible and productive

Investor presentation - May 2018                                                                                         9
DNA Plc Stronger, bolder and more straightforward - DNA Investor presentation May 2018 - DNA Oyj
Finnish telecom market development
       – High potential to upsell highest speed connections
            Telecom market growing, mobile +7% y-on-y                                                                    HFC technologies winning share                                                                                                                                     Demand for faster fixed
                                                                                                                                from legacy xDSL                                                                                                                                             broadband increasing

 4000                                                                                           Y-on-Y            1800
                                                                                                                                                                                                                                                                                                                                                                                                            Less than
               3,650                                                                                                                                                                                                                                    Other                                                                                                                                               2 Mb/s
                                3,493
                                                 3,444                              3,482                         1600
 3500                                                             3,425                                                                                                                                                                                                                                                                                                                                     2 -9 Mb/s
                                                                                                  +6%
                                                                                                                  1400                                                                                                                                  xDSL
 3000                                                                                             -13%
                                                                                                                                                                                                                                                        -12% YoY
                                                                                                  +2%             1200                                                                                                                                                                                                                                                                                      10 -29
 2500                                                                                                                                                                                                                                                                                                                                                                                                       Mb/s
                                                                                                                  1000
                                                                                                  -4%
 2000                                                                                                                                                                                                                                                   FttH
                                                                                                                   800

 1500                                                                                                                                                                                                                                                                                                                                                                                                       30 -99
                                                                                                                   600
                                                                                                                                                                                                                                                        Cable &                                                                                                                                             Mb/s
                                                                                                                                                                                                                                                        Ethernet
 1000
                                                                                                                   400                                                                                                                                                                                                                                                                                      100 Mb/s
                                                                                                  +7%                                                                                                                                                   +10% YoY
                                                                                                                                                                                                                                                                                                                                                                                                            or more
   500
                                                                                                                   200                                                                                                                                                                                                                                                                                      +14% YoY

      0                                                                                                              0

                                                                                                                           30.6.2012

                                                                                                                                                    30.6.2013

                                                                                                                                                                             30.6.2014

                                                                                                                                                                                                      30.6.2015

                                                                                                                                                                                                                               30.6.2016

                                                                                                                                                                                                                                                                   30.6.2012

                                                                                                                                                                                                                                                                                            30.6.2013

                                                                                                                                                                                                                                                                                                                     30.6.2014

                                                                                                                                                                                                                                                                                                                                              30.6.2015

                                                                                                                                                                                                                                                                                                                                                                       30.6.2016

                                                                                                                                                                                                                                                                                                                                                                                                30.6.2017
                                                                                                                                       31.12.2012

                                                                                                                                                                31.12.2013

                                                                                                                                                                                         31.12.2014

                                                                                                                                                                                                                  31.12.2015

                                                                                                                                                                                                                                           31.12.2016

                                                                                                                                                                                                                                                                               31.12.2012

                                                                                                                                                                                                                                                                                                        31.12.2013

                                                                                                                                                                                                                                                                                                                                 31.12.2014

                                                                                                                                                                                                                                                                                                                                                          31.12.2015

                                                                                                                                                                                                                                                                                                                                                                                   31.12.2016
                2012             2013             2014             2015              2016
          Wholesale revenue of fixed network                         Wholesale revenue of mobile network
          Television and radio operations                            Retail revenue of fixed network
          Retail revenue of mobile network

 Source: Ficora
 FttH: Fiber to the home (optical fiber technology)
 HFC: Hybrid fixed-coaxial network (Cable network based on optical fiber)
 xDSL: Includes technological solutions ADSL and VDSL (offers digital information transfer through copper wire)

Investor presentation - May 2018                                                                                                                                                                                                                                                                                                                                                                                        10
Strong foothold in the growth markets
                         – DNA’s market shares increased in mobile communications and fixed broadband in 2016

                               Mobile communications (voice and broadband)                Cable TV and IPTV
    Growth markets

                                                                                                   11%
                                                                   27%   DNA                                         DNA
                                                34%                                                            35%
                                                                         Elisa                                       Elisa
                                                                         TeliaSonera         27%                     TeliaSonera
                                                                         Others                                      Others
                                                             38%                                     27%

                                                  Fixed voice                              Fixed broadband
   Established markets

                                                      19%     14%                                  11%
                                                                         DNA                               27%       DNA
                                                                         Elisa                                       Elisa
                                                                                             27%
                                                21%                      TeliaSonera                                 TeliaSonera
                                                                   46%   Finnet, others                              Finnet, others
                                                                                                         35%

Source: Finnish Communications Regulatory Authority, FiCom

 Investor presentation - May 2018                                                                                                  11
DNA’s strategy summary
      − The cornerstone of DNA’s strategy is customer satisfaction

                                   1                                  2     Seamless, multi-channel        3                               4
Main assumptions                                                                                               The best ecosystems and
                                       Growing demand for faster,           customer experience and                                               B2B: Mobile work,
behind our strategy                                                                                             end-customer solutions
                                          good quality mobile                  personal customer                                                digitalization, IoT, and
                                                                                                                 globally, gets stronger
                                        connections accelerates            relationship - digitalization                                       centralized ICT sourcing
                                                                                                                        foothold
                                                                          and physical channels unites

Our vision and                     THE MOST SATISFIED CUSTOMERS
                                   We want to make our customers’ lives more inspiring, productive and entertaining. We provide connections, services and
mission
                                   devices – in a clear, easy and cost-effective manner.

Aspired                            Customer experience – especially in essential interaction with DNA
differentiation                    Attitude – Service minded attitude according to our values

Our values                         Fast – Straightforward – Bold

                                   1.    The most satisfied consumer and corporate customers
Our strategic                      2.    Industry-leading financial development
goals                              3.    Faster than average market growth
                                   4.    Becoming one of the most desired employers in Finland

Investor presentation - May 2018                                                                                                                                   12
DNA’s footprint in society

Public | DNA Today
We make sustainable business
                                   DNA’s corporate responsibility strategy emphasises DNA’s responsibility towards the customer,
     Responsibility                especially in customer service and sales. In 2016, over 900 DNA employees participated in
      towards the                  corporate responsibility training, and 700 more in 2017. In the trainings, the most important topic
       customer                    has been how DNA gains reputation as a responsible company, and how each employee can
                                   contribute to this.

                                   DNA aims to be one of the most desired employers in Finland. In 2018, in the Great Place to
                                   Work® research, DNA was awarded as the second best workplace in Finland in the category of
   Record high job
                                   large organisations. In addition, DNA was the first publicly listed company – and the first large
    satisfaction
                                   company in Finland – to be recognised as a Family Friendly Workplace by the Family Federation
                                   of Finland.

                                   DNA has signed up to Society’s Commitment to Sustainable Development with a commitment to
                                   reduce the company’s climate impact. DNA’s emissions from the radio network in proportion to
  Reducing climate
                                   annual data transfer volumes have decreased by almost 90% in comparison to 2014. DNA uses
      impact
                                   renewable energy, which has decreased the company’s indirect greenhouse gas emissions by
                                   approximately 50% from 2014.

Investor presentation - May 2018                                                                                                         14
Business Review

Investor presentation - May 2018   Investor presentation - May 2018   15
Telecommunications market in transition

       For 2018, as required by the IFRS standards, the graphs and tables contain figures reported according to the IFRS 15 and IFRS 9 standards adopted on 1 January 2018 and, as required
       by IFRS 15, figures adjusted are disclosed as if they were prepared under 2017 revenue guidance. The comparative analysis in the presentation is disclosed as if the figures were
       prepared under 2017 revenue guidance.

                  Net sales increased 4.2% and was EUR 222.3 million (213.4)
                  Mobile device sales was particularly strong and were up 14.0% from the reference period
                   Service revenue* grew, and the growth came mainly from the improvement in the mobile subscription base and increased
                    share of 4G subscriptions

                 Good development of service revenue improved profitability, EBITDA share of net sales was 32.5%
                       EBITDA increased 9.6% and was EUR 72.3 million (65.9).
                       The positive development was driven by growth in service revenue and improved operational efficiency
                       The operating result increased 23.3% and was EUR 35.6 million (28.9), percentage of net sales was 16.0% (13.5%).

                  Strong momentum of operational KPI’s
                       Revenue per user for mobile communications (ARPU) increased and amounted to EUR 19.0 (EUR 17.8)
                      The subscription turnover rate (CHURN) decreased from the comparison period and was 18.9% (21.0%),
                        however, it increased slightly from the end of 2017 (Q4/2017: 18.1%)
                       Mobile subscription base grew 2.9% from the reference period and was 2,811,000 (2,732,000) subscriptions
                       Subscription base for fixed network services (fixed broadband, cable tv and fixed voice) increased +18,000
                        and totalled 1,138,000 subscriptions

* Service revenue = net sales – (devices sales and interconnection charges)

 Investor presentation - May 2018                                                                                                                                                             16
Q1/2018 – DNA’s year 2018 off to a strong start
Growth of mobile service revenue (+10.4%) and strong mobile device sales
                                                                                                                     EBITDA1 margin improved from the reference period and was +32.5%
(+14.0%) boosted the first quarters’ net sales
EUR million                                                                    y-on-y 4.2% in Q1/2018               EUR million                                                                          y-on-y +9.6% in Q1/2018

                                                                                                                                          71                                                                73                            72    71
                                                                                                                                                                          66              68                               66
                      222           225                        219            219           235        222 222            59                              58
       210                                         213                                                                                                                                                      33.2%                     32.5%
                                                                                                                                           32.0%                           30.9%             30.8%
                                                                                                                           27.9%                                                                                             28.0%             31.8%
                                                                                                                                                              25.5%

          Q2/2016      Q3/2016       Q4/2016        Q1/2017     Q2/2017        Q3/2017      Q4/2017     Q1/2018
                                                                                                                          Q2/2016         Q3/2016         Q4/2016         Q1/2017         Q2/2017           Q3/2017        Q4/2017        Q1/2018
                                                                                                                                     Comparable EBITDA as a % of Revenue                     Comparable EBITDA ¹ (IFRS 15)
              Net sales                   Net sales (IFRS 15)
                                                                                                                                     Comparable EBITDA ¹

As typical for the beginning of the year, operative capex2 remained low,
                                                                                                                     Operating free cash flow3 was positively impacted by low investments
also slightly lower year-on-year
EUR million                                                                        y-on-y -5.4% in Q1/2018          EUR million                                                                                                      56   55
                                                                                            67                                                                          49                             48
                                                                                                                                          41                                            43
                                                                                                                                                                         23.0%                                                   25.4%
                                   52                                                                                                                                                   19.7%          22.0%
                                                                                                                          25              18.3%
                                                                                             28.7%                                                                                                                                        24.8%
                                                                                                                          11.8%
     34                             23.1%
                    30
      16.1%                                                    24             24                                                                          5                                                            -0.7%
                     13.7%                         17                                                   16   15
                                                                11.1%          11.2%                                                                       2.4%
                                                    7.9%                                              7.1%   7.0%                                                                                                     -2

     Q2/2016        Q3/2016        Q4/2016         Q1/2017     Q2/2017        Q3/2017       Q4/2017     Q1/2018          Q2/2016         Q3/2016        Q4/2016        Q1/2017         Q2/2017        Q3/2017         Q4/2017        Q1/2018
               Operative Capex as a % of Revenue              Operative Capex ² (IFRS 15)                                            Operating FCF as a % of Revenue                  Operating Free Cash Flow ³ (IFRS 15)

               Operative Capex ²                                                                                                     Operating Free Cash Flow ³
                                                                                                                    Notes
                                                                                                                    1) EBITDA excluding items affecting comparability
                                                                                                                    2) Operative capex excluding spectrum license payments
                                                                                                                    3) Operating free cash flow defined as comparable EBITDA minus operative capex
Investor presentation - May 2018                                                                                                                                                                                                               17
Both mobile communications network as well as fixed network
      subscription bases grew
Mobile communication network subscription volumes up
                                                                                   Our customers kept moving away from using fixed-voice subscriptions
by 79,000 from the reference period
‘000 subscriptions                                         +2.9%                   ‘000 subscriptions
                                                                                                                                     -17.7%
      2 668        2 731           2 742   2 732   2 754   2 790   2 811   2 811           71           68        65    62     59      57     53     51

    Q2/2016 Q3/2016 Q4/2016 Q1/2017 Q2/2017 Q3/2017 Q4/2017 Q1/2018                    Q2/2016 Q3/2016 Q4/2016 Q1/2017 Q2/2017 Q3/2017 Q4/2017 Q1/2018

       Mobile subscriptions                                                               Fixed voice subscriptions

Our fixed network broadband subscription base increased
                                                                                   Cable TV subscriptions increased by 6,000
by 23,000 subscriptions
‘000 subscriptions                                         +5.2%                   ‘000 subscriptions                                +1.0%

        437          438            440    444     449      454    458      467           608           609       608   614    617    619     619    620

    Q2/2016 Q3/2016 Q4/2016 Q1/2017 Q2/2017 Q3/2017 Q4/2017 Q1/2018                    Q2/2016 Q3/2016 Q4/2016 Q1/2017 Q2/2017 Q3/2017 Q4/2017 Q1/2018

       Fixed broadband subscriptions                                                     Cable TV subscriptions

Investor presentation - May 2018                                                                                                                           18
Subscriptions in DNA’s mobile network increased by 79,000 from
      comparison year
Our mobile subscription base grew 2.9% year-on-year                                                       Key highlights in January-March 2018
 000s
                                                                                                             Mobile communication subscription volumes were up
        36           63              11         -10           22             36        21          0
                                                                                                              79,000 year-on-year
                                                                            +2.9%

     2 668         2 731           2 742       2 732        2 754           2 790     2 811      2 811               - 13,000 prepaid mobile subscriptions
       401           430            404         399           380            392       392        386
                                                                                                                     + 92,000 postpaid mobile subscriptions
      2 267         2 301          2 338       2 333         2 374          2 398     2 418      2 425
                                                                                                                 or
    Q2/2016       Q3/2016      Q4/2016       Q1/2017       Q2/2017         Q3/2017   Q4/2017    Q1/2018
      Mobile Prepaid Subscriptions         Mobile Postpaid Subscriptions             Net adds
                                                                                                                     +8,000 new Consumer Business customer
                                                                                                                      subscriptions
Net growth in Corporate segment’s subscription base                                                                  + 71,000 new Corporate Business customer
 000s
                                                                                                                      subscriptions

     2 668         2 731           2 742       2 732        2 754           2 790     2 811      2 811

       456           467            480         492           526            548       559        563      Mobile subscriptions remained steady compared
                                                                                                            to the Q4 2017
      2 212         2 263          2 262       2 240         2 228          2 242     2 252      2 248            - 4,000 consumer customer subscriptions
                                                                                                                  + 4,000 corporate customer subscriptions
    Q2/2016       Q3/2016      Q4/2016       Q1/2017       Q2/2017         Q3/2017   Q4/2017    Q1/2018
        Corporate Mobile Subscriptions        Consumer Mobile Subscriptions

Investor presentation - May 2018                                                                                                                                  19
Steady growth of mobile broadband and smartphone penetration
 Mobile broadband and smartphone penetration                                                                                                            Key highlights in January-March 2018

                                                        95%              95%             95%              95%              96%
                                       92%
                       88%                                                                                                                                       Smartphone penetration continued to
      80%                                                                                                                                                         increase and was 74%
                                                                                                                 73%              74%
                                                               69%              70%             72%
             63%
                              66%             68%                                                                                                                  Practically all phones sold in the market
                                                                                                                                                                    were smart phones and mostly 4G models

                                                                                                                                                                 Mobile broadband penetration level was 96%

     Q2/2016 Q3/2016 Q4/2016 Q1/2017 Q2/2017 Q3/2017 Q4/2017 Q1/2018

           Mobile broadband penetration¹                               Smartphone penetration²
Notes
1) Share of mobile postpaid and mobile data subscriptions with data services of the total mobile subscription base, excluding M2M (machine to machine), Service operator, Prepaid and Luuri subscriptions.

    The calculation method of mobile broadband penetration changed and one subscription type added in Q2/2017
2) iOS (iPhone)-, Bada-, MeeGo-, Android-, Blackberry-, Symbian 3^- and Windows phones of the total phone base

Investor presentation - May 2018                                                                                                                                                                                20
90% of all mobile data usage was transferred in 4G network
Mobile data traffic (GB, ‘000)                                                           Key highlights January-March 2018
                                                            +41.8%

                                                                               166 764      Mobile data traffic has almost tripled during the past
                                            117 602                                          three years

                                                                                            DNA’s 4G mobile data traffic grew more than
                                                                                             52% from the reference period
     Q2/2016 Q3/2016 Q4/2016 Q1/2017 Q2/2017 Q3/2017 Q4/2017 Q1/2018
                                                                                            DNA’s total data traffic volume in the mobile
Mobile data traffic (GB, ‘000)                                                               communications network grew by 42%, also data
                                                                                             volume per subscription continued to grow
                                                                               529 441
                                                                                            DNA had the highest average downlink speed in
                                                                     344 602                 12 of the 15 cities examined in a survey published
                                                         194 853
                                                                                             by Omnitele in January 2018
                                               103 992
                     34 575        56 577
     19 135

      2011            2012         2013         2014      2015        2016      2017

Investor presentation - May 2018                                                                                                                      21
Steady growth of 4G subscriptions drives increase in revenue per
      user (ARPU) for mobile communications
Mobile postpaid ARPU increased 6,7% year-on-year                                            Key highlights in January-March 2018
EUR

                 17.7                      17.8     18.5     18.5     19.0     19.0 18.9             Demand of 4G subscriptions continues to grow steadily.
    16.8                       17.5
                                                                                                      Customers are prepared to pay more for faster data
                                                                                                      connections
                                                                                                               6.7% increase in ARPU from the reference period
                                                                                                               4G subscription base 55.9%1
    Q2/2016 Q3/2016 Q4/2016 Q1/2017 Q2/2017 Q3/2017 Q4/2017 Q1/2018                                            4G subscription base has increased
                                                                                                                7.8 %-points year-on-year
Mobile communication CHURN (postpaid) was lower than in the
reference period, but slightly higher than at the end of 2017                                                   (Q1/2017: 48.1%)1
%
                                            21.0%                                              In January-March 2018, tight competitive environment
                                                              19.1%              18.9%
                  17.8%            17.8%
                                                     15.4%
                                                                       18.1%                    impacted DNA’s CHURN
    15.0%
                                                                                                               CHURN was 18.9% (Q1/2017: 21.0%)
                                                                                                               From the end of 2017 CHURN increased,
                                                                                                                Q4/2017: 18.1%
    Q2/2016 Q3/2016 Q4/2016 Q1/2017 Q2/2017 Q3/2017 Q4/2017 Q1/2018
                                                                                           Notes
                                                                                           1) Share of mobile postpaid handset subscriptions in Consumer business

                                                                                              ARPU = Average revenue per user
                                                                                              CHURN = Subscription turnover rate
Investor presentation - May 2018                                                                                                                                    22
Stable growth in fixed broadband and cable-TV subscription base
Fixed broadband subscriptions                                                                                   Key highlights in January-March 2018
 000s
                                                                                                                   Ongoing stable growth of consumer fixed broadband
                                                  444          449          454          458         467
      437            438            440
                     38              37            36           36           36           36          36            subscriptions, with net +23,000 subscriptions added
        38

                                                                                                                       Large consumer customer base provides an opportunity
        399          401            403           407           413          418          423         431               to upsell additional DNA services
                                                                                                                   Fixed-network broadband customers are anticipated to continue
                                                                                                                    to switch to housing association broadband subscriptions and
    Q2/2016        Q3/2016      Q4/2016         Q1/2017       Q2/2017      Q3/2017      Q4/2017     Q1/2018         faster speeds
         Corporate Subscriptions           Consumer Subscriptions

Steady increase in cable TV subscriptions                                                                       Key highlights in January-March 2018
 000s
     608            609            608           614          617          619          619         620
                                                                                                                   Stable cable-TV subscription base, with net +6,000
                                                                                                                    subscriptions added

                          272             303           300          283          278         273
                                                                                                                   The use of streaming and on-demand video services continued
             250                                                                                          266
                                                                                                                    to grow, while traditional TV viewing minutes decreased slightly
                                                                                                                   DNA TV subscriptions decreased year-on-year due to
                                                                                                                    a reduction in terrestrial TV coverage
    Q2/2016        Q3/2016         Q4/2016      Q1/2017       Q2/2017      Q3/2017      Q4/2017     Q1/2018

          Cable TV           DNA TV

Investor presentation - May 2018                                                                                                                                                  23
We continue to strengthen the foundation for
  our competitiveness
                       4G, Fibre-Optic and
                                                            Modern IT systems and      Speed and
Team of top experts   cable networks as well
                                                                  analytics         cost-effectiveness
                       as service platforms

                                        Investor presentation - May 2018                                 24
We are on track to achieve our strategic objectives
            The most satisfied                       DNA is a great place
                consumer and                         to work
          corporate customers                        - DNA aims to be one of the
              - To have the most loyal               most desired employers in
                            customers                Finland

               Industry-leading                      Faster than average
         financial development                       market growth
         - Our aim is to develop better              - We aim to have stronger net
         than the competitors in terms               sales development than the
            of operating free cash flow              competition

                                     Investor presentation - May 2018                25
Market outlook for 2018
The Finnish economy                                       Use of mobile devices
has returned to growth                                     that have a constant
                           Mobile data use will                                       The SMS and voice
and we expect market                                     network connection and
                           continue to grow as                                       revenue in the mobile
  for mobile network                                    IP-based communication
                         users increase their use                                       communication
  services to grow in                                     solutions is increasing
                          of digital services and                                    network is forecasted
 2018. Competition is                                      strongly among both
                           OTT video services.                                      to decrease somewhat.
  expected to remain                                       business and private
        intense.                                                  users.

   In the consumer                                            The demand for         Growing use of cloud
                             The market for
 market, demand for                                          Industrial Internet      and entertainment
                             fixed-network
    broadband and                                              solutions, and       services increases the
                            voice services is
entertainment services                                         subsequently         demand for high-speed
                          expected to continue
     in particular is                                     for M2M subscriptions     and high-performance
                               to decline.
expected to increase.                                      is expected to grow.           networks.

                                                 Investor presentation - May 2018                            26
Financial review

Investor presentation - May 2018   27
Positive development in all financial KPI’s
                                                                                               Q1/2018
EUR, m illions                                                           Q1/2018*                                       Q1/2017              Change %      1-12/2017
                                                                                               adjusted
Net sales                                                                   222,3                  222,3                  213,4                  4,2 %       886,1

EBITDA                                                                       70,7                   72,3                   65,9                  9,6 %       271,8

Comparable EBITDA                                                            70,7                   72,3                   65,9                  9,6 %       271,8

    % of Net Sales                                                         31,8%                  32,5%                  30,9%                              30,7%

Comparable Operating Result                                                  35,2                   35,6                   28,9                 23,3 %       126,6

    % of Net Sales                                                         15,8%                  16,0%                  13,5%                              14,3%

Net Result                                                                   24,4                   24,7                   21,2                 16,6 %       93,1

    % of Net Sales                                                         11,0%                  11,1%                   9,9%                              10,5%

Operative Capex                                                              15,5                   15,9                   16,8                  -5,4%       132,9

    % of Net Sales                                                          7,0%                   7,1%                   7,9%                              15,0%
                       1
Operating FCF                                                                55,2                   56,4                   49,2                 14,7%        138,9

Net Debt                                                                    304,0                  304,0                  314,3                              304,3

Net Debt / EBITDA                                                            1,08                   1,05                   1,19                              1,12

Notes
1) Operating free cash flow defined as comparable EBITDA minus operative capex.

Figures adjusted are disclosed as if they were prepared under 2017 revenue guidance, excluding the impact of IFRS 15 standard adopted on 1 January 2018.

                           *Including IFRS 15                                                         Investor presentation - May 2018                                 28
Record-high Mobile service revenue
   Net sales for the quarter were supported by strong growth in mobile
                                                                                                 Key highlights in January-March 2018
   equipment sales and mobile services
                                                                                                  Mobile service revenue was on a record-high level and
     EUR million                                                                    1Q/2018        grew 10.4% from the reference period
                                                                                  Y-o-Y growth
                                                    235                                                   Average revenue per user (ARPU) grew
                                   219    219        7        222       222         4,2 %
                     213
                                    7      7                        7         7                            6.7% and was EUR 19.0
                       7
    Fixed voice                                      67
                                                               63       62                        Mobile equipment sales were on a good level and
    Fixed non-                     70      67
    voice
                  69                                                                               increased by 14.0%
                                                     13
    Mobile                                                     13       13          -6,5 %
    interconnecti 12
    on & inbound
                                   13      13
                                                     38        28       28          -7,4 %
                                                                                                  Revenue from fixed voice continued to decline as expected
    roaming                        26      25
                  25                                                                4,4 %
    Mobile
                                                                                    14,0 %
                                                                                                  Mobile interconnection & inbound roaming was at
    equipment
                                                                                    10,4 %         the same level as in the reference period
    Mobile
    service          100           104    107       109       111       112
                                                                                                  In 2017, comparison of fixed non-voice revenue was
                                                                                                   negatively impacted by a decline in the coverage of pay TV
                                                                                                   in terrestrial network during the second quarter
                   Q1/2017    Q2/2017    Q3/2017   Q4/2017   Q1/2018 Q1/2018*

                        *Including IFRS 15

Investor presentation - May 2018                                                                                                                                29
Profitability was boosted by increased service revenue and
   improved operational efficiency
     Consumer business in Q1/2018                                                                     Corporate business in Q1/2018
     Net sales EUR 165.4 million (+4.3%)                                                              Net sales EUR 56.9 million (+3.7%)

     + Net sales were driven by the growth in service revenue and                                     + Net sales were driven by the growth in service revenue
       good mobile device sales                                                                       + Corporate customers’ mobile ARPU remained steady and
     + Revenue per user                (ARPU)1   increased +8.4% and was EUR 20.5                       was EUR 13.7

     EBITDA EUR 55.2 million (+8.8%)                                                                  EBITDA EUR 17.1 million (+12.2%)

     + The increase was fuelled by the positive development of service                                + Increase in service revenue and improved operational efficiency
       revenue and improved operational efficiency                                                    + Growth in the customer base

   Net sales, EUR million                                                                           Comparable EBITDA, EUR million
    EUR million                                   Change in 2017                     Y-o-Y Growth   EUR million                        Change in 2017             Y-o-Y Growth
                                859      886
                   829                                                                                                          272
                                                      3,2 %                                                              247                10.0%
                                228      227                                                                      227
                   233                                -0,1 %                                                                    72
                                                                                                                         72                -0.2%
                                                                                                                  73
                                                      4,3 %
                                                                                                                                            14.2%
   Corporate                    631      659                                                          Corporate                 200                                      9,6 %
                   596                                     213        222       222       4,2 %                          175                       66   72       71
                                                                                                                  154
                                                               55      57        57                                                                15   17       17      12,2 %
                                                                                          3,7 %
   Consumer                                                                                           Consumer                                          55
                                                           159         165       165                                                               51            53      8,8 %
                                                                                          4,3 %

                  2015         2016      2017            1Q/2017 1Q/2018 1Q/2018*                                 2015   2016   2017          1Q/2017 1Q/2018 1Q/2018*

  Notes
  1) ARPU = Average revenue per user                            *Including IFRS 15
Investor presentation - May 2018                                                                                                                                                  30
Operative CAPEX decreased slightly year-on-year
 Typical for the first quarter, our operative capex1 remained low                             Key highlights in January-March 2018
 EUR million

                                                                                                    Operative capital expenditure decreased 5.4% from
                                                                                                     the reference period and was EUR 15.9 million (16.8),
                 148
                                                                                                     or 7.1% of net sales (7.9%).
                                  137                133                                               operative Capex in 2018 is expected to remain
                                                                                                        at a similar level than in 2017

               17.9%                                                                           Key investments in the first quarter of 2018
                                 15.9%
                                                   15.0%
                                                                                                    Major individual items included in capital expenditure
                                                                                                     in the review period are 4G network capacity
                                                              7.9%         7.1%      7.0%            expansion,
                                                                                                     fibre optics networks and transmission systems
                                                               17           16           15

                                                                                                    Payment for 700 MHz spectrum were EUR 4.4 million
               2015              2016               2017     1Q/2017     1Q/2018   1Q/2018*

                         Operative Capex as a % of Revenue             Operative Capex

Notes
1) Operative capex excluding spectrum license payments       *Including IFRS 15

Investor presentation - May 2018                                                                                                                              31
Operating free cash flow at a good level
Cash flow summary                                                                      Key highlights in January-March 2018

EUR million                               2015    2016    2017    1-3/2018 1-3/2018*

                                                                                        Operating free cash flow at a good level
Comparable EBITDA                          227     247     272       72       71

Operative Capex                           (148)   (137)   (133)     (16)      (15)             + High EBITDA
Operating FCF                              79      110     139       56       55               + Low operative capex
  Margin %                                9.5%    12.8%   15.7%    25.4 %   24.8 %

  Cash Conversion %                       34.7%   44.6%   51.1%    78.0 %   78.1 %      Free cash flow to equity was negative
Interest paid, net                         (8)     (9)     (9)      (15)      (15)
                                                                                               - Higher paid interest due to release of new
Income taxes, paid                          2      (5)     (26)      2         2
                                                                                                 bond and partial repurchase of existing notes
Adjusted Change in NWC                     38      (1)     19       (47)      (46)
                                                                                               - Growth in working capital due to decrease in
Change in Provisions                       (9)     (2)     (5)       (0)      (0)
                                                                                                 trade payables  high investment period in Q4
FCFE                                       101     93      119       (4)      (4)

  Margin %                                12.2%   10.8%   13.4%    (1.6%)   (1.6%)

                     *Including IFRS 15

                                                            Investor presentation - May 2018                                                     32
Low cost capital structure
 Weighted average cost of debt has decreased: 1.48% in Q1/18 (Q4/2017: 2.33%)                                        Debt maturity schedule, EUR million

                                                                            Nom inal     Book Value                          EUR 150 million fully undrawn RCF providing additional liquidity and
                                                      Maturity                                        Cost of Debt
                                                                          Am ount € MM     € MM                                                       financial flexibility
Unsecured € Bond 1.375% Coupon                        Mar-2025                250           241          1.43%
                                                                                                                                                                                                    250
Unsecured € Bond 2.875% Coupon                        Mar-2021                 60            60          2.93%

Unsecured € Bond 2.625% Coupon                        Nov-2018                 40            40          2.73%

Bank Loans and Commercial Paper                                               125           125          0.49%
                                                                                                                                                                                                    250
                                                                                                                        75
Total                                                                         475           466          1.48%                                            60
                                                                                                                        40          24
Cash & Cash Equivalents                                                                     -162                                                         60
                                                                                                                        35          24
Net Debt                                                                                    304                        2018        2019      2020       2021       2022      2023       2024        2025
                                                                                                                                                    Bank Loans    Bonds
Net Debt/EBITDA1                                                                            1.1x

In March 2018, DNA got a long-term credit rating

  Assigned Rating                            BBB (S&P)

  Outlook                                    Stable
Notes
1) Defined as net debt divided by comparable EBITDA, rolling 12 months.

Investor presentation - May 2018                                                                                                                                                                      33
Financial objectives and dividend policy 1
 Financial
 guidance2 for                        DNA's net sales and comparable operating result in 2018 are expected to remain at the same level as in 2017.
 2018                                  The Group's financial position and liquidity are expected to remain at a healthy level
 unchanged

 Mid-term                             Net sales growth – faster than average market growth
 financial                            EBITDA margin of at least 32%
 targets
                                      Operative capital expenditure3 less than 15% of sales

 Leverage                             Net debt/EBITDA less than 2.0x
 policy                                         − Can be temporarily exceeded in case of potential attractive bolt-on in-market M&A opportunities

 Dividend                             Target dividend payout of 70%-90% of free cash flow to equity
 policy and                           DNA distributed dividend of EUR 0.46 /share and a capital payment of EUR 0.17 /share, in total EUR 0.63 /share.
 distributable                         Also, an extra capital payment of EUR 0.47 /share was paid.
 funds in 2018                        Total payout EUR 145 million, EUR 1.10 /share, 7.0% payout ratio (as of 31 Dec 2017)
Notes
1) DNA's mid-term financial objectives do not incorporate the impact from the adoption of IFRS 15 on 1 January 2018 and IFRS 16 on 1 January 2019.

   DNA continues to evaluate the impact of the adoption of these standards and will update its objectives as needed.
2) DNA's guidance for 2018 is disclosed as it was prepared under 2017 revenue guidance and does not currently incorporate the potential impact from the adoption of IFRS 15 as of 1 January 2018.
3) Operative capex excluding spectrum license payments

Investor presentation - May 2018                                                                                                                                                                    34
Thank you!
                                          More information:
                                   DNA’s Investor Relations
                                            Marja Mäkinen
                                        +358 44 044 1262,
                                    marja.makinen@dna.fi

Investor presentation - May 2018                        35
Appendices
                 Operational and financial KPI’s
                 EU roaming
                 Subscription prices
                 Introduction for Consumer business
                 Introduction for Corporate business
                 Corporate responsibility and sustainability
                 IR contact information

Investor presentation - May 2018                                36
KPI Overview
 Mobile KPIs                                                                                           Fixed KPIs

                                       2015     2016    2017         1Q/2017    1Q/2018     1Q/2018*                                          2015   2016   2017   1Q/2017   1Q/2018   1Q/2018*

Mobile Revenue (€ MM)                   499      539     586            138          152      154      Fixed Revenue (€ MM)                   330    320    300      76        70         69

        Service                         343      375     420            100          111      112          Non-Voice Revenues                 294    288    273      69        63         62

        Equipment Sales                 92       111     114            25           28       28           Voice Revenues                     36     32     28        7         7         7

        Interconnection & Inbound
                                        64       53       52            12           13       13       Fixed Broadband Subscriptions (000s)   436    440    458      444       467        467
        Roaming
                                                                                                           Consumer                           394    403    423      407       431        431
Mobile Subscriptions (000s)1           2 621    2 742   2 811          2 732        2 811    2 811
                                                                                                           Corporate                          42     37     36       36        36         36
        Postpaid                       2 199    2 338   2 418          2 333        2 425    2 425
        Prepaid                         422      404     392            399          386      386      Fixed Voice Subscriptions (000s)       78     65     53       62        51         51

        Consumer                       2 183    2 262   2 252          2 240        2 248    2 248         Consumer                           37     30     25       28        24         24

                                                                                                           Corporate                          41     35     29       33        26         26
        Corporate                       438      480     559            492          563      563

                                                                                                       Cable-TV Subscriptions (000s)          606    608    619      614       620        620
ARPU, Mobile Handset Subscriptions (€/month)2
        Postpaid                       17.0     17.1     18.4          17.8         19.0      18.9
        Prepaid                         4.1      3.8     3.8            3.6          3.8      3.8
        Consumer (postpaid)            17.7     18.0     19.6          18.9         20.5      20.4

        Corporate (postpaid)           14.6     13.9     13.8          13.8         13.7      13.7

Annualised Mobile Handset Subscriptions Churn (%)
        Postpaid                       16.0%    16.1%   18.3 %        21.0%         18.9%    18.9%
Notes
1) Excludes M2M subscriptions
2) Includes interconnection revenues                           *Including IFRS 15

Investor presentation - May 2018                                                                                                                                                     37
EU roaming as of 15 June 2017

                   90% price cut for data (until 14 June: EUR 62.0 /Gt, as of 15 June; EUR 4.6 /Gt (0 vat))
                   No price increases in domestic prices for existing customers
                   Receiving calls will be completely free
                   We have EU roaming products with fast 4G data and a sizeable EU data package
                    of 10GB/month. Within the package, no extra charges are applied for EU data transfer.

                       Service                                                                        According the fare use policy*

                       Outgoing calls                                                                 Domestic price, no additional fee

                       Sending text & multimedia
                                                                                                      Domestic price, no additional fee
                       messages

                       Data transfer                                                                  EU base fare 5.706 €/Gt
Notes
* Fare use policy; The new EU pricing scheme is valid within fair usage limits and for periodic roaming.
EU-roaming is considered periodic as long as domestic usage surpasses EU-roaming usage.
Subscription specific fair usage limits are introduced for EU-roaming data.

 Investor presentation - May 2018                                                                                                         38
Examples of DNA subscription charges

                                                                                                          DNA Rajaton – Unlimited use, unlimited calls, text and multimedia messages,
DNA Super 4G Rajaton
                                                                                                          and data transfer.
Monthly fee                                             EUR 49,90/month
Data transfer speed                                     300 Mbit/s                                        DNA Rajaton
EU-data package                                         15 Gt/month in EU /ETA area                       Monthly fee                                                EUR 24.90/month
Domestic calls                                          unlimited                                         Data transfer speed                                        1 Mbit/s
Domestic text & multimedia messages                     unlimited                                         EU-data package                                            10 Gt/month in EU /ETA area
DNA Nopea 4G –subscriptions – Unlimited 100 Mbit/s 4G-internet at home and 10 Gt/month EU data package.   Domestic & in EU /ETA area calls                           unlimited
Unlimited / package or / per usages calls and text messages.
                                                                                                          DNA Paketti
DNA Nopea 4G Rajaton                                                                                      Monthly fee                                                EUR 17.90/month
Monthly fee                                             EUR 34,90/month                                   Data transfer speed                                        1 Mbit/s
Data transfer speed                                     100 Mbit/s                                        EU-data package                                            5 Gt/month in EU /ETA area
EU-data package                                         10 Gt/month in EU /ETA area                       Domestic & in EU /ETA area calls                           200 minutes and 200 pcs
Domestic calls                                          unlimited
Domestic text & multimedia messages                     unlimited                                         DNA Jämpti
DNA Nopea 4G Paketti                                                                                      Monthly fee                                                 EUR 12.90/month
Monthly fee                                             EUR 28,90 /month                                  Data transfer speed                                         1 Mbit/s
Data transfer speed                                     100 Mbit/s                                        EU-data package                                             4 Gt/month in EU /ETA area
EU-data package                                         10 Gt/month in EU /ETA area                       Domestic calls                                              200 minutes ans 200 pcs
Domestic calls                                          200 min                                           Domestic & in EU /ETA area calls                            EUR 0.07 / min
Domestic text messages                                  200 pcs                                           Domestic & in EU /ETA area text & multimedia messages       EUR 0.07 / pc
Calls and text messages exceeding the package:          EUR 0.09 /min or pc
DNA Nopea 4G Jämpti                                                                                       DNA Puhe
Monthly fee                                             EUR 26,90/month                                   Monthly fee                                                 EUR 4.90/month
Data transfer speed                                     100 Mbit/s                                        Data transfer speed                                         -
EU-data package                                         10 Gt/monh in EU /ETA area                        EU-data package                                             -
Domestic & in EU /ETA area calls                        EUR 0.07 / min                                    Domestic & in EU /ETA area calls                            EUR 0.07 / min
Domestic & in EU /ETA area text & multimedia messages   EUR 0.07 / pc                                     Domestic & in EU /ETA area text & multimedia messages       EUR 0.07 / pc

   Investor presentation - May 2018                                                                                                                                                       39
Consumer business (74.3% of net sales in 2017)

      DNA provides its consumer customers with diverse services for
      communication and entertainment: smart phones, tablets and            STRENGHTS
      accessories; voice services in mobile and fixed networks; broadband
      services in mobile and fixed networks; and diverse entertainment         Strong retail and online store sales
      services in cable, terrestrial and broadband networks.
                                                                               We aim to provide straightforward, high-quality
                                                                                service in every channel, every time
                                                                               Clear and competitive product-service
                                                                                combinations for customers
                          Smart phones and subscriptions

                                                                            GROWTH DRIVERS
              Broadband subscriptions (mobile and fixed)
                                                                               TV and entertainment business
                                                                               Mobile data market
                            Modern entertainment services                            The increased adoption of smart phones,
                                                                                      tablets and other smart devices as well as
                                                                                      the wider availability of 4G speeds
                                                                                      significantly boosted data transfer volumes

Investor presentation - May 2018                                                                                                    40
DNA’s consumer business in brief
                                   We improve the quality of our customer service and the efficiency of our operations systematically,
         Customer satisfaction
                                   introduce easy-to-use services needed by customers. Our customer service metrics have shown
              is the key           positive development in 2017 and DNA Store received record-high scores in NPS.

                                   Our extensive and fast 4G network make us well-equipped to provide our customers with
                 Mobile
                                   increasingly faster, high-quality connections. In Consumer Business, the ARPU increased in 2017
              communications       as customers switched from 3G subscriptions to faster 4G subscriptions.

                Entertainment      We want it to be easy for everyone to find the entertainment content they want, regardless of the
                                   technology or devices. Putting our cable, terrestrial and broadband customers together, we have
                  Business         over million television service customers.

                                   Households are increasingly using both fixed-network and mobile broadband. The steady growth of
             Fixed broadband       DNA’s fixed-network broadband subscription base continued by 18,000 in 2017.

                                   Increasingly networked lifestyles, new TV and home entertainment services and growth of mobile
                Growth drivers     data volumes are trends boosting operators’ business.

                                   Net sales of our Consumer Business increased by 4.3% in 2017, amounting to EUR 659 million.
           Net sales increased     Net sales were driven by the growth in service revenue and good mobile device sales.

Investor presentation - May 2018
Corporate business (25.7% of net sales in 2017)
                                                                                                  STRENGTHS
        DNA provides easily deployable and high-quality mobile and fixed network communications      Extensive own fibre, backbone and
        and network services for companies and communities.                                           distribution networks
                                                                                                     Extensive mobile network, largely with
                                                                                                      IPv6 protocol
                        Mobile Network and Communications
                                     Services                                                        Strong regional presence strategic
                                                                                                      priority

                                   Enterprise Network Services                                       Excellent price-quality ratio and
                                                                                                      customer-oriented product development

                                   Enterprise Network Security

                                                                                                  GROWTH DRIVERS
                                   Enterprise Network Solution
                                                                                                     The digitalisation of businesses and
                                                                                                      increasing use of cloud services require fast
                                    IoT – Smart Connectivity                                          and high-quality network services
                                                                                                     The Industrial Internet and IoT require more
                                                                                                      intelligent controlling and new technologies

Investor presentation - May 2018
DNA’s Corporate Business in brief

         Customer satisfaction     Strong partner for companies, public corporations and integrators. Good services and expert
              is the key           customer service.

                                   High-quality networks are playing increasingly important role in the ecosystem of machines,
          Comprehensive, fast
                                   information and people as the volume of data traffic is increasing. The network must be reliable and
          and reliable network     suited to the company’s needs.

           Customer numbers        Business in the segment developed well in 2017: there was strong interest in corporate network
             are increasing        solutions and the corporate mobile subscription base grew by 79,000 subscriptions, or 16%.

          Pioneer in new ways      Digitalisation is speeding up change in the working culture. We are creating new ways of working
               of working          with the help of innovative tools, fast connections and reliable network services.

                                   85% NB-IoT (Narrow Band Internet of Things) coverage in Finland. In 2017, DNA’s M2M
             Industrial Internet   subscription base grew some 15%.

           Net sales remained      Net sales remained at a similar level year-on-year, amounting to EUR 227 million. Operating result
                 steady            increased by 13.7% and came to EUR 19 million.

Investor presentation - May 2018
Significant new agreements and extensions to existing contracts
      with enterprises and the public sector
                                                                   Large listed Finnish industrial                    Finnish University and
                         City of Vantaa
                                                                             corporation                             Research Network Funet

               A three-year extension agreement on                A three-year agreement on the delivery of        CSC – IT Center for Science and
                the delivery of an even larger set of               WAN network in Finland, mobile call centre        DNA Plc have agreed on the delivery
                telecommunications services                         and over 1,000 mobile subscriptions               of fibre optic connections for the
                                                                                                                      Finnish University and Research
               The solution includes all connections of           The total value of the agreement is over          Network Funet
                the city, the LANs and WLANs of offices,            EUR 2 million
                firewall services and the Internet                                                                   With the agreement, the number of
                connections, online authorisation                                                                     fibre optic connections provided by
                solutions and optionally a cyber security                                                             DNA for the nationwide Funet data
                service                                                                                               communications network increases
                                                                                                                      significantly. Furthermore, the Funet
               Contract period initially three years, after                                                          network will be expanded across
                which continues until further notice                                                                  Finland with several new connections
                                                                                                                      provided by DNA
               The total value for the first three years is
                over EUR 8 million

Investor presentation - May 2018                                                                                                                              44
Additional information on corporate
                responsibility and sustainability
                        DNA’s corporate responsibility reporting is
                         conducted in accordance with the Global
                         Reporting Initiative (GRI) framework and published
                         annually with the Annual Report
                        DNA’s Corporate Responsibility Reports are
                         available on our investor website:
                         https://corporate.dna.fi/reporting
                        DNA’s Corporate Responsibility Report has been
                         assured by an independent external party
                        DNA also reports to the CDP survey in terms of
                         climate performance

Investor presentation - May 2018                                              45
DNA Investor Relations
                          Timo Karppinen                                      Next event:
                          CFO
                                                                               Half year 2018 result on 19 July 2018
                          timo.Karppinen@dna.fi
                          +358 44 044 5007

                          Marja Mäkinen
                          Head of IR
                          marja.makinen@dna.fi
                          +358 44 044 1262

                          Meeting requests:
                          Kirsi Kurki
                          Assistant
                          kirsi.kurki@dna.fi
                          +358 44 044 2696

   Follow us on:
           www.dna.fi/investors                   www.facebook.com/dna.fi

           www.twitter.com/DNA_fi                 www.instagram.com/dna_fi/

           www.linkedin.com/company/dna-ltd/

Investor presentation - May 2018                                                                                 46
You can also read