Iron Mountain: We Protect What You Value Most - Investor Presentation Q1 2020
←
→
Page content transcription
If your browser does not render page correctly, please read the page content below

Iron Mountain:
We Protect What You Value Most
Investor Presentation
Q1 2020
Safe Harbor Language and Reconciliation of                                                                                                                                                                      2

Non-GAAP Measures
Forward Looking Statements

Safe Harbor Statement Under the Private Securities Litigation Reform Act of 1995: This release contains certain forward-looking statements within the meaning of the Private Securities Litigation Reform Act of
1995 and other securities laws and is subject to the safe-harbor created by such Act. Forward-looking statements include, but are not, limited to, our financial performance outlook and statements concerning
our operations, economic performance, financial condition, goals, beliefs, future growth strategies, investment objectives, plans and current expectations, such as 2020 guidance, expected benefits, costs and
actions related to Project Summit, and statements about our investments, dividend policy, leverage, and other goals. These forward-looking statements are subject to various known and unknown risks,
uncertainties and other factors. When we use words such as "believes," "expects," "anticipates," "estimates" or similar expressions, we are making forward-looking statements. Although we believe that our
forward-looking statements are based on reasonable assumptions, our expected results may not be achieved, and actual results may differ materially from our expectations. In addition, important factors that
could cause actual results to differ from expectations include, among others: (i) our ability to remain qualified for taxation as a real estate investment trust for U.S. federal income tax purposes; (ii) the adoption
of alternative technologies and shifts by our customers to storage of data through non-paper based technologies; (iii) changes in customer preferences and demand for our storage and information
management services; (iv) the cost and our ability to comply with laws, regulations and customer demands relating to data security and privacy issues, as well as fire and safety standards; (v) our ability or
inability to execute our strategic growth plan, expand internationally, complete acquisitions on satisfactory terms, and to integrate acquired companies efficiently; (vi) changes in the amount of our growth and
recurring capital expenditures and our ability to raise capital and invest according to plan; (vii) the impact of litigation or disputes that may arise in connection with incidents in which we fail to protect our
customers' information or our internal records or IT systems and the impact of such incidents on our reputation and ability to compete;(viii) our ability to execute on Project Summit and the potential impacts of
Project Summit on our ability to retain and recruit employees and execute on our strategy (ix) changes in the price for our storage and information management services relative to the cost of providing such
storage and information management services; (x) changes in the political and economic environments in the countries in which our international subsidiaries operate and changes in the global political
climate; (xi) the impact of executing on our growth strategy through joint ventures; (xii) our ability to comply with our existing debt obligations and restrictions in our debt instruments or to obtain additional
financing to meet our working capital needs; (xiii) the impact of service interruptions or equipment damage and the cost of power on our data center operations; (xiv) changes in the cost of our debt; (xv) the
impact of alternative, more attractive investments on dividends; (xvi) the cost or potential liabilities associated with real estate necessary for our business; (xvii) the performance of business partners upon
whom we depend for technical assistance or management expertise; (xviii) other trends in competitive or economic conditions affecting our financial condition or results of operations not presently
contemplated; and (xix) other risks described more fully in our filings with the Securities and Exchange Commission, including under the caption “Risk Factors” in our periodic reports or incorporated therein.
You should not rely upon forward-looking statements except as statements of our present intentions and of our present expectations, which may or may not occur. Except as required by law, we undertake no
obligation to release publicly the result of any revision to these forward looking statements that may be made to reflect events or circumstances after the date hereof or to reflect the occurrence of
unanticipated events.

Reconciliation of Non-GAAP Measures:

Throughout this presentation, Iron Mountain will discuss (1) Adjusted EBITDA, (2) Adjusted Earnings per Share (“Adjusted EPS”), (3) Funds from Operations (“FFO Nareit”), (4) FFO (Normalized) and (5)
Adjusted Funds from Operations (“AFFO”). These measures do not conform to accounting principles generally accepted in the United States (“GAAP”). These non-GAAP measures are supplemental metrics
designed to enhance our disclosure and to provide additional information that we believe to be important for investors to consider in addition to, but not as a substitute for, other measures of financial
performance reported in accordance with GAAP, such as operating income, income (loss) from continuing operations, net income (loss) attributable to Iron Mountain Incorporated or cash flows from operating
activities from continuing operations (as determined in accordance with GAAP). The reconciliation of these measures to the appropriate GAAP measure, as required by Regulation G under the Securities
Exchange Act of 1934, as amended, and their definitions are included later in this document (see Table of Contents). Iron Mountain does not provide a reconciliation of non-GAAP measures that it discusses
as part of its annual guidance or long term outlook because certain significant information required for such reconciliation is not available without unreasonable efforts or at all, including, most notably, the
impact of exchange rates on Iron Mountain’s transactions, loss or gain related to the disposition property, plant and equipment (including of real estate) and other income or expense. Without this information,
Iron Mountain does not believe that a reconciliation would be meaningful.

Note: Definition of Non-GAAP and other measures and reconciliations of Non-GAAP to GAAP measures can be found in the Supplemental Financial Information
3
Iron Mountain Investor Presentation

1. Overview of the business

2. Project Summit

3. Driving EBITDA growth

4. Prudent capital allocation framework

5. Q4 2019 performance

4

OUR MISSION…

TO BE THE TRUSTED GUARDIANS
OF THE ASSETS MOST IMPORTANT TO OUR CUSTOMERS,
SECURING THEIR PAST, PRESENT AND FUTURE VALUE.
Overview of the
Business
6
Global Leader in Records & Information Management
      Global Presence                                                                          Significant Size & Scale

                                                                                                •   $10B Equity Market Capitalization
                                                                                                •   $18B Total Enterprise Value
                                                                                                •   $4.3B2 of Annualized Revenue

                                                                                                •   298 Owned Facilities, 14 Operating Data Centers
                                                                                                •   RMZ, FTSE NAREIT and S&P 500 Member
              ~700m Cu Ft of Records │ ~1,450 facilities │ ~91M SF

      Mission Critical Storage to Numerous Industries                                          Unmatched Diversity
                                                          Healthcare 16%

                                                                  Federal 2%
                             Other(1)                                                          •    Presence in ~50 countries across 6 continents
                              50%                                     Legal 8%
                                                                                               •    Over 225,000 customers
                                                                      Financial 12%
                                                                                               •    Serving ~95% of Fortune 1,000 companies
                                                                  Insurance 6%
                                                              Life Sciences 3%                 •    Customers from over 50 different industries
                 Business Services 2%
                                               Energy 3%

(1)    No single vertical within "Other" comprises greater than 1% of North America revenue.
(2)    2019 total revenue.
7
Large Global Real Estate Footprint

                                                    Top 5 Owned Markets (000’s of Square Feet) at 12/31/19
                                                               United States                                                           International
                                        Northern New Jersey                                               2,086               Paris                    807
                                        Boston                                                            1,428               Montreal                 552
                                        Chicago                                                           1,282               London                   474
                                        Dallas                                                            1,023               Buenos Aries             470

$2.5B(1) Owned Real                     Los Angeles                                                       1,012               Mexico City              452
       Estate

                     Owned
                      SF
  69%
                      31%
  Leased
   SF(2)

  (1)   Based on U.S. real estate valuation completed by Eastdil and IRM management estimates for rest of world as of 9/30/18
  (2)   55.8% of Facility Lease Expirations are after 2029; weighted average remaining lease obligation 11.0 years as of 12/31/19
8
Large Diversified Business
                                     Business Mix                                                                                      Revenue Mix by Product Line

                                                                                      Revenue: $4.3B(2)
                 Fine Arts        Other(1)                                                                          Service                                 5%
                                                                                                                                                                   4%
                    2%             11%                                                                                                                 2%
                                                                                                                   Revenue
        Data Center
            6%
                                                                                                                  37% of total

                                                                                                                                           17%
 Shredding
    9%                                                                                                                                                                                     47%
                                                                          Records
                                                                         Management
                                                                            61%

  Data                                                                                                                                           10%                                              Storage
Protection
  11%                                                                                                                                                                                             Revenue
                                                                                                                                                            9%
                                                                                                                                                                   6%   2%                       63% of total

                                                                                                                                               Records Management            Data Management
                                                                                                                                               Adjacent Business             Secure Shredding
                                                                                                                                               Data Center                   Digital Solutions

(1)   Other revenues include Information Governance and Digital Solutions, Consulting, Entertainment Services, and other ancillary services.
(2)   2019 revenue.
Note: Numbers may not foot due to rounding.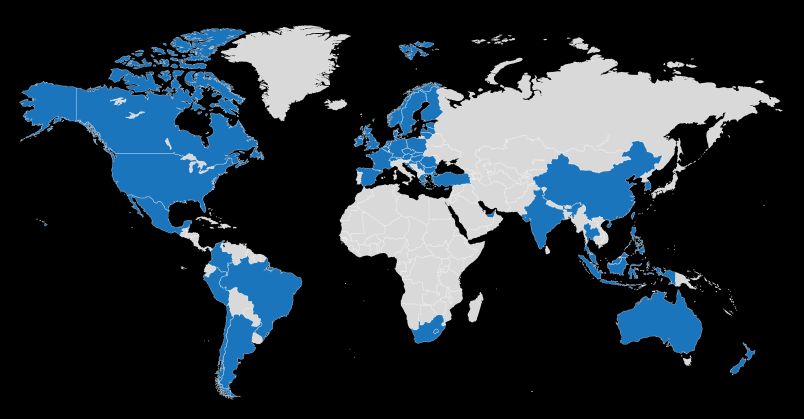
9
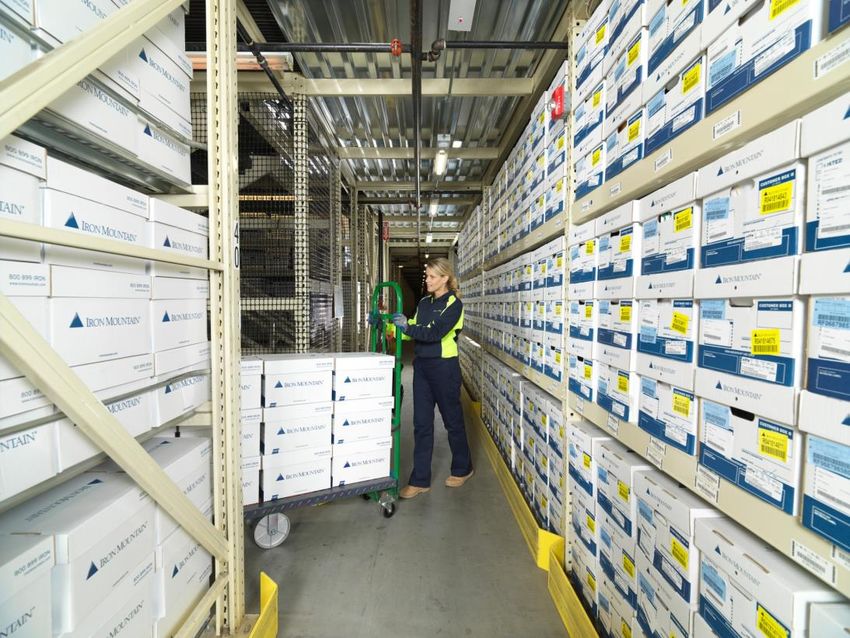
Durable Records Management Business
• ~700 Million Cubic Feet of
hardcopy records archived
• 98 Percent Customer
retention rate
• Steady Organic Revenue
Growth supported by
revenue management
• 50%+ of boxes stay in
facilities for 15 years on
average
10
Business Mix Accelerating Growth
                    Healthy Revenue Growth Trends                                                                                 Robust Margin Expansion
                    Organic Total Revenue Growth Rolling 3-Yr Avg                                                                                        Total Adjusted EBITDA Margins
                                                                            2.4%             2.3%                                                                                    33.7%   33.7%
                                                                                                                                                                             32.3%
                                                           1.7%
                                                                                                                                                            31.0%
                                                                                                                                           30.6%
                                           1.2%                                                                            29.7%
                          0.8%

         0.2%

         2014             2015            2016             2017             2018             2019                          2014             2015             2016            2017    2018    2019

 Strong Execution of Growth Strategy
   •      Iron Mountain has made significant progress in shifting its revenue mix to faster growing businesses, including
          emerging markets, data center, and adjacent business segments
                •     Expanded data center footprint globally via Fortrust, I/O, Credit Suisse, and EvoSwitch acquisitions
                •     Targeting data center business to be 10% of Adjusted EBITDA by the end of 2020
   •      Shift in business mix driving continued improvement in Adjusted EBITDA margins
   •      Investing in new digital solutions and further strengthening customer relationships
Note: 2018 Adjusted EBITDA margins were impacted by adoption of Revenue Recognition standard; normalized for the change, 2018 Total Adjusted EBITDA margin would have been 33.4%,
Project Summit Designed to accelerate execution of strategy and continue growth
12
Project Summit – Key Goals
Simplified Global Streamlined Managerial Enhancing Customer
Structure Structure for the Future Experience
United RIM operations under one leader – Consolidated the number of layers and • Aligning global and regional customer-
Ernie Cloutier reporting levels facing resources across RIM product lines
Consolidated external reporting segments Reduced the number of positions at the VP • Providing customers with a more integrated
to reflect Global RIM as one business unit level and above – ~70% of impacted experience
employees notified
Rebalanced resources to sharpen focus on • Leveraging technology to modernize
higher growth areas • Reducing total managerial & administrative processes for better alignment between
workforce by approximately 700 positions new digital solutions and core business
over the next two years
• Creating a more dynamic agile organization
that is better positioned to make faster
decisions and execute its strategy in key
growth areas
Focusing on highest potential opportunities while creating a more efficient organization that can
embrace and execute change faster to become a stronger customer partner13
Project Summit – Expected Financial Impact
- Annual Adjusted EBITDA benefits of $200M by 2022
- $80M Adjusted EBITDA benefit in 2020
Financial Impact
- $50M annualized benefit
- $30M in-year benefit in 2H 2020
- ~$240M by the end of 2021, inclusive of ~$50M charge incurred
Total Cost to Implement
in Q4 2019
2020 Restructuring Charge - ~$130M, with associated benefit beginning in 2H 2020
Program to drive significant Adjusted EBITDA benefits and enable deleveragingDriving EBITDA Growth
15
Durable Long-Term Business Model

     Deep and long-lasting                       Durable Records Management
   customer relationships with                         business drives
       950 of Fortune 1000                             cash generation

             Drive significant cross-selling synergies across businesses
          Consistently deliver strong organic cash flow; fund future growth

            Continue to support and grow strong customer relationships

   Deliver targeted ~4%+ organic Adjusted EBITDA growth flowing through to AFFO
16
Durable Global Storage Portfolio
Worldwide Volume
700,000
680,000
Cubic Feet
660,000
640,000
620,000
600,000
Q4 2017 Q1 2018 Q2 2018 Q3 2018 Q4 2018 Q1 2019 Q2 2019 Q3 2019 Q4 2019
Records Management Data Protection Adjacent Businesses Consumer and other Businesses
Note: Business acquisitions volume acquired during the quarter included in Total Volume17
Differentiated Data Center Offering Supports Growth
Iron Mountain provides a comprehensive data center solution
to solve our customers’ digital transformation challenges
• Proven track record and existing customer relationships; trusted by the world’s most regulated organizations
• 5 of Top 10 Cloud Providers are Iron Mountain Data Center customers
• Compelling Cross-Sell opportunity – significant number of new enterprise deals generated by RIM sales team
• Unmatched flexibility – ability to provide customers with a range of deployment options from one cabinet to an
entire building
• Easy access to numerous carriers, cloud providers and peering exchanges with migration support and IT
services available
• IRM data centers powered by 100% renewable energy – new Green Power Pass enables us to ‘pass’ carbon credits
to customers
• Reduced customer risk with comprehensive compliance support and highly secure colocation facilities
• Unique underground data centers are ideal for backup and disaster recovery
• Best-in-class uptime performance – six-nine’s
Enterprise retail colocation
Access to 100’s of carriers Hybrid IT and Smart hands
with the ability to serve
and cloud providers data center services services available
hyperscale requirements18
Large Data Center Platform with Growth Potential
Presence in Top Global Markets
Potential Capacity of ~357MW
Chicago
Amsterdam
• 2019 Full Year Revenue of $257M; Adjusted
EBITDA of $122M
Northern Virginia
London • 14 Operating Data Center facilities spanning
the U.S., Europe and Asia
• 1,300+ Data Center Unique Leases
Frankfurt
• 90.0% Capacity Utilization (stabilized)
• WALE of 2.9 years
New Jersey
• 2020 leasing target of 15-20 megawatts;
Phoenix
strong and building pipeline
Boyers and
Other
Denver
Singapore
~120MW of Leasable Capacity
Note: data as of 12/31/19 unless otherwise stated19
Significant Data Center Expansion Opportunity
Leaseable Under Held for Total Potential
Market
MW Construction Development Capacity
Amsterdam 11.8 0.6 21.6 34.0
Boyers and Other 14.2 -- 11.2 25.4
Chicago 0.0 -- 36.0 36.0
Denver 11.3 -- 3.1 14.4
Frankfurt 0.0 9.0 18.0 27.0
London 5.1 -- 28.8 33.9
New Jersey 14.1 1.0 10.5 25.6
Northern Virginia 10.5 4.0 45.5 60.0
Phoenix 50.7 -- 44.0 94.7
Singapore 2.6 -- 3.5 6.1
Total Data Center Portfolio 120.3 14.6 222.2 357.1
Total portfolio capacity including expansion of 357.1 MW
Note: as of 12/31/1920
Continued Expansion in Faster-Growing Markets
39 countries $800m+ Revenue(1) Expanding Margins
ADJUSTED EBITDA MARGIN
36%
30% 31%
29%
26%
64%
21%
Storage Service
2015 2016 2017 2018 2019
Focus on Storage- Margin expansion as
4 regions
attached Services business scales
480 facilities
Customer outsourcing in Executing on value
~30,000 customers early stages creating M&A to strengthen
>15,000 employees market positions
(1) 2019 annual revenue21
Long-Term Margin Drivers Support Growth
Emerging
Markets
• Organic growth provides scale
and efficiency
• Strong market positions support
margin expansion
Emerging Markets
Data Center
• Building development pipeline
• Fastest growth segment with highest margins
Expansion of Records
Continuous Management Margins
Improvement
• Revenue Management
• Continuous Improvement22
Faster-Growing Adjacent Businesses
Fine Art Storage Entertainment Services
• Global leader in fine art storage and logistics; strategic • Trusted by every major music label and movie
network spans North America & Europe studio to protect their most valuable films,
• Unparalleled technical expertise in the handling, recordings and images
installation and storing of art • Industry-leading chain-of custody processes
• Best practices to protect the value and integrity of • On-site full service studio
treasured assetsPrudent Capital Allocation Framework
24
    Capital Allocation Strategy
•    Sustainable dividend growth
      •   Modest dividend growth
      •   Reduce payout ratio as % of AFFO to mid-60% to low-70% range
•    Long-term target leverage ratio of 4.5x – 5.5x
      •   Driven by accelerated Adjusted EBITDA growth and benefits from Project Summit
      •   Reduce leverage gradually over time to enable greater financial flexibility
•    Reinvest in the business through growth CapEx
      •   Continue build-out of Global Data Center platform
      •   Support growth in Global RIM business (faster-growing markets) and Adjacent Businesses
•    Capital recycling and alternative sources of funding
      •   Identify additional opportunities to monetize owned assets across portfolio
      •   Identify sources of third-party capital to fund continued Data Center development
•    Invest in accretive M&A
      •   Target opportunities generating returns well-above the cost of capital
      •   Increase scale in existing markets
      •   Gain access to new, high-growth markets
25
Value Creation Through Capital Recycling
Real Estate capital recycling strategy December 2019 sale – $46 Million
IRM buys and sells with an ROI focus Case study: Sunnyvale, CA
Recycles capital to create long-term value for shareholders Sale of 125k sq ft facility located within Silicon Valley
Liquidity recycled into other real estate and data centers Capitalized on favorable valuation of industrial asset in highly
sought after market
Will relocate inventory to other nearby Iron Mountain facilities
Capital recycling opportunities over 24-36 months
Excess or Better/best use –
inefficient real Sale generates
estate outsized return
Higher-use real estate alternatives
Data center
Building Emerging market
development /
improvements expansion / M&A
expansion26
Balance Sheet Remains Well Positioned
Balance Sheet Highlights as of 12/31/19 Net Lease Adjusted Leverage
5.7x
5.6x
• ~80% Fixed Rate Debt
• 4.8% weighted average interest rate
• 5.8 years weighted average maturity
• No significant maturities until 2023
J.P. Morgan Iron Mountain
REIT Composite
Source: J.P. Morgan REIT Weekly U.S. Real Estate report January 31, 2020 and company reports27 Key Takeaways • Leading global information management brand with a durable, growing business • Project Summit expected to yield significant free cash flow benefits starting in 2020 • Increasing exposure to high-growth markets with powerful secular tailwinds • Committed to growing the dividend while reducing payout ratio over time • Disciplined capital allocation designed to maximize returns
28
    Strong Sustainability Focus
•   Green Power Pass solution in Data Center market to help customers manage their carbon footprint
•   Part of RE100 Initiative – commitment to using renewable energy sources for 100% of our worldwide
    electricity
•   Set aggressive science-based targets for carbon reduction by the end of 2019
•   69% of our global electricity use – including 100% of the electricity used to power our Data Center
    business – was from renewable sources in 2018
•   Awarded the EPA's Green Power Leadership Award in 2017
•   Top 10 buyer of Renewable Energy on the EPA's Green Power Partnership Top Tech and Telecom
    Green Power Users
Q4 2019 Performance
30
Q4 Performance

    Healthy organic Storage rental revenue growth
    •    Total organic Storage rental revenue growth of 2.5%
    •    Total organic Service revenue declined 0.7%, impacted by paper prices (organic Service up 2.9% ex. paper)
    •    Volume continues to be steady, consistent with expectations

Continue to extend reach beyond core Records Management storage offering
•       Global Digital Solutions revenue growth of 10% year over year in 2019
•       Successfully secured one of Iron Mountain’s largest deals leveraging workflow expertise and Digital Solutions
•       Good success in Digital Solutions enabling pull-through of other storage and service opportunities

Data Center momentum continues to build
•       17 megawatts of new and expansion leases executed in 2019
•       New turn-key data center capacity brought on-line in key markets around the world; 90% stabilized utilization
•       Strong and building 2020 leasing pipeline driven by an uptick in larger enterprise and hyperscale activity
31
Q4 2019 Financial Performance
Constant Organic
In millions, except per-share data Q4-19 Q4-18 Y/Y %
Currency Y/Y% Growth(1)
Revenue $1,080 $1,061 1.7% 2.7% 1.3%
Storage $676 $659 2.5% 3.5% 2.5%
Service $404 $403 0.4% 1.5% -0.7%
Gross Profit $620 $611 1.5%
Gross Profit Margin 57.4% 57.5% -10bps
SG&A Expenses $234 $251 -7.0% -6.3%
Income from Continuing Operations $37 $159 -76.6%
Adjusted EBITDA(2) $386 $359 7.5% 8.4%
Adjusted EBITDA Margin(2) 35.8% 33.9% 190 bps
Net Income $37 $159 -76.6%
AFFO(1) $228 $194 17.7%
Dividend/Share $0.62 $0.61 1.2%
Fully Diluted Shares Outstanding 288 287 0.4%
(1) Constant currency excluding impact from business acquisitions and divestitures
(2) Reconciliation for Adjusted EBITDA and AFFO to their respective GAAP measures can be found in the Supplemental Financial Information on Pages 13 and 16, respectively32
2020 Guidance
$ in MM 2020 Guidance(1) Y/Y % Change
Revenue $4,375 - $4,475 3% - 5%
Adjusted EBITDA $1,520 - $1,570 6% - 9%
Adjusted EPS $1.15 - $1.25 13% - 23%
AFFO $930 - $960 9% - 12%
2020 guidance assumes:
• Total organic revenue growth of flat to +2%; organic storage rental revenue growth of 1% - 3%
• Interest expense of $435-$445M and normalized cash taxes of $70-$80M
• Structural tax rate of 18% to 20%
• Full-year weighted average shares outstanding of ~288M
• Real Estate and Non-Real Estate Recurring CapEx and Non-Real Estate Growth Investments of $140-$160M
• Real Estate Growth Investment and Innovation of $150-$175M
• Business acquisitions of ~$150M plus acquisitions of customer relationships and inducements of ~$75M
• Data Center development capex of ~$200M (assumes closing of Frankfurt JV)
• Capital Recycling proceeds of ~$100M
• Project Summit restructuring charges of ~$130M, with Adjusted EBITDA benefit of $80M
(1) Guidance reflects FX rates as of January 3, 2020 and is subject to fluctuation.
Note: Iron Mountain does not provide a reconciliation of non-GAAP measures that it discusses as part of its annual guidance or long term outlook because certain significant information required for such
reconciliation is not available without unreasonable efforts or at all, including, most notably, the impact of exchange rates on Iron Mountain’s transactions, loss or gain related to the disposition of real estate and
other income or expense. Without this information, Iron Mountain does not believe that a reconciliation would be meaningful.Investor.Relations@ironmountain.com
You can also read