SHAKE SHACK Integrated Strategic Marketing Plan - MEGAN, FANG-CHI LIN - megan lin
←
→
Page content transcription
If your browser does not render page correctly, please read the page content below
SHAKE SHACK
Integrated Strategic Marketing Plan

                                      MEGAN, FANG-CHI LIN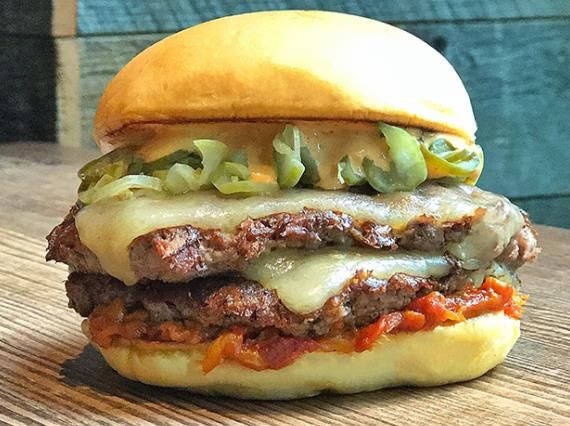
EXECUTIVE SUMMARY
• Shake Shack is a rising burger restaurant brand in a highly-competitive fast-casual
  restaurant market.
• Shake Shack reaches its target market of millennials through high-quality ingredients and
  positioning itself with a fine dining approach.
• Product Recommendations include:
    • Expand breakfast to all domestic stores: Breakfast is currently available at the
      Madison Square Park, JFK, Union Station, Grand Central, Fulton Center, Penn Station,
      LAX and Dubai Airport Shacks.
    • Expanding new stores into Asia (Singapore, Taiwan, HK, Shanghai)
    • Limited-edition City Burgers made by top chefs in each city.
• Worst case: $23m net income in 2018
• Most likely, new products will contribute $7 m net income in 2018
• Best case: Shake Shack will earn 2.2% more than the forecasted figure
  under most likely scenario.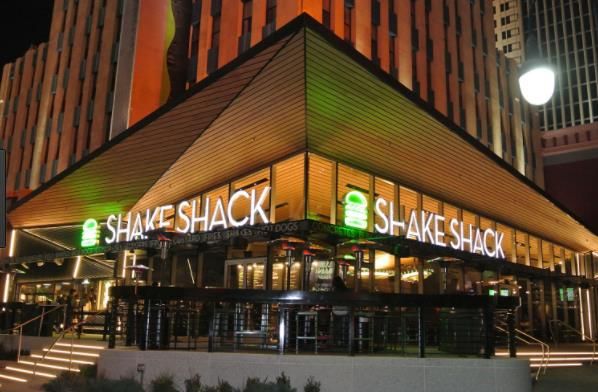
SITUATION
 ANALYSIS
FAST FOOD INDUSTRY
              • The revenue of the fast food industry is expected to grow an annualized 3.2% to $245.4 billion over the five
                years to 2017. Industry revenue is expected to grow at an annualized rate of 1.6% over the five years to 2022
                to $266.2 billion.1

              Technology
              • Mobile apps
              • Online ordering platforms
              • Tabletop tablets
              • Mobile payment services

              Legal/Regulatory issues
              • Restaurant Environment Safety
              • Data Security: Credit card fraud
              • Joint-Employer Status
              • Overtime
              • Patent Abuse
Source: Alvarez, A. (2017) IBISWorld Industry Report 72221a. Fastfood Restaurants in the US. Retrieved June 17,
2017,P.5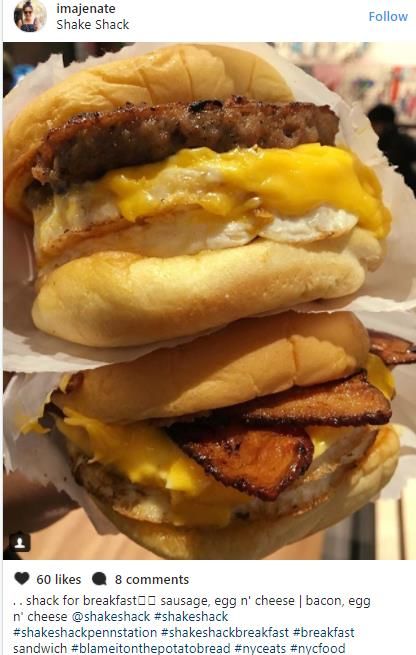
BURGERS HAVE DOMINATED THE INDUSTRY
       • Top 50 fast food chains are dominated by restaurants
         specializing in burgers.17
       • Over the past five years many traditional burger
         chains have struggled with flat or declining sales as
         consumers move away from generic brands towards
         niche or gourmet offerings.18
       • The “better burger ” trend has been the best
         performing part in the segment over the past five
         years.19

Source: Rob Bruner(2016) America SHAKES UP. Retrieved June 17,
2017,P.80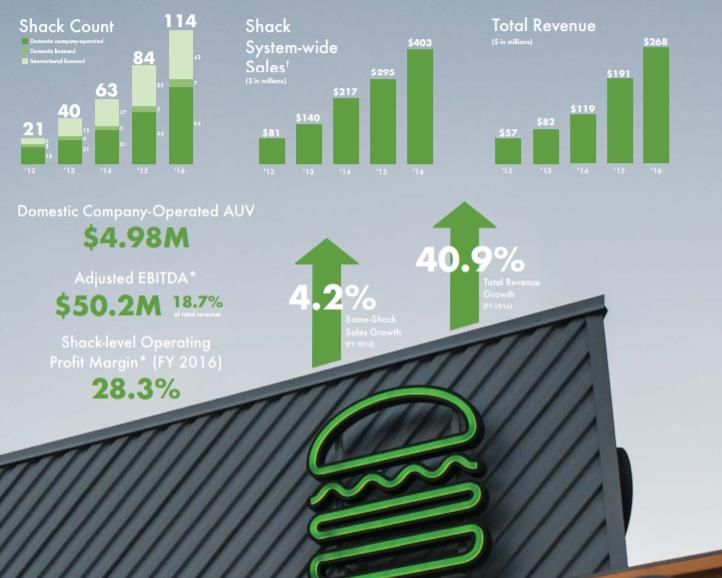
WHAT IS FAST-CASUAL?
           • A fast-casual restaurant is a relatively fresh and rapidly growing concept, positioned somewhere between
             fast food restaurants and casual dining restaurants.
           • They provide counter service and offer more customized, freshly prepared and high-quality food than
             traditional Quick Service Restaurants(QSR), all in an upscaled and inviting ambiance.20
           • Although fast-casual is the smallest portion of the restaurant industry, its growth far outshines the rest of the
             industry. The sales of fast casual industry grew 13.5% in 2014, and revenue grew 10.4% from 2014 to 2015.
             The restaurant industry as a whole, in comparison, grew only 5.3% in 2014 and 5.3% in 2014.21

Source : Fast Casual Industry Analysis 2017 - Cost & Trends. (n.d.). Retrieved June 14, 2017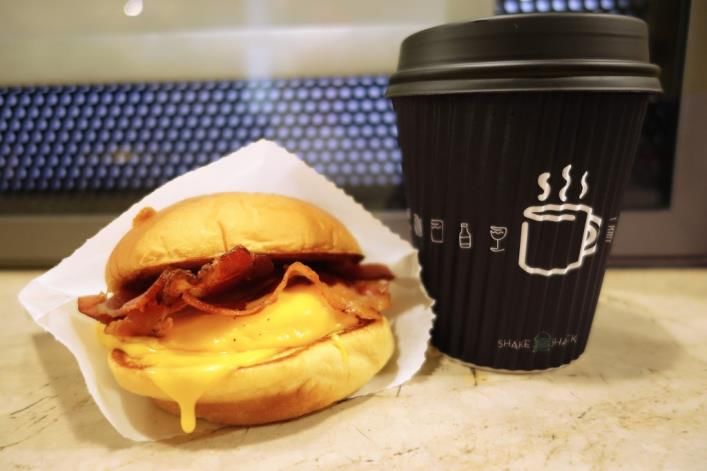
COMPETITION
Major Players       Shake Shack                McDonald’s                       Five guys                 In-N-Out
Description         A fast-casual Burger-      The world's biggest food         The company offers a      A fast food chain
                    focused company. The       operator. The company has        simple menu of            restaurant located
                    company now has about      more than 36,500 restaurants     burgers, fries and        primarily in
                    120 stores in over 10      in about 120 countries. More     hotdogs. Since 1986, it   California. The
                    countries. Most of the     than 80% of the restaurants      has more than 900         company owns
                    stores overseas are        are run by franchisees or        stores in 40 states and   nearly 300 popular
                    franchised.                affiliates.                      Canada.                   burger joints. It has
                                                                                                          no franchise
                                                                                                          operators.
Core competencies   Good quality and made-     Breakfast, burgers, variety of   Burgers and peanut oil    Made-to-order
                    to-order Burgers, Shakes   menu choices and drive-thru      fries.                    burgers and drive-
                    and food for pets.         service.                                                   thru service.

Revenue             $269m27                    $8.1b28                          $832m29                   $809m30

Profit              $12.4m31                   $4b32                            $71.8m34                  N/A

Market Share        N/A                        15.2%33                          N/A                       N/A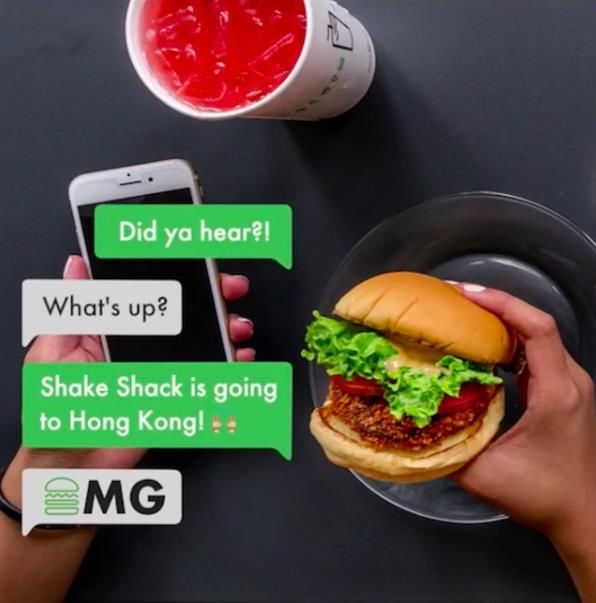
COMPETITION (CONTINUED)
           Shake Shack              McDonald’s              Five Guys                In-N-Out
Strength   Support local            Great breakfast         Nostalgic                Famous in California,
           farmers, great           selection, variety of   atmosphere, free         made-to-order food,
           quality food,            menu options,           peanuts, free add-       young vibe of the
           welcoming and chic       seasonal edition        ons, successful          store, family
           atmosphere, great        menu, open late / 24    franchising history,     business, treats
           social media             hours, high brand       fresh ingredients,       employees well
           interaction, different   awareness, cheap        numerous awards,
           product line(            price                   customization of
           clothes, accessories                             burgers
           etc.)
Weakness   No drive-thru            Poor food quality,      Limited product          No international
           service, higher price    high employee           offering, no             stores, does not
           range, low brand         turnover, unhealthy     advertising, no drive-   franchise, long line,
           awareness, slow          reputation, bad         thru, cooks in           limited menu items.
           expansion                customer service        peanut oil (allergy)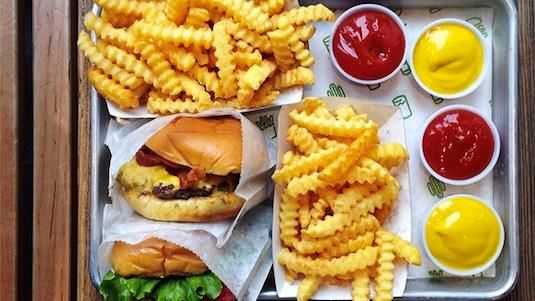
SHAKE SHACK NEEDS TO INCREASE BRAND AWARENESS
                                             Brand awareness

                                                 7
                           Food quality          6             Location
                                                 5
                                                 4
                                                 3
                                                 2
                                                 1
                                                                          Price
                  Store
                  atmosphere

----SHAKE SHACK
----McDonald’s
----Five Guys
----In-N-Out              Cleanness                             Customer experience

                                          Social media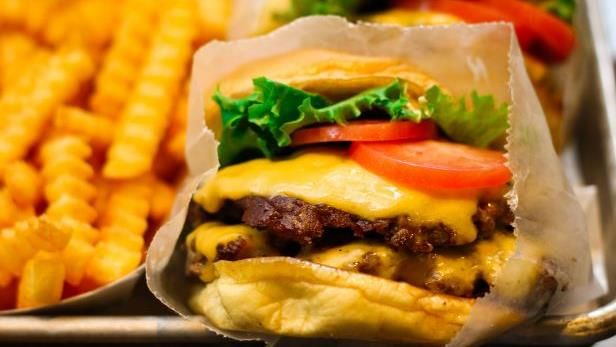
VALUE CHAIN
                                       Shake
     Suppliers                                               Customers
                                       Shack
  • Local food suppliers
                               •   Ingredients prep.         • Primary target
    for meat, potato
                               •   Assembly food               costumers would be
    buns, fresh
                               •   Store event planning        millennials
    vegetables, potato
                               •   Marketing(Social media)   • Secondary costumers
    fries and wine/beer.
                               •   R&D                         would be parents or
  • Food container
                               •   PR                          grand parents with
  • Store furniture
                               •   Customer service            kids

Influencers:
-Food bloggers, Food critics
-Government regulation
MILLENNIALS ARE THE TARGET GROUP
Customers Notes
Millennials: Age 18-35, living in New York, Millennials are more willing to splurge on
California and Texas (Primary target a nice meal even when the money is tight.
market)
Parents or grandparents with kids, living in Parents or grandparents with kids want
New York, California and Texas their kids to eat healthier and are willing
( Secondary target market) to pay a little bit for it.
Teens : Age 13-18, living in New York, Teens tend to care more about cheap food
California and Texas than the quality of food.
Geographical Facts:
• The Southeast(24.9% of industry establishments) has the highest concentration of franchised establishments and a
higher proportion of employment and revenue.49
• California (12.0%), the state with the largest portion of establishments, is also the state with the largest population.50WHAT DO CUSTOMERS WANT?
• Fast ordering capabilities
• Convenient pick-up and
delivery
• Healthful options
• Photogenic food and
storytelling
• Sustainability and
environmentally friendliness
Source : Bacon, C. (n.d.). Fast Casual: The Restaurant Model of the Future? Retrieved June 18, 2017, from
http://trustedinsight.trendsource.com/trusted-insight-trends/fast-casual-the-restaurant-model-of-the-
future/ABOUT SHAKE SHACK
Shake Shack started from a hot dog cart in Madison
Square Park in Manhattan to support the Madison
Square Park Conservancy’s first art installation in
2001. In 2004, Danny Mayer, the CEO of a luxury
restaurant group called Union Square Hospitality
Group (USHG), decided to open a permanent kiosk in
the park. And that’s how Shake Shack was born.60
In 2015, Shake Shack decided to go public. For Shake
Shack, going public is a way to spread the culture they
believe in.61
Shake Shack is famous for its great quality of burgers
and delicious shakes. Shake Shack dedicated
themselves in finding the best local suppliers to create
the ultimate Shake Shack experience for their
customers.
Mission: “We stand for something good”62
To connect with people through their heart as
Source:
well as through their stomachs.63 Shake Shack Announces Fourth Quarter and Fiscal Year Ended 2016 Financial Results. (n.d.). Retrieved June 18, 2017
Stock Quote. (n.d.). Retrieved June 18, 2017 p.2About Shake Shack • Total revenue grew by 40.9% to $268.5 million • System-wide sales grew by 36.4% to $402.8 million • System-wide Shack count increased 35.7% to 114 Shacks • Same-Shack sales grew by 4.2% • Shack-level operating profit, a non-GAAP measure increased 38.6% to $73.3 million, or 28.3% of Shack sales. • Adjusted EBITDA, a non-GAAP measure, increased 35.7% to $50.2 million Shack APP With the launch of Shack App in January 2017, 15+% increase in average check on the App v.s.in-Shack. 2.6% of total domestic sales come from the app( data from March 1, 2017 to April 14, 2017). A total 300,000 downloads as of April 13, 2017.65 Source:2016 Annual Report-Shake Shack[Pdf]. (n.d.).p.10
THE BIGGER WE GET, THE SMALLER WE NEED TO ACT
   Shake Shack’s strategy is focusing on :
                                                  Product
                                                  Burger, Fries, Hot dog, Frozen custards, Chocolate,
  • The “go-slow” approach                        Drinks, Beer and Wine, Clothes, Accessories, Dog
  • Global expansion                              food and Pet accessories
  • Product innovation
                                                  Promotion
                                                  Social Media, Word of mouth, Community events

   Positioning:                                   Place
  Among millennials, age from 18 to 35 , Shake    Over 120 stores in 10 different countries. For
  Shack is the brand of fast-casual restaurants   products such as clothes and accessories, they
  that provides fine-dining quality food and      have an online store as well.
  service with affordable price in a fun and
  comfortable environment because the brand’s
  equity and the reputation of its founder.        Price
                                                   Burger price could range from $5 to $10, while
                                                   other things like fries, hotdogs, and custards could
                                                   range from $3 to $7. Beer and wine could range
                                                   from $5 to $30.66
BALANCE SCORE CARD
MISSION:
To connect with people through their heart as well as through their stomachs
Innovation and Operational
Financial Measures Customer Perspective Perspective
Learning Perspective
-Total revenues - # new customer -Number of new -Right on time
-Same store sales - # cross sales product -Responsiveness
-Net income after taxes - Customer -Return on innovation -Reduction in waste
-Return on equity satisfaction -Employee skills -Process quality
-Return on Investment - Service expectation -Time to market
-Value of cross-sales - % loyalty -Time spent talking to
-Value of customer - Timeliness customers
lifetime - Accuracy
-Value of customer - # yelp reviews
referralsEXPANDED SWOT
SWOT
S    •   Great food quality from local source
                                                    W   •   No drive-through service
     •   Great service and hospitality                  •   Made-to-order food takes longer time
     •   Fun store atmosphere                           •   Higher price points
     •   Active social media presence                   •   Brand awareness lower than traditional QSR
     •   Made-to-order food                             •   Slow expansion
     •   Great company culture: say” YES!”68            •   Limited target audience: mostly Millennials
     •   Different product line ( clothes,
         accessories etc.)

O    • Opportunities in international markets       T   •   More and more “better burger” brands rising
       such as Taiwan, China etc.                       •   Other fast-casual concepts entering market
     • Branded content                                  •   Changing food trends
     • Branded partnerships                             •   Changing customer eating preferences
     • Product sold in organic grocery store like
       Whole Foods
EXPANDED SWOT Maximizing Strengths and Opportunities Minimizing Weaknesses and Threats • Find more franchise partners in Asia, • Create faster ordering logistics (more Australia or other countries cooks, more grills, more fryers) • Domestic Expand: more stores in the U.S. • Introduce new ordering app to shorten • Tap into new marketing platforms like waiting time Virtual Reality and Artificial Intelligence • Create more brand awareness through ads • Expand menu items with high-quality food • Create drive-thru for markets with need • Participate or sponsor in local farmer’s • Create limited edition food with famous market cook to keep customers excited
RECOMMEN-
  DATIONS
SUMMARY OF RECOMMENDATIONS

     Shake Shack Breakfast             Expand new stores in Asia          City Burgers

Serve Breakfast and coffee in all   Open new stores in Taiwan,     Partner with the most popular
Shack stores.                       Singapore, Hong Kong, and      chef in each city to create
                                    Shanghai.                      limited edition city burgers.

Goal/timing:                        Goal/timing:                   Goal/timing:
Launch to all domestic stores by    Open first stores in these     Launch in U.S.A. by end of
Q2 of 2018                          selected cities by 2019        2018
VALUE CHAIN
Shake
Suppliers Customers
Shack
• New local food suppliers • Marketing team needs • Breakfast lovers
for new ingredients to research for both • Star chef fans
needed for breakfast, new products and new • Foodie in Taiwan,
fish burger etc. markets Singapore and Hong
• Star chef provides ideas • Identified which star Kong
for city burgers chef to work with to
• New local food create limited edition
suppliers/ furniture city burgers for
suppliers for new store different location
in other countryRECOMMENDED TARGET MARKET
Breakfast New Stores In Asia City Burgers
Demographics Millennials: Age 18-35, annual Millennials: Age 18-40, annual Millennials: Age 18- 40, annual
household income $60,000 or more household income $25,000 or household income $60,000 or
more more
Primary Geography U.S. Taipei, Singapore, Hong Kong, U.S.
Target and Shanghai
Market
Psychographics people who appreciate great people who like to follow the people who like to travel, and
quality breakfast and think of trend, experience western enjoy different food culture
breakfast as the most important culture, and they don't care
meal of the day about the price as long as it's
trendy on social media
Demographics Parents or Grandparents with kids, Expats and tourists, annual Foodies, annual household
annual household income $60,000 household income $35,000 or income $60,000 or more
or more more
Secondary Geography U.S. Taipei, Singapore, Hong Kong, U.S.
Target and Shanghai
Market Psychographics People who care about what their People who used to live in the people who follow food trends
kids are eating and are willing to U.S. and now has to live abroad and are familiar with culinary
pay more for food that's or tourists who travel to Asia, world, they would travel all the
organic/high quality but still they miss western food and way just to experience the special
attracted to kids knows about Shake Shack edition food at any price2018 OVERALL OBJECTIVES
Numbers are in thousands 2015 %(of Total 2016 %(of Total 2017 Estimated
Revenues- Revenues-2016)
Total Revenue 190,592
2015)
100% 268,475 100% 348,000 2018 Profit Margin 8%
Total Expenses 183,839 96.5% 240,670 89.6% 321,552
Operating Income 6,753 3.5% 27,805 10.4% 26,448
Other Income, net 7 --- 1,065 0.4% 1,392
Interest Expense (332) (0.2%) (374) (0.1%) (348)
Income before income taxes
Income Tax Expense
6,428
3,304
3.4%
1.7%
28,496
6,350
10.6%
2.4%
27,492
8,700
2018 Market Share 8%
Net Income 3,124 1.6% 22,146 8.2% 18,792
Less: Net income attributable to
noncontrolling interests
11,900 6.2% 9,700 3.6% 10,440
Net income (Loss) attributable to
Shake Shack 2018 Revenue Growth 35%
(8,776) (4.6%) 12,446 4.6% 8352
Shake Shack's Revenue Growth from 2016 to 2017 29.6%
Shake Shack's Revenue Growth (forecasted) from 2017 to 2018 35%
Source:Shake Shack Announces Fourth Quarter and Fiscal Year Ended 2016 Financial Results. (n.d.). Retrieved July 28, 2017, from http://investor.shakeshack.com/investors-
overview/news/press-release-details/2017/Shake-Shack-Announces-Fourth-Quarter-and-Fiscal-Year-Ended-2016-Financial-Results/default.aspxSHAKE SHACK BREAKFAST
Product Promotion Place Pricing
Objectives - Launch breakfast product - Create immense buzz - Distributed - Set pricing 10%
line to all domestic stores through social media to all 85 more premium
by Q2 2018 to gain awareness domestic than other fast
- Breakfast items included from 1 month before stores by Q2 foods like
Egg N’ Cheese, Bacon Egg launch. 2018 McDonalds.
N’ Cheese , Sausage Egg - Total IMC budget: $ Each location
N’ Cheese, and Blue 2m would vary with
Bottle Coffee. airport locations
pricier.
Strategies - Has not changed as - Sell the breakfast - Start soft - Set the price at
stated in the Company burger with Blue open trial 1 Egg N’
section of the Situation Bottle coffee for a set week before Cheese:$3.99,
Analysis price of $5 for the official Bacon, Egg N’
first month. launching to Cheese:$4.99 ,
- Partner with popular insure Sausage, Egg N’
coffee brand, Blue smooth Cheese:$4.99
Bottle. launch.EXPAND NEW STORES IN ASIA
Product Promotion Place Pricing
Objectives - Launch all Burger, - Total IMC budget: - Open new stores - Develop pricing
Fries, Hot dog, $3m at Taipei, strategy that
Frozen custards, - Increase brand Singapore, Honk positions brand
Chocolate, Drinks, awareness by Kong and as a premium fast
Beer and Wine, 90% before Shanghai by end casual concept.
Clothes, opening of 2018
Accessories, Dog
food and Pet
accessories by end
of 2018
Strategies - Keep brand - 40% spend on - Research on - Understand local
messaging and social media which location in target market
quality the same campaign each city would with survey and
as US stores. - 40% spend on attract more research to
sales promotion millennials insure optimal
- 20% spend on PR pricing.
- Review pricing 6
months after
launch.INTRODUCE CITY BURGERS
Product Promotion Place Pricing
Objectives - Launch a new - Total IMC budget: - Launch in U.S. by - Set price 5%
city burgers for $3m end of 2018 high than
each city that has - Increase average Shake
SHAKE SHACK awareness of the Shack price
stores by end of product line by point to convey
2018 90% before limited-edition
launching
Strategies - Market research: - Spend 40% on - First launch in NY, - Set price at
identify the most social media to California, $7.99 to have
significant chef in create buzz Florida, profit margin of
the city - Spend 40% on Washington, 20%.
- Create a limited- PR/event to Nevada,
edition city create Massachusetts,
burger. excitement for Illinois and Texas
the product line - Then launch in all
- Spend 20% on the other cities.
sales promotionWORST CASE: SHAKE SHACK WILL EARN 23M NET INCOME IN 2018
(% of total (% of total 2017 (% of total 2018
numbers, unless identified, are in USD thousands 2015 revenue) 2016 revenue) Estimate revenue) Estimate
Shack sales $183,219 96.10% $259,350 96.60% $335,820 96.50% $419,775
Licensing revenue 7,373 3.90% 9,125 3.40% 12,180 3.50% 15,225
TOTAL REVENUE 190,592 100.00% 268,475 100.00% 348,000 100.00% 435,000
Shack-level operating expenses(2):
Food and paper costs 54,079 29.50% 73,752 28.40% 99,180 28.50% 123,975
Labor and related expenses 44,752 24.40% 65,540 25.30% 88,740 25.50% 110,925
Other operating expenses 16,307 8.90% 24,946 9.60% 34,800 10% 43,500
Occupancy and related expenses 15,207 8.30% 21,820 8.40% 29,580 8.50% 36,975
General and administrative expenses 37,825 19.80% 30,556 11.40% 40,020 11.50% 50,025
Depreciation expense 10,222 5.40% 14,502 5.40% 18,792 5.40% 23,490
Pre-opening costs 5,430 2.80% 9,520 3.50% 10,440 3% 13,050
Loss on disposal of property and equipment 17 0% 34 0% 0 0% 0
TOTAL EXPENSES 183,839 96.50% 240,670 89.60% 321,552 92.40% 401,940
OPERATING INCOME 6,753 3.50% 27,805 10.40% 26,448 7.60% 33,060
Other income, net 7 0% 1,065 0.40% 1,392 0.40% 1,740
Interest expense -332 -0.20% -374 -0.10% -348 -0.10% -435
INCOME BEFORE INCOME TAXES 6,428 3.40% 28,496 10.60% 27,492 7.90% 34,365
Income tax expense 3,304 1.70% 6,350 2.40% 8,700 2.50% 10,875
NET INCOME 3,124 1.60% 22,146 8.20% 18,792 5.40% 23,490
Source:Shake Shack Announces Fourth Quarter and Fiscal Year Ended 2016 Financial Results. (n.d.). Retrieved July 28, 2017, from http://investor.shakeshack.com/investors-overview/news/press-release-
details/2017/Shake-Shack-Announces-Fourth-Quarter-and-Fiscal-Year-Ended-2016-Financial-Results/default.aspxMOST LIKELY: NEW PRODUCT LINE WILL CONTRIBUTE 7M NET INCOME IN 2018
(% of total (% of total 2017 (% of total 2018
numbers, unless identified, are in USD thousands 2015 revenue) 2016 revenue) Estimate revenue) Estimate
Shack sales $183,219 96.10% $259,350 96.60% $335,820 96.50% $440,986
Licensing revenue 7,373 3.90% 9,125 3.40% 12,180 3.50% 18,374
TOTAL REVENUE 190,592 100.00% 268,475 100.00% 348,000 100.00% 459,360
Shack-level operating expenses(2):
Food and paper costs 54,079 29.50% 73,752 28.40% 99,180 28.50% 137,808
Labor and related expenses 44,752 24.40% 65,540 25.30% 88,740 25.50% 119,434
Other operating expenses 16,307 8.90% 24,946 9.60% 34,800 10% 44,099
Occupancy and related expenses 15,207 8.30% 21,820 8.40% 29,580 8.50% 38,586
General and administrative expenses 37,825 19.80% 30,556 11.40% 40,020 11.50% 53,745
Depreciation expense 10,222 5.40% 14,502 5.40% 18,792 5.40% 24,805
Pre-opening costs 5,430 2.80% 9,520 3.50% 10,440 3% 16,078
Loss on disposal of property and equipment 17 0% 34 0% 0 0% 0
TOTAL EXPENSES 183,839 96.50% 240,670 89.60% 311,112 89.40% 418,477
OPERATING INCOME 6,753 3.50% 27,805 10.40% 26,448 7.60% 40,883
Other income, net 7 0% 1,065 0.40% 1,392 0.40% 1,837
Interest expense -332 -0.20% -374 -0.10% -348 -0.10% -459
INCOME BEFORE INCOME TAXES 6,428 3.40% 28,496 10.60% 27,492 7.90% 42,261
Income tax expense 3,304 1.70% 6,350 2.40% 8,700 2.50% 11,484
NET INCOME 3,124 1.60% 22,146 8.20% 18,792 5.40% 30,777
Source:Shake Shack Announces Fourth Quarter and Fiscal Year Ended 2016 Financial Results. (n.d.). Retrieved July 28, 2017, from http://investor.shakeshack.com/investors-overview/news/press-release-
details/2017/Shake-Shack-Announces-Fourth-Quarter-and-Fiscal-Year-Ended-2016-Financial-Results/default.aspxBEST CASE: SHAKE SHACK WILL EARN 2.2% MORE THAN THE FORECASTED
FIGURE UNDER MOST LIKELY SCENARIO
(% of total (% of total (% of total
numbers, unless identified, are in USD thousands 2015 revenue) 2016 revenue) 2017 Estimate revenue) 2018 Estimate
Shack sales $183,219 96.10% $259,350 96.60% $335,820 96.50% $451,008
Licensing revenue 7,373 3.90% 9,125 3.40% 12,180 3.50% 18,792
TOTAL REVENUE 190,592 100.00% 268,475 100.00% 348,000 100.00% 469,800
Shack-level operating expenses(2):
Food and paper costs 54,079 29.50% 73,752 28.40% 99,180 28.50% 133,423
Labor and related expenses 44,752 24.40% 65,540 25.30% 88,740 25.50% 118,859
Other operating expenses 16,307 8.90% 24,946 9.60% 34,800 10% 45,101
Occupancy and related expenses 15,207 8.30% 21,820 8.40% 29,580 8.50% 39,463
General and administrative expenses 37,825 19.80% 30,556 11.40% 40,020 11.50% 53,557
Depreciation expense 10,222 5.40% 14,502 5.40% 18,792 5.40% 25,369
Pre-opening costs 5,430 2.80% 9,520 3.50% 10,440 3% 16,443
Loss on disposal of property and equipment 17 0% 34 0% 0 0% 0
TOTAL EXPENSES 183,839 96.50% 240,670 89.60% 321,552 92.40% 420,941
OPERATING INCOME 6,753 3.50% 27,805 10.40% 26,448 7.60% 48,859
Other income, net 7 0% 1,065 0.40% 1,392 0.40% 1,879
Interest expense -332 -0.20% -374 -0.10% -348 -0.10% -470
INCOME BEFORE INCOME TAXES 6,428 3.40% 28,496 10.60% 27,492 7.90% 50,269
Income tax expense 3,304 1.70% 6,350 2.40% 8,700 2.50% 11,745
NET INCOME 3,124 1.60% 22,146 8.20% 18,792 5.40% 38,054
Source:Shake Shack Announces Fourth Quarter and Fiscal Year Ended 2016 Financial Results. (n.d.). Retrieved July 28, 2017, from http://investor.shakeshack.com/investors-overview/news/press-release-
details/2017/Shake-Shack-Announces-Fourth-Quarter-and-Fiscal-Year-Ended-2016-Financial-Results/default.aspxSHAKE SHACK BREAKFAST LAUNCH BY Q2 2018
Aug Sep Oct Nov Dec Jan Feb Mar
No Task Responsibility
17 17 17 17 17 18 18 18
1 Research and develop breakfast items. Marketing Team
2 Develop new item names and branding copy Marketing Team
Marketing Team
3 Design marketing assets
Marketing Team, Management Team
4 Develop item pricing
Focus group testing for taste and willingness to
5 Marketing Team
pay
Marketing Team
6 Tweak items based on feedback.
7 Research and source local farmers for ingredients Supply Chain Management Team
8 Setup logistics to get ingredients to restaurants Supply Chain Management Team
9 Train chefs and staff about new breakfast items Operations Team
Develop marketing materials, promote online + in-
10 Marketing Team
store
Setup press releases and notify media
11 Marketing Team
All teams, led by Management Team
12 Official launch nationwide
Source: Garutti, R., & Meyer, D. (2017). Shake Shack: recipes & stories. New York: Clarkson Potter P.156-p.161EXPAND NEW STORES IN ASIA BY END OF 2019
Aug Sep Oct Nov Dec Jan Feb Mar Apr May Jun July Aug Sep Oct Nov Dec
No Task Responsibility
17 17 17 17 17 18 18 18 18 18 18 18 18 18 18 18 18
1 Research which area to expand Management Team
Management Team
2 Find partner in each country.
Management Team
3 Scout locations in city.
Research and source local farmers
4 for ingredients Supply Chain Team, R&D
Management Team
5 Sign lease for space
Management Team, operation
6 Design space./ interior preparation
Team
7 Market research Marketing Team
Marketing Team
8 Product Testing/Focus group
HR
9 Hire Local management
Source: Garutti, R., & Meyer, D. (2017). Shake Shack: recipes & stories. New York: Clarkson Potter P.180-p.185EXPAND NEW STORES IN ASIA BY END OF 2019(CONTINUED)
Jan Feb Mar Apr May Jun July Aug Sep Oct Nov Dec
No Task Responsibility
19 19 19 19 19 19 19 19 19 19 19 19
10 Manager training HR
Marketing Team
11 Marketing Strategies Planning
Marketing Team
12 PR event/ Pre-opening
13 Store construction Operation Team
Operation Team
14 Store set up
15 Staff recruitment HR
16 Staff training HR
Marketing Team
17 Social Media promotion
18 Soft opening Management Team, Marketing Team
All, led by management team
19 Official Launch
Source: Garutti, R., & Meyer, D. (2017). Shake Shack: recipes & stories. New York: Clarkson Potter P.180-p.185INTRODUCE CITY BURGERS BY END OF 2018
Aug Sep Oct Nov Dec Jan Feb Mar Apr May Jun July Aug Sep Oct Nov Dec
No Task Responsibility
17 17 17 17 17 18 18 18 18 18 18 18 18 18 18 18 18
Research of famous chef of the Management Team
1
city
Marketing Team
2 Marketing research
3 Develop each City Burger with chef R&D
Focus group/ menu testing/price Marketing Team
4
range
5 Develop marketing strategies Marketing Team
Research and source local farmers
6 R&D
for ingredients
R&D
7 Tweak items based on feedback.
Train chefs and staff about new
8 Operation Team
City Burgers
9 Social Media campaign/Event Marketing Team
Setup press releases and notify Marketing Team
10
media
11 Official launch nationwide All, led by Management Team
Source:Garutti, R., & Meyer, D. (2017). Shake Shack: recipes & stories. New York: Clarkson Potter P.156-p.161Measuring the Success of The Recommendations
MISSION
To connect with people through their heart as well as through their stomachs
Innovation and Learning
Financial Measures Customer Perspective Operational Perspectives
Perspective
- Revenues specifically - # new customers - # of new customers - # of Breakfast items sold
from breakfast items, - # of press and social - % of breakfast and city - % of breakfast sales vs
international locations, media mentions burgers sold compared total sales.
and new city burger - Customer interest in to other items. - # of city burgers sold
products. new markets where - # of customers at new - Revenue from new
- Net Income Shake Shack hasn’t locations international outlets.
- ROI, ROE opened yet - Customer feedback on - Quality consistent in
- Earnings per share - Market Share new city burgers new locations.
- Dividends declared per - Customer satisfaction - Return on innovation - New location profits
share index - Time to market cover opening costs.
- Value of cross-sales - Time to resolve a quality
- Value of customer issue
lifetimeCONTIGENCY PLAN: BREAKFAST ITEMS
Extend breakfast items to all international stores if expectations are met
If Expectations are Met If Expectations are Not Met
Continue researching more breakfast items and brands Gap analysis between needs and offerings
to partner with.
Based on the gap analysis, plan for improvement.
Start planning roll out to other countries
Consider to add/adjust breakfast items and pricing to be
Consider limited-edition breakfast items. more of interest to consumers.
How to monitor and evaluate:
• Gather feedback via online surveys.
• Monitor social media for consumers’ reaction and feedback
• Quarterly meeting with management team to report on performance of initiative.
• Gather feedback from employees and district managers.CONTIGENCY PLAN:NEW STORES IN ASIA
Develop custom menu items for local tastes if expectations are met.
If Expectations are Met If Expectations are Not Met
Develop plan for more stores in China and Taiwan’s 2nd Gap analysis between needs and offerings
tier cities.
Based on the gap analysis, plan for improvement.
Offer delivery services from new stores.
Hire consulting agency to provide insights and research
Develop custom menu items for local taste. data to improve store sales.
How to monitor and evaluate:
• Analyse and track best and worst-performing items in each new store.
• Gather feedback via customer interviews and surveys after 1 month of opening.
• Monitor social media and other media for consumers’ reaction and feedback
• Quarterly meeting with management team to report on performance of new storesCONTIGENCY PLAN:CITY BURGERS
Extend to all international stores if expectations are met
If Expectations are Met If Expectations are Not Met
Make City Burgers permanent on menu. Gap analysis between needs and offerings
Expand the best City Burgers to other cities and
Based on the gap analysis, plan for improvement.
locations.
Introduce Country Burgers to continue buzz. Offer free samples or BOGO free incentives.
How to monitor and evaluate:
• Monitor social media and other media for consumers’ reaction and feedback.
• Quarterly meeting with management team to report on performance of City Burgers.
• Analyse and track sales for each type of City Burger.
• Provide taste surveys to customers and provide incentives for each response.APPENDIX
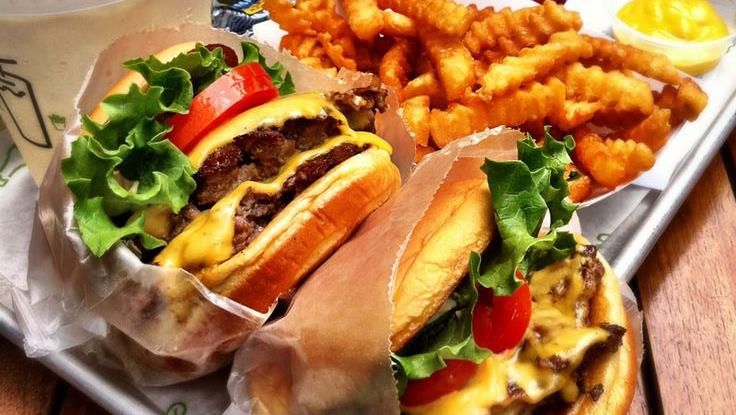
SHAKE SHACK’S BREAKFAST
NEW STORES IN ASIA
CITY BURGERS
CALCULATED SHEETS
THANK YOU
You can also read