MONASH MOTORSPORT ACCELERATES DEVELOPMENT WITH ANSYS
←
→
Page content transcription
If your browser does not render page correctly, please read the page content below
ACADEMIC STUDENT TEAM
MONASH MOTORSPORT
ACCELERATES
DEVELOPMENT
WITH ANSYS
The team from Monash University uses ANSYS software to design an
innovative drag reduction system.
By Scott Wordley, Stuart Buckingham, Damien McArthur, Marc Russouw, Luke Phersson and
Matt Corallo, Monash Motorsport, Monash University, Melbourne, Australia
F
ormula SAE competition chal-
lenges university students
each year to design, build,
market and race a small,
open-wheeled, Formula-style
car against other such insti-
tutions from around the globe. Monash
Motorsport, from Monash University in
Melbourne, Australia, is one of these
teams.
The Monash Motorsport team com-
prises approximately 70 under-
graduate students, primarily from
the Department of Mechanical and
Aerospace Engineering but also from
disciplines such as science, business,
marketing and even law. The demand-
ing nature of the competition gives stu-
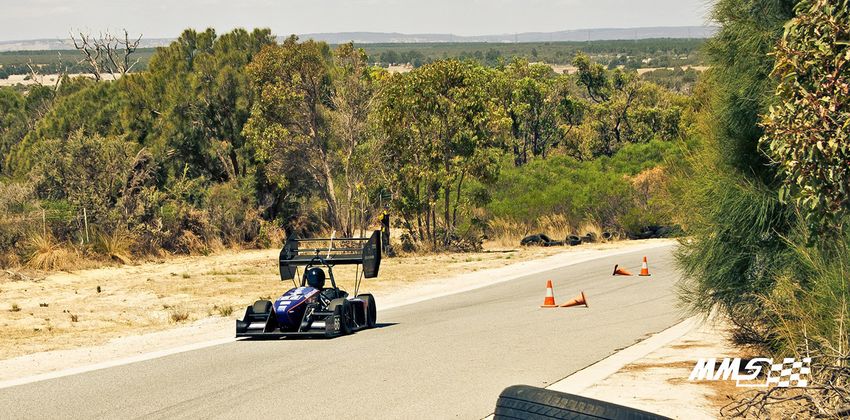
dents the chance to develop important 2011 Monash Motorsport car finishing the endurance event at Formula Student Germany
skills in teamwork, communication and in 2012. The Monash team finished in fourth place overall.
project management, along with helping
them to prepare for the challenges they
will face when they embark on profes-
sional careers in industry. Through a close relationship with ANSYS software and present examples of
Engineering students who partici- the local ANSYS channel partner, LEAP their work.
pate in this program benefit greatly from Australia, the group developed a range Monash Motorsport recently final-
the opportunity to develop their exper- of tutorials to help team members ized design and development of its
tise in computer-aided design and engi- and other students conduct finite ele- latest racer, the M13. The team’s cars are
neering (CAD and CAE) by modeling and ment analysis (FEA) and computational well known for their distinctive aerody-
simulating many different components fluid dynamics (CFD) studies for com- namic packages; Monash claimed four
and systems within the Formula SAE mon Formula SAE applications. Each competition wins and several top-five
car. Monash Motorsport team members year over spring break, the Monash places in recent Australian, U.K. and
have utilized ANSYS engineering simula- team organizes a three-day symposium German events. Aerodynamic packages
tion software for more than a decade to called Design to Win, during which local in Formula SAE are becoming popular, as
accomplish this work. Formula SAE teams receive training on teams learn that wings do indeed offer
© 2014 ANSYS, INC. ANSYS ADVANTAGE Volume VIII | Issue 1 | 2014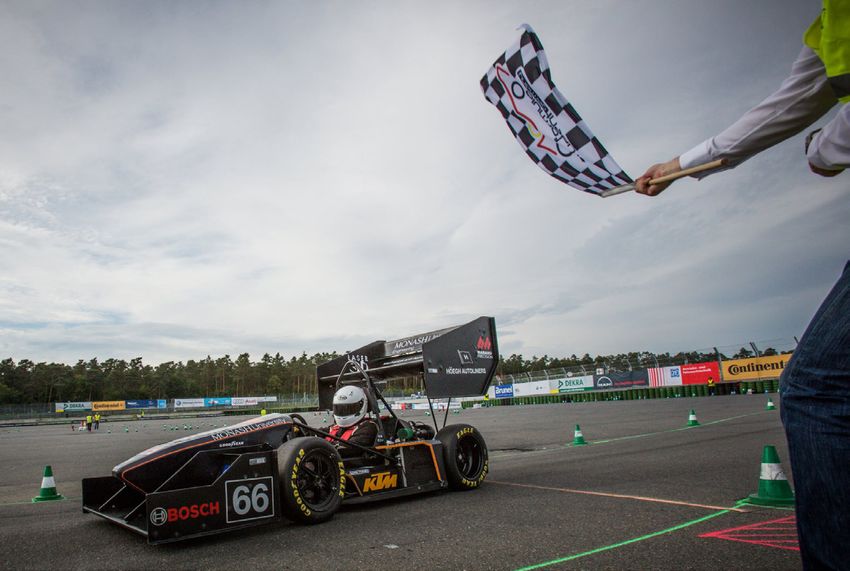
ACADEMIC STUDENT TEAM
benefits! Successful implementation of a
well-designed aero package can result in
significant improvements in a car’s per-
formance on tight, twisting Formula SAE
tracks, even though the average track
speed is low — at around 60 kilometers
per hour.
AERODYNAMIC IMPROVEMENTS
The new M13 racer is a clean-sheet
redesign in all respects, incorporat-
ing a number of significant aerody- The Monash M12 car with DRS engaged and flaps open during on-track testing
namic improvements and novel design
features made possible by extensively
using ANSYS Mechanical, ANSYS CFX
and ANSYS Fluent. The car is one of
only a few Formula SAE vehicles world-
wide to utilize a drag-reduction system
(DRS), used in current Formula One rac-
ing. This innovation enables the angle of
the flaps in the multi-element front and
rear wings to be dynamically adjusted
via pneumatic cylinders and linkages.
As a result, the car has two distinct aero-
dynamic modes: high downforce and
low drag.
The DRS is activated when the driver
presses a button on the steering wheel,
so the low-drag setting can be used when
the car is driving in a straight line and ANSYS CFX velocity contours and vectors show how the different flap rotation angles for
DRS were tested and optimized, using a 3-D CFD model of the entire car.
significant downforce is not required. By
using a button to engage DRS, the driver
can revert to the high-downforce mode
and maximize the car’s downforce (and
drag) before applying the brakes at the
end of a straight — which an automated
system cannot do reliably without GPS-
enabled track mapping.
Having access to a drag-reduction
system has allowed this year’s Monash
team to significantly increase its down-
force target for the M13 car to a CL.A
(“A” denotes frontal area — when com-
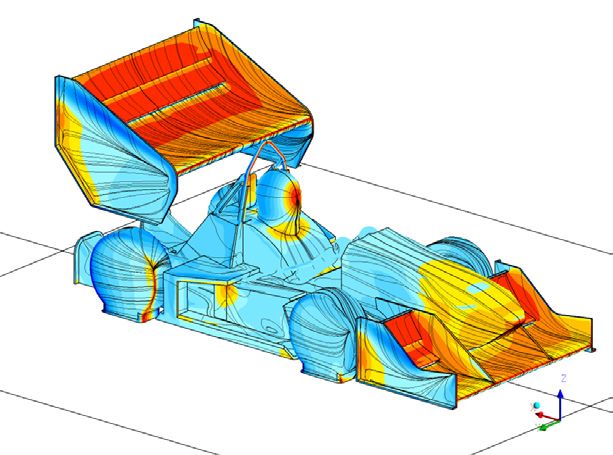
bined with lift coefficient, this provides ANSYS CFX results demonstrate the dramatic differences in surface pressure magnitude
a more representative measure of the and vortex structures (iso-surfaces) generated by high-downforce mode (left) and
car’s performance on track while taking DRS-engaged low-drag mode (right). DRS activation results in a 50 percent reduction
geometry into account) of greater than in drag generated by the full car.
6, given that drag is no longer a signif-
icant limitation on straight-line perfor-
mance. Before starting design, the team
invested time in developing a standard The team chose to use a symmetry The Monash Motorsport team won its fifth
fluid domain and boundary setup to model (using only half the car) to maxi- consecutive Australasian FSAE Champion-
ensure consistency and comparability mize mesh resolution, given RAM-based ship in 2013, with a strong performance on
track and in all static events. The team will
among all future simulations. Domain meshing and solution time limitations
also compete with their 2013 car at Formula
size and mesh sensitivity studies were when working on single local nodes. Student UK and Germany in 2014, hoping to
undertaken, and benchmarking tests Testing showed that approximately improve upon third- and fourth-place finishes
were conducted with different turbu- 15 million to 20 million elements for in these events in 2012.
lence models.
© 2014 ANSYS, INC. ANSYS ADVANTAGE Volume VIII | Issue 1 | 2014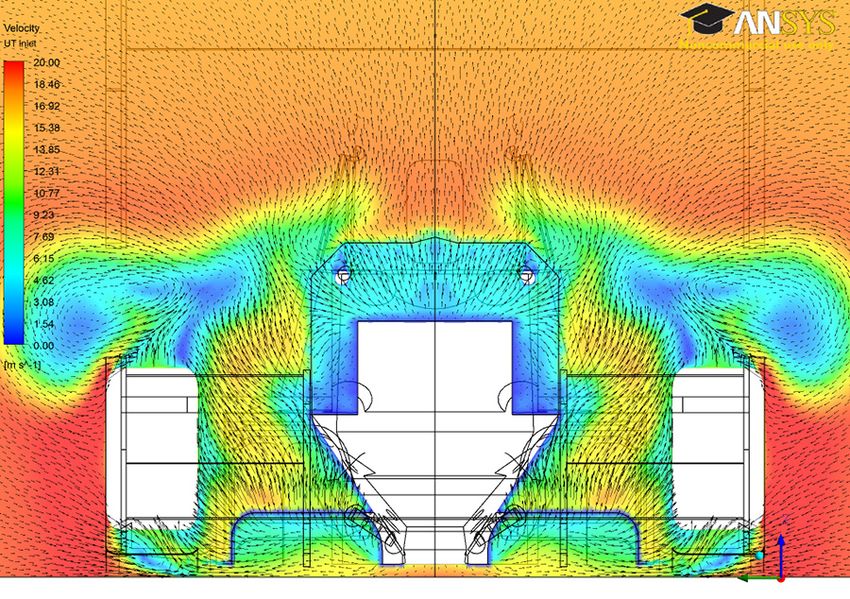
ACADEMIC STUDENT TEAM
the symmetry model provided the best
compromise between mesh resolution
and solver time, based on Monash’s
current computational resources. A
400-iteration run using the k-omega SST
turbulence model generally solved in
less than six hours, which was consid-
ered an acceptable turnaround time.
The eight-person aero team conducted
and documented almost 200 unique Colored velocity profiles — and vectors
Sample ANSYS CFD-Post pressure contours at inlet to the undertray — are useful to
aerodynamic design iterations over a
and surface streamlines for M13 car. qualitatively compare how much mass
three-month period at the start of 2013. flow is being captured by the inlet (low
Yellow and red areas denote pressures
A team-developed ANSYS CFD-Post state above static pressure, and blue denotes transverse velocity components shown
file was used to allow fast and consis- areas below static pressure. Surface by the vectors in the plane but also high
tent automated post-processing as well streamlines help denote flow separation resultant velocity magnitude shown by
and re-attachment lines as well as vortex the color contours) as well as separate
as output of figures (pressure contours, planes in regions of interest for automated,
activity impinging on vehicle surfaces.
streamlines and vortex cores), tables quantitative calculation of mass flow rates
of force and coefficient results via the (for example, radiator and diffuser tunnels).
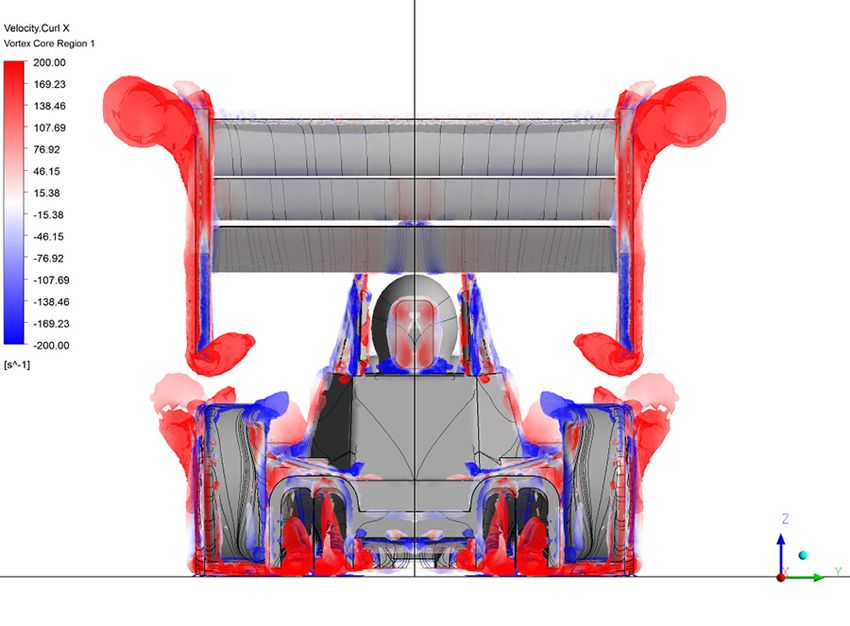
report function. The team utilized cus-
tom pressure color scales to clearly dif-
ferentiate positive pressures (yellow to
red) from suction pressures (blue). A
custom red/blue scale was applied to
stream-wise vorticity and used to color
vortex core iso-surfaces, neatly high-
lighting the direction of vortex rotation.
Chord-wise plots of coefficient of pres-
sure for the front and rear wings at a
range of span-wise locations were rou-
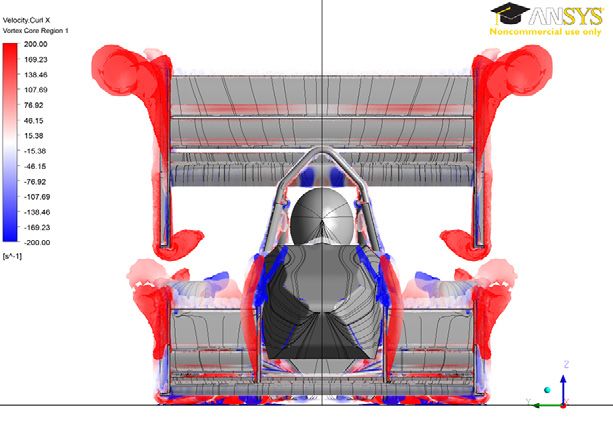
tinely generated to fine-tune wing pro- Semi-transparent vortex core iso-surfaces, colored for stream-wise vorticity, to indicate
files as well as to better understand direction of vortex rotation. Due to use of a symmetry model and reflection of the results,
span-wise pressure variations. colors are the same on either side of the car.
Keyframe animations were used
extensively to generate longitudinal
total pressure sweep videos and vortex
core videos, providing insight into the
complex vortex and wake interactions
that dominate the vehicle’s near field.
Juggling these vortex and wake interac-
tions proved crucial in maximizing the
downforce produced by the front wing
and underbody diffuser, as well as in
balancing the front and rear downforce
distribution for the whole car. These
full-car interactions drove the team’s
final choice of rear-wing height and pro-
vided confidence with respect to the
cooling flows entering the radiator and
turbo intercooler.
The full results from each run, along
with associated CAD models and ANSYS
Workbench archives, were updated to a
private team Wiki in real time through-
Example of chord-wise coefficient-of-pressure plots for 2012 three-element front wing.
out the design phase, which facilitated
Dark blue denotes the slice at the centerline of car; lighter blues are slices taken moving
rapid communication and results shar- progressively outboard from center. These results demonstrate the significant contribution
ing among the team. This ensured that made by the center of the wing, justifying the team’s choice to increase car nose height to
all members remained updated on the maintain the wing in this region. Note that there is no centerline data for the last wing
design progress, which minimized repe- element due to a two-element configuration in the center section under the nosecone.
tition and duplication as well as helped
© 2014 ANSYS, INC. ANSYS ADVANTAGE Volume VIII | Issue 1 | 2014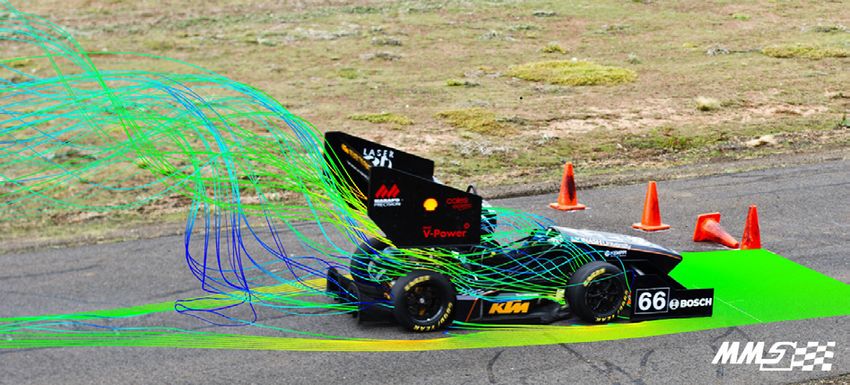
ACADEMIC STUDENT TEAM

student engineers to discuss and incor-
porate the best design features into the
next round of CFD runs.

INFRASTRUCTURE FOR
COMPLEX SIMULATIONS
Beyond conducting CFD analysis, the
Monash team developed a methodology
and hardware infrastructure required to
conduct large and complex simulations
(incorporating up to 200 million ele-
ments) combined with a rotating refer-
ence frame. A rotating reference frame
is needed for modeling aerodynamic
effects when the car is turning a corner,
since the interactions cannot be accu-
rately estimated nor understood using
traditional fixed-flow yaw angles applied
to the entire car (as in a wind tunnel).
   The team developed a 100-node
local Beowulf-style cluster by utilizing
                                              Steps necessary to solve CFD simulation, including software package used for each
idle desktop machines in the Monash           stage. All processes in the yellow box have been scripted to run on the Beowulf cluster.
Engineering Computer Labs, which were         By running these processes remotely, the workstation computer is freed up to do other
made available for the team’s use over-       tasks. The large files created for the mesh and solution are generated remotely. Users must
night and on weekends. A fully auto-          download the results to post-process, but transferral of large mesh files from the remote
mated grid-generation outsourcing tool        system is not needed.
was scripted to allow geometry clean-
up, surface and volume meshing, and
solving to be completed remotely on
the cluster, thereby avoiding RAM lim-
itations and slow transfer times for the
large meshes, which otherwise would be
generated locally.

                                              The incident angle, θ, is the angle that the freestream air makes with the car centerline
                                              at the point of impact. The freestream vector is tangential to the center of rotation and,
                                              therefore, perpendicular to any line that radiates from the center of rotation. The angle
                                              is identical to that formed between the line radiating from the center of rotation to the
Dimensions of far-field domains. All dimen-   point of interest and the line that radiates from the center of rotation and is perpendicular
sions are non-dimensionalized by dividing     to the centerline of the car. By decreasing the parameter r, both θfront and θrear increase.
by total car length.                          Increasing the parameter ψ moves the center of rotation point rearward. This has the effect
                                              of reducing the rear incidence angle, θrear, but increasing the front incidence angle, θfront.
                                              Due to the large cost in time of setting up, solving and post-processing a rotating reference
                                              frame simulation on the cluster, only one case was considered. The 200 runs conducted
                                              by the team were completed for a straight line case, and automation allowed runs to be
                                              turned around in 12 hours. Using this method, the team could cycle through many different
                                              iterations within a very narrow design window of approximately three months.

© 2014 ANSYS, INC.                                                                            ANSYS ADVANTAGE Volume VIII | Issue 1 | 2014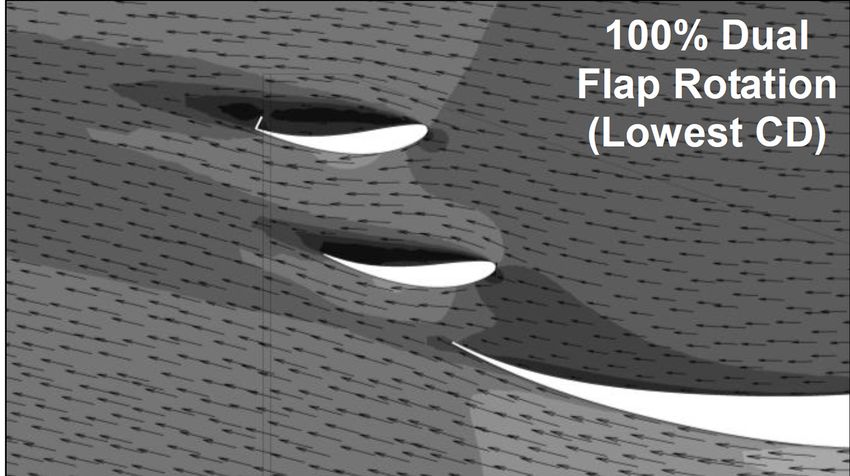
Turbulent wake profile of rotating reference frame case visualized
                                                                      using volume render to turbulent kinetic energy (TKE) measured
                                                                      in J/kg. The edges of the ground plane indicate the bounds of the
                                                                      fluid domain. This type of representation serves to illustrate the
                                                                      asymmetry of the wake behind the car in the rotating reference
                                                                      frame. (Rendering palette used in this visualization is different
Test case of empty domain (reduced to only a few elements in          from other cases and should not be used for direct comparison.)
height) to confirm that boundary conditions set for the domain
produced expected flow

WIND TUNNEL EXPERIMENTS
Monash Motorsport is fortunate to have
access to a full-scale automotive wind
tunnel on campus; this has allowed the
team’s engineers to extensively correlate
aerodynamic predictions obtained from
ANSYS software with data from on-track
testing. Typically, the team starts by cor-
relating wind tunnel and CFD results
for performance of wings in isolation,
via wing angle-of-attack and yaw angle
                                               Turbulent wake profile of rotating reference frame case visualized using volume render of
sweeps made in freestream in the tun-          turbulent kinetic energy, as viewed from right side of race car
nel. Then the car is added, which allows
a detailed study of the rear wing height
along with endplate size, shape and
detail features. Cooling performance is
measured using a specific-dissipation
test rig within the tunnel, which circu-
lates heated coolant through the radiator
at a measured flow rate. Thermocouples
in the coolant lines allow the team to
calculate heat dissipation as a function
of the temperature differential between
ambient air flow and coolant.

                                               Turbulent wake profile of rotating reference frame case visualized using volume render of
                                               turbulent kinetic energy, as viewed from above race car

© 2014 ANSYS, INC.                                                                            ANSYS ADVANTAGE Volume VIII | Issue 1 | 2014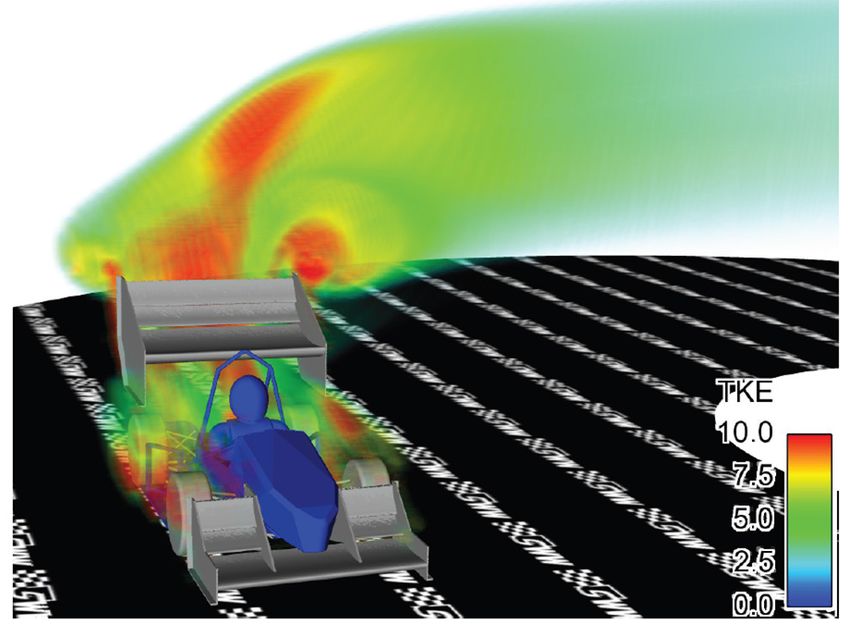
Example of full car yaw sweep undertaken in wind tunnel

Results of specific dissipation testing undertaken
in wind tunnel

                                                                     2011 Monash Motorsport car finishing the endurance event at
                                                                     Formula Student Germany in 2012. The Monash team finished in
                                                                     fourth place overall.

                                                                     Team engineers extensively
                                                                     correlate aerodynamic predictions
                                                                     obtained from ANSYS software
On-track testing results were used to correct wind tunnel results
                                                                     with data from on-track testing.
for the front wing.

SUMMARY                                         significant improvement in team knowl-     Authors’ Note
CFD has proven to be a powerful tool            edge transfer (with reports of each run    Monash Motorsport has published sev-
for the Monash Motorsport team, par-            saved on the team knowledge data-          eral SAE papers on the aerodynamic
ticularly since wind tunnel testing time        base for future members to access and      development of its past cars, and team
is limited to a few days each year. The         learn from) as well as ease of compar-     members are happy to talk with other
team can narrow down the most prom-             ison between runs. The use of CFD has      teams implementing aerodynamic
ising design concepts without having to         allowed the team to spend financial and    studies. The team sincerely thanks all
incur the cost of fabricating each design       time resources for building and testing    current and past team members for
change and physically testing it in the         various prototype designs on only the      their hard work and dedication to this
wind tunnel or on track. Furthermore,           most promising few.                        project — as well as LEAP Australia,
automation of the simulation setup in                                                      ANSYS, the Department of Mechanical
ANSYS software has allowed for quicker                                                     and Aerospace Engineering at Monash,
turnaround times on simulations (down                                                      and the Monash wind tunnel facility.
to 12 hours from 24 hours), and stan-
dardized report generation has yielded

© 2014 ANSYS, INC.                                                                         ANSYS ADVANTAGE Volume VIII | Issue 1 | 2014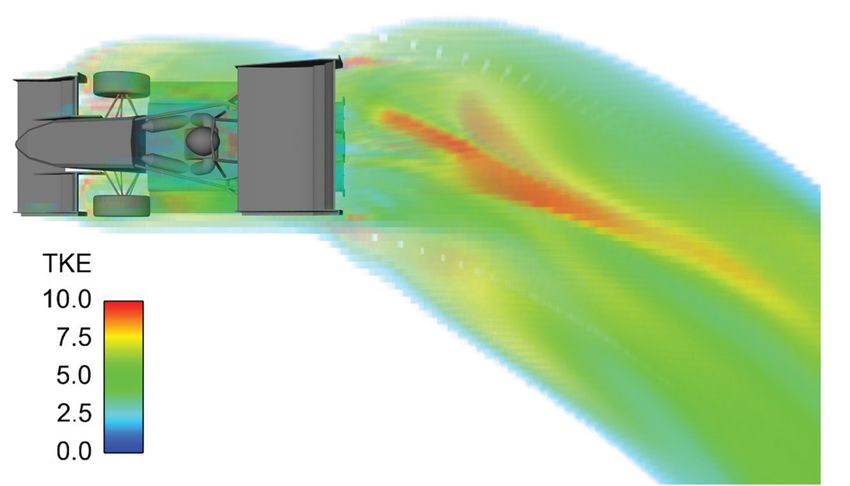
You can also read