The Economics of NFL Team Ownership - Professor Kevin M. Murphy Professor Robert H. Topel
←
→
Page content transcription
If your browser does not render page correctly, please read the page content below
The Economics of NFL Team Ownership

                              Professor Kevin M. Murphy
                               Professor Robert H. Topel

                                    CHICAGO PARTNERS
                            A SUBSIDIARY OF NAVIGANT CONSULTING, INC.

                                       140 South Dearborn Street
                                         Chicago, Illinois 60603

This report was prepared at the request of the National Football League Players’ Association. The views
expressed herein are the views of the authors.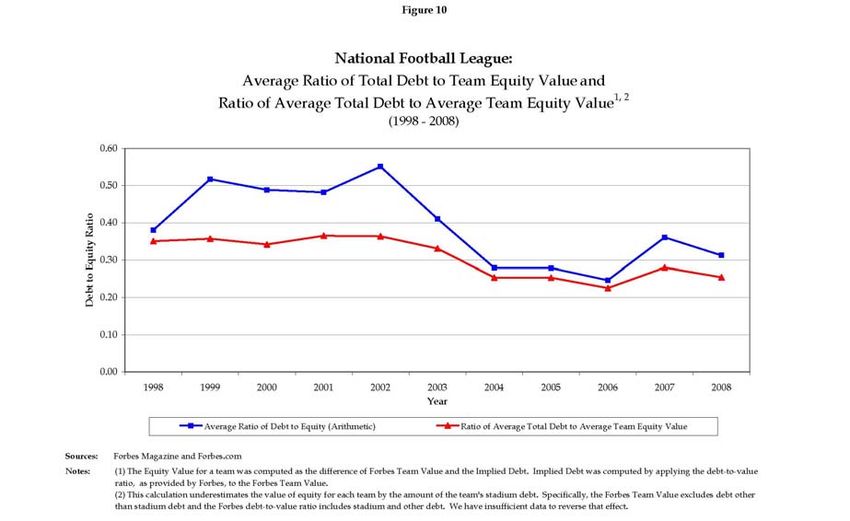
THE ECONOMICS OF NFL TEAM OWNERSHIP
                             Profs. Kevin M. Murphy & Robert H. Topel1

         Our firm has been asked by the NFL Players Association (NFLPA) to examine the
NFL owners’ claim that they cannot continue to operate economically under the current
salary cap/free agency system. The best source of information for this analysis would have
been the audited financial statements of the NFL and each of its 32 teams and affiliated
enterprises. However, we understand that the NFL owners are unwilling to provide that
information to either the NFLPA or the public. The best available alternative information is
contained in the financial statements of the Green Bay Packers (the one publicly owned
franchise in the NFL) and in data collected by reputable third parties and by the NFLPA.
The data from these various sources are broadly consistent with one another. Thus we
conclude that together they paint a reliable picture of the financial performance of NFL
teams.

         Based on our analysis of the economic and financial data, we have reached the
following conclusions:

         •      Over the past decade, NFL owners have, on average, done very well
                financially, and they have continued to do well since the 2006 extension of
                the current Collective Bargaining Agreement (CBA).2

         •      Team values have nearly quadrupled since 1998: the average NFL team is
                now worth more than $1 billion.

1
    Dr. Murphy is the George J. Stigler Distinguished Service Professor of Economics at the Booth School
    of Business and the Department of Economics at The University of Chicago. Dr. Topel is the Isidore
    Brown and Gladys J. Brown Professor of Economics at The University of Chicago Booth School of
    Business, Director of the University’s George J. Stigler Center for the Study of the Economy and the
    State, and Director of the University of Chicago Energy Initiative. Both Dr. Murphy and Dr. Topel are
    also Principals at Chicago Partners, an economics consulting firm that specializes in the application of
    economic theory and statistics to a variety of legal and regulatory issues. Chicago Partners is a wholly
    owned subsidiary of Navigant Consulting, Inc.
2
    As is the case with any average, some teams are doing better than the average, and some are doing
    worse. However, we note that the NFL has existing mechanisms for revenue-sharing and thus is
    presumably in a position to assist weaker teams if it so desires.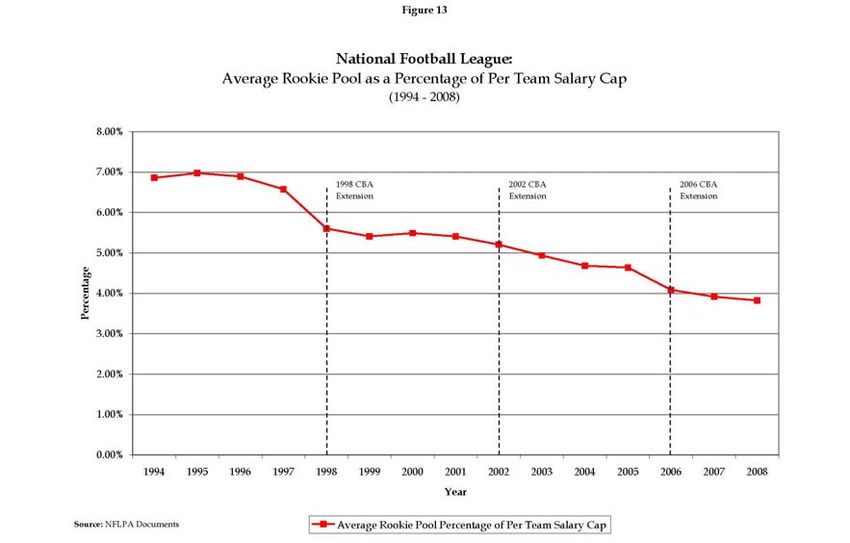
•       Over the past five years, average operating income per team has been $26.4
               million. Last year, the average team earned approximately $25 million.

       •       When one takes into account both capital appreciation and operating income,
               NFL owners have realized average total returns of nearly $100 million per
               year per team, or an average annual return of 17.6 percent over the past
               decade.

       •       The financial returns to NFL owners have been substantially greater than the
               returns to investments in the overall U.S. economy as reflected in broad-
               based stock market indices.

       •       The percentage of total revenues paid to players in the years following the
               2006 CBA extension is lower than the average percentage paid to players
               since the NFL and the players entered into the current salary cap/free agency
               system in 1993. Recent increases merely reverse a downward trend that
               began in 1999.

       •       The proportion of rookie player salaries in the NFL has declined over the
               past decade.

       •       NFL owners have enjoyed substantial increases in their wealth under the
               salary cap/free agency system. To the extent that the recent turmoil in the
               financial markets may have an impact on future economic performance, the
               current system contains an adjustment mechanism that will restrain the
               salary cap and put a ceiling on the player compensation as a percentage of
               overall revenues.

I.     ECONOMIC FRAMEWORK
       In press reports we have seen, NFL owners appear to be claiming that they are not
earning enough to be able to afford their labor costs. It appears they are focused on net
operating income, i.e., they are claiming that they are not making enough money because
net operating income is “too low.” However, net operating income fails to take into
account the increase in the value of NFL teams and thus is not a reasonable economic
measure of return. The true economic return to team ownership includes both net operating

                                             -2-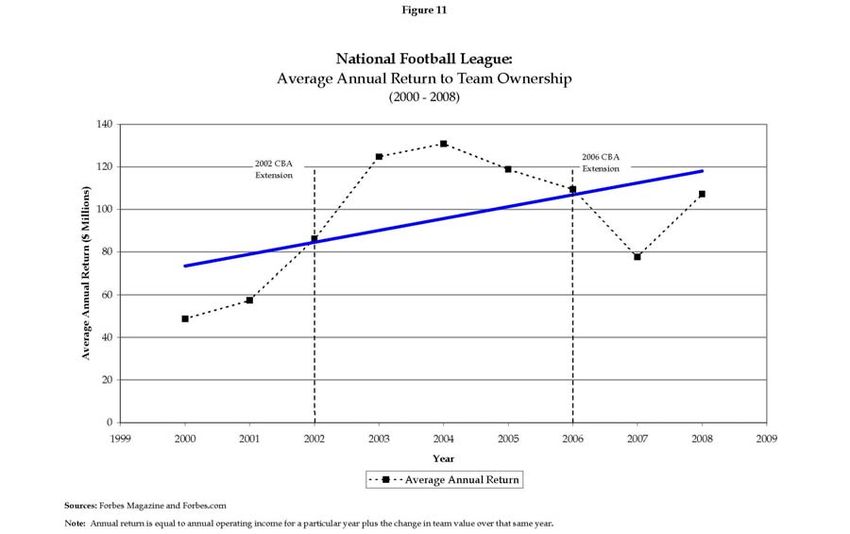
income and the increase in team value. If a person buys a stock for $1, and then sells it a
year later for $101, he or she will have made $100, regardless of whether the company paid
a dividend that year. When one considers both operating income and capital appreciation,
as one should, the NFL owners have enjoyed great economic success, particularly over the
last decade.

II.    THE ECONOMIC DATA
       With the notable exception of the Green Bay Packers, all of the NFL teams are
privately held. They do not release their financial information to the public, and the NFL
itself releases very little financial information. We understand that in response to claims by
the NFL owners about their recent financial difficulties, the NFLPA asked the owners to
provide financial data to support their claims, but the owners refused. Thus, we do not have
access to the direct data that an economist would normally use to analyze the economics of
team ownership. However, there are other data upon which we can rely, including the
following:

       •       Financial information for the Green Bay Packers as publicly reported to their
               shareholders (1997-2008);

       •       Estimates of team values and other financial information reported by Forbes
               (1998-2008);

       •       Transactions data for expansions and full or partial sales for all teams,
               compiled by Professor Gerald W. Scully (1922-2008); and

       •       Information on aggregate NFL revenues and player costs disclosed by the
               NFL and the NFLPA (1994-2007).

       The Forbes data contain information on individual franchise value, revenue,
operating income, debt, player expenses, and (for the last six years) gate receipts. NFL
owners have criticized the Forbes data, particularly the estimates of team value, but they
have not provided any contrary financial information. Moreover, comparisons of the
Forbes data with the financial information from the Green Bay Packers and other aggregate
information produced as part of the salary cap calculations indicate that the Forbes data are
reasonably accurate.

                                            -3-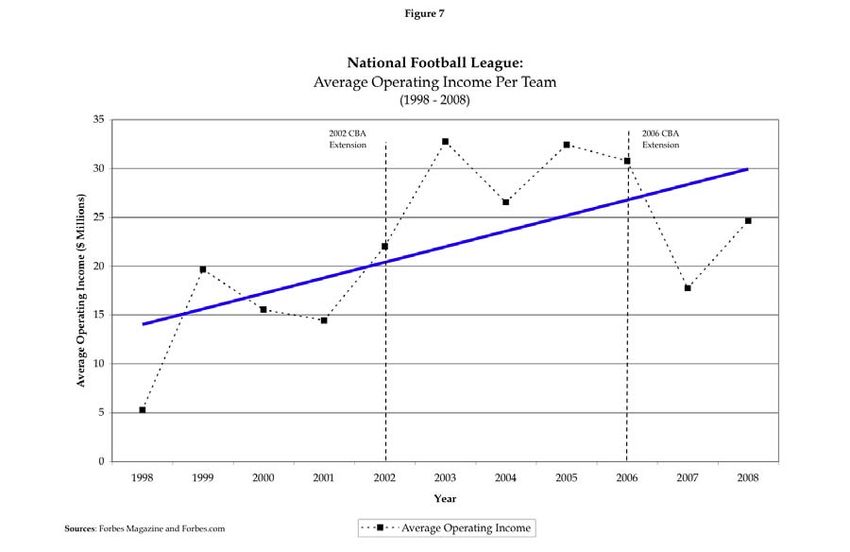
The reasonableness of these data is shown by Figures 1 through 3, which compares
various financial results for the Packers with the equivalent results as presented in the
Forbes data.3 Figure 1 compares revenues for the Packers as disclosed in their financial
statements with revenues as presented in the Forbes data. As the figure shows, the Packers’
revenues as reported in their financial statements were slightly higher and grew more
rapidly than the revenues presented in the Forbes data. These facts indicate that the Forbes
data are conservative in this regard.

       The similarity of the two data sources is also apparent in a comparison of reported
player costs (see Figure 2).

3
    Over the past five years, the Green Bay Packers have been approximately in the middle of all NFL teams
    in financial performance as reported by Forbes. They were 19, 15, 22, 15, and 19 from the top in
    operating income in the years from 2004 through 2008, respectively, and tied for 13 (with the Detroit
    Lions), 13, 12, 14, and 13 from the top in team revenue over the years from 2004 through 2008,
    respectively. This indicates the financial performance of the Packers has been roughly average, i.e., the
    team is not an outlier.

                                                  -4-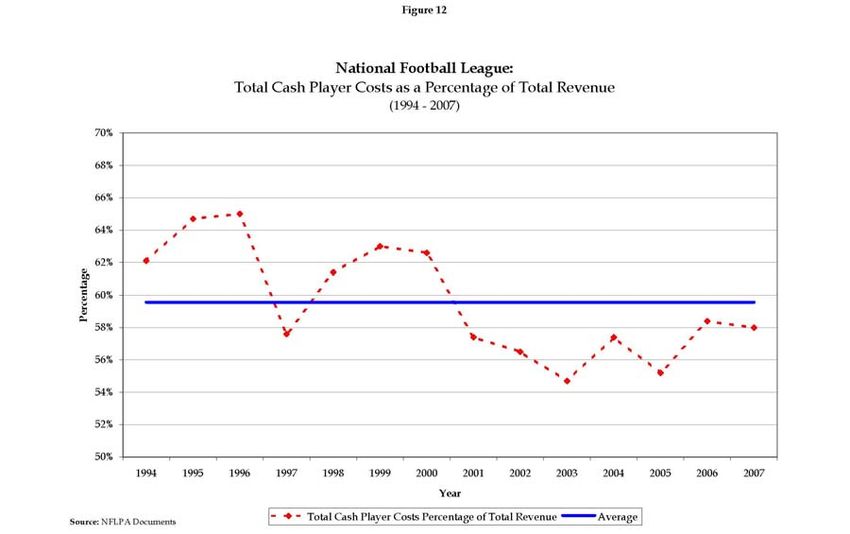
As to operating income, the Forbes data and the Packers financial information are
also reasonably close, as shown in Figure 3.

                                          -5-
The utility of the Forbes data for assessing the economics of NFL ownership is also
confirmed by comparing the total revenue and total player cost data contained in the Forbes
data versus the same data as disclosed (in aggregate terms) by the NFL and the NFLPA:
-6-These figures show that, although the Forbes data do not match the NFL data exactly, they
are a reasonable approximation and, in any event, they are not systematically biased, i.e.,
they are not generally too high or too low relative to market transactions. If anything, the
Forbes aggregate revenue data are somewhat conservative.
III. NFL OWNER FINANCES
A. The Return to Owning an NFL Team
1. Operating Income
The NFL has done very well financially over the past decade. League revenues have
more than doubled (see Figure 4 above). In addition, the NFL has developed new sources of
income, including the internet and new media, and many teams now enjoy new stadiums.
Net operating income has also risen substantially over the past decade. Although net
operating income was $790 million this past year, it has been over $1 billion in two of the last
six years and just under $1 billion in another, separate and apart from any capital gains.
On average, operating income per team has ranged from just under $20 million to
more than $30 million each year since 2002:
-7-Notably, average operating income over this period has generally been above average
operating income in the years prior to the two extensions of the CBA with the NFLPA.
(The Green Bay Packers have reported annual operating income of between $20 million
and $35 million since the 2006 CBA extension (see Figure 3 above)).4
2. Franchise Values
A large portion of the return to NFL team ownership has come in the form of capital
appreciation. Between 1998 (when Forbes began reporting team values) and 2008, the
average NFL team increased in value from $288.1 million to $1.04 billion, or 360 percent:
4
While net operating income as reported is not precisely equal to cash flow, our analysis of the Green Bay
financial statements suggests that operating income in this industry is a relatively good measure of cash
flow, and therefore, it is a reasonable approximation for purposes of determining the overall return to
NFL team ownership. Green Bay’s income statements are almost certainly based on accrual based
accounting, which can lead to some differences between operating income and cash flow.
-8-In other words, the value of the average NFL team has risen at a compound annual rate of
13.7 percent over this period. While NFL owners have criticized the Forbes franchise value
estimates as too high, a review of the published data on actual transactions suggests that
while the Forbes data overstated transactions’ values in some cases, they understated those
values in others, and overall, there does not appear to be a systematic bias one way or the
other.
-9-In addition, the values reported by Forbes are confirmed by an analysis of the data
on actual sales. We have used regression analysis to examine the transactions that have
involved a total or partial sale or an expansion of the league since 1970 (the year in which
the then-existing National and American Football Leagues merged to form the NFL as we
now know it). This analysis suggests that the average team value has increased at a
compound annual rate of approximately 12.4 percent per year over the period, or 325
percent between 1998 and 2008.5 This result is based on both actual transactions and
information from the Forbes estimates. If we use information on transactions only, we
estimate that average team value has increased at a compound annual rate of 12 percent.
Thus, an econometric analysis of the data on actual sales and other transactions confirms
that the Forbes estimates of increases in team value are consistent with what has happened
in the marketplace.
This past December, Stephen Ross exercised an option to complete the purchase of
a 95 percent interest in the Miami Dolphins at a price that puts the value of the team at
more than $1 billion.6 This transaction suggests that NFL franchise values have not
suffered the same way that other investments have in the wake of the recent financial
turmoil in the U.S. and elsewhere.7 This is not altogether surprising, since a large fraction
of NFL revenues come from multi-year arrangements that are not subject to wide short-
term variability. For example, national television contracts – which contribute about $3
billion in revenues to the NFL each year – are long-term contracts, some of which are not
5
This growth rate is a bit lower than the growth rate from the Forbes data, but it is driven in part by the
fact that this is an average, and growth in team value during the early part of the period was lower than
in the latter part.
6
See, e.g., ESPN.com. 2008. “Owners unanimously approve 50 percent sale to real estate mogul.”
http://sports.espn.go.com/nfl/news/story?id=3322338. (Accessed January 27, 2009) ; Jackson,
Barry. 2009. “Miami Dolphins sale complete as Stephen Ross becomes majority owner.” The Miami
Herald, http://www.miamiherald.com/sports/story/864120.html (Accessed January 27, 2009);
ESPN.com. 2009. “Ross, Huizenga complete Fins sale,”
http://sports.espn.go.com/nfl/news/story?id=3847012 (Accessed January 27, 2009).
7
The recent sale of partial ownership interests in the Pittsburgh Steelers also supports the continued
strength of NFL team values, with reports indicating the sale of this franchise (in a relatively small
market) occurred with the team valued at between $800 million and more than $1 billion. The fact that
the transaction occurred between family members suggests that the value of the transaction may, if
anything, be understated.
- 10 -scheduled to expire until 2011. Steady revenue streams like this contribute to the financial
stability of NFL teams.8
The rate of return for an NFL owner has proven to be substantially better than the
performance of other investments in the U.S. economy in general. The following is a
comparison of the average returns to NFL team ownership from 1998 to 2008 versus a
broad-based U.S. stock index, the S&P 500:
As the graphic shows, NFL team ownership has consistently yielded a better overall return
than a typical investment in the U.S. economy, including after the recent stock market
decline. Moreover, these numbers may understate just how well the owners are actually
doing. Without detailed financial information, it is difficult to determine the extent to
which there are returns that are not captured in the data to which we have access. Many
sports teams have affiliated businesses, and it could easily be the case that they are making
money from these businesses that would be correctly attributed to their ownership of the
8
Tony Barilla, “Economic Insights: The National Football League,” The Business Report & Journal,
October 30, 2006.
- 11 -team. To the extent that there are enterprises affiliated with various NFL teams, our
estimates of total return are likely to be conservative.
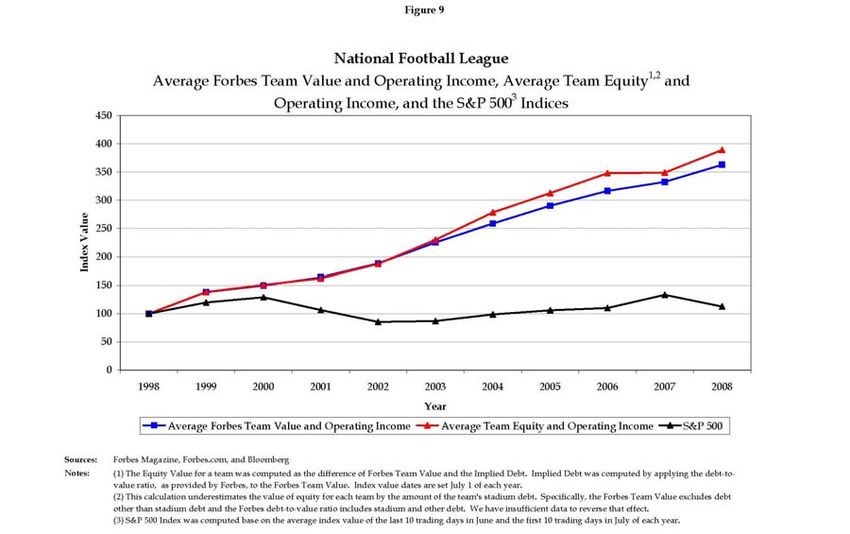
One of the reasons cited by the NFL owners for the desire to renegotiate the 2006
CBA is the increased amount of debt that the teams are currently carrying. However, from
an economic perspective, debt cannot be evaluated in absolute terms; it should instead be
considered in light of the overall value of the enterprise that has incurred the debt. In other
words, a company worth $1 billion that has $100 million in debt is, as a general matter, in
better shape economically than a company worth only $1 million that has $100 million in
debt. This fact is reflected in a measure that is commonly known as the company's “debt-
to-equity ratio.” The data on this point indicate that NFL owner debt has decreased over
time when compared to the equity of the teams:
As the figure shows, although total debt in the NFL has increased in absolute terms,
it has increased more slowly than has team value. This indicates that debt is less of an issue
for NFL teams now than it has been in the past. One should also note that a portion of the
recent increase in debt is the result of financing put in place to build stadiums, including
those now under construction by the Cowboys in Dallas and the Giants and the Jets in New
York. These stadiums will generate revenue streams that will not be recognized in team
- 12 -income until some time in the future. In sum, NFL owner complaints about increasing debt
do not appear to be well founded.
3. The Combined Wealth Effect of Increased Operating
Income and Franchise Values for NFL Owners
As noted earlier, the total wealth generated by a company must take into account
both operating income and capital appreciation. Taking both of these factors into account,
between 2000 and 2008, NFL owners realized, on average, total returns of between $49
million and $131 million per year depending on the year, with average financial returns in
recent years that have typically exceeded $100 million per year:
Notably, the average return for an NFL owner, when both operating income and
capital appreciation are taken into account, has averaged approximately $100 million per
year ($98.1 million) since the 2006 CBA extension. (The return in two of the three years
has been above $100 million). While the average return for NFL owners may be slightly
lower than it was prior to 2006 (when it was more than $120 million per year), NFL
ownership is still extraordinarily profitable.
- 13 -IV. IMPLICATIONS FOR PLAYER SALARIES
In light of the information presented above, it is difficult to make a case that the
owners are not earning enough to pay the players what they are due to make under the
current CBA. NFL teams are individually worth, on average, more than $1 billion, and
NFL owners have continued to realize financial returns of approximately $100 million per
year even after the 2006 CBA extension. The most valuable team, the Dallas Cowboys, is
worth an estimated $1.612 billion, and even the least valuable team, the Minnesota Vikings
(which is one of the few teams in the NFL playing in a relatively old stadium), is worth an
estimated $839 million. NFL teams are cash-flow positive. Over the past five years, out of
160 yearly financial results for NFL teams, there have only been eight instances in which
Forbes reported that a team had a net operating loss in a particular year. In 2008, only one
team, the Detroit Lions, had a net operating loss, and that was small ($3.1 million). And,
finally, the value of the average NFL team continues to rise, notwithstanding the increase in
player compensation. All of this suggests that NFL team owners are doing very well under
the current system.
To the extent that NFL owners are complaining about the level of player salaries
compared to their revenues, it appears the owners are arguing that the players should
receive a percentage of revenues that is less than the average percentage they have
historically received under the free agency/salary cap system that has been in place since
the prior system was declared to be an antitrust violation by a Minnesota federal court. A
graph of the annual percentages of total player compensation compared to total revenues in
the NFL shows that the recent increase since the 2006 CBA extension has simply returned
the players’ percentage to a level near the overall average:
- 14 -Considering the changes in the players' overall percentage over time, it appears that
the players' percentage did not keep pace with the growth in NFL revenues after 2000. To
the extent the 2006 CBA extension resulted in increases in the salary cap, those increases
have raised the players' percentage so that it is closer to the historical average of
approximately 59 percent of revenue. Reducing the players' percentage, as the owners
suggest, would not redress a situation in which the players are receiving a higher than
average percentage, but would instead reduce the players' percentage to a level below the
historical average.
If the owners have concerns that the current economic climate will persist over the
long term and restrain the revenue growth they have consistently enjoyed, the current CBA
provides that the players' percentage is subject to a ceiling mechanism under which the
salary cap plus projected player benefits cannot exceed more than 61.68 percent of
projected revenues in any year. Since the owners' total annual return appears to be much
greater than the difference between the players' current percentage and this ceiling, the
owners should have a substantial cushion. This protection is extraordinarily unusual when
compared to other industries in the U.S.
- 15 -Finally, we understand that the owners seek a change in the system for
compensating rookie players in the NFL, apparently arguing that the current system has left
teams paying more for untested rookie talent than for proven veterans. The available data
suggest that the owners' argument is without merit. The chart below shows the average
rookie pool as a percentage of the per team salary cap from 1994 to the present. As this
chart shows, the average rookie pool has declined relative to the per team salary cap from
approximately 7 percent in 1994 to just under 4 percent in 2008.
And the proportion of rookie compensation that is guaranteed is far less than the
relative share of rookies on rosters:
- 16 -This strongly suggests that compensation for rookies is far less favorable on the whole than
is compensation for veterans.
V. CONCLUSION
Our review of the available data shows that the NFL owners’ arguments about their
inability to continue with the CBA are unfounded. The owners seem to be focusing on net
operating income, which is the wrong measure and can be very misleading. If one focuses
on total return, which is the appropriate measure, the owners have done extremely well.
For example, on average, since 2002, NFL owners have enjoyed returns of more than $100
million per team per year. It is therefore clear that NFL teams are successful businesses
that have no economic need to alter the current CBA system. Nor does the current
economic environment require any change in the CBA system, as it already has built-in
mechanisms to protect the NFL owners in an economic downturn.
- 17 -
NY4 4011066.1 779605 673753 1/8/2009 12:17pmProfessor Kevin M. Murphy
Professor Murphy is the George J. Stigler Distinguished Service Professor of
Economics in the Booth School of Business and the Department of Economics at The
University of Chicago, where he has taught since 1983. He received his bachelor’s
degree in economics from the University of California, Los Angeles, in 1981, and his
doctorate in economics from The University of Chicago in 1986.
At The University of Chicago, he is a member of the faculties of both the Booth
School of Business and the Department of Economics. He teaches graduate level courses
in microeconomics, price theory, empirical labor economics, and the economics of public
policy issues. In these courses, he covers a wide range of topics, including the incentives
that motivate firms and individuals, the operation of markets, and the impacts of
regulation and the legal system. Most of his teaching focuses on two things: how to use
the tools of economics to understand the behavior of individuals, firms and markets; and
how to apply economic analysis to data. His focus in both research and teaching is on
integrating economic principles with empirical analysis.
He is the author of two books and the author or co-author of more than fifty
articles in a variety of areas in economics. These articles have been published in leading
scholarly and professional journals, including the American Economic Review, The
Journal of Law and Economics, and the Journal of Political Economy. His writing has
also been published in numerous mainstream publications, including the Boston Globe,
New York Times, Chicago Tribune, and two articles in the Wall Street Journal, both of
which were co-authored with Nobel laureate Gary Becker.
He is a Fellow of the Econometric Society and an elected member of the
American Academy of Arts and Sciences. In 1997, he was awarded the John Bates Clark
Medal, which the American Economic Association awards once every two years to an
outstanding American economist under the age of forty. In 2005, he was named a
MacArthur Fellow, an award that provides a five-year fellowship to individuals who
show exceptional merit and promise for continued and enhanced creative work. He is the
first professor at a business school to receive a MacArthur award in the twenty-five years
they have been given.
In addition to his position at The University of Chicago, he is a Principal at
Chicago Partners, a subsidiary of Navigant Consulting, a consulting firm that specializes
in the application of economics to law and regulatory matters. He is also a faculty
research associate at the National Bureau of Economic Research.Professor Robert H. Topel
Professor Robert H. Topel is the Isidore Brown and Gladys J. Brown Professor of
Economics at The University of Chicago Booth School of Business, Director of the
University’s George J. Stigler Center for the Study of the Economy and the State, and
Director of The University of Chicago Energy Initiative. He received his B.A. in
economics from The University of California, Santa Barbara in 1974 and a Ph.D. in
economics from The University of California, Los Angeles in 1981.
In addition to his position in the Booth School of Business at The University of
Chicago, Professor Topel has been a member of the faculties in the Department of
Economics at The University of Chicago and the Department of Economics at The
University of California, Los Angeles. At these institutions, he has taught courses on
Markets and Prices, Economic Theory, Labor Markets, Compensation and Personnel
Policies, Industrial Organization and Antitrust, Business Strategy, and Law and
Economics.
Professor Topel is the author of several books, including The Welfare State in
Transition with Richard Freeman and Birgitta Swedenborg, Labor Market Data and
Measurement with John Haltiwanger and Marilyn Manser, and Measuring the Gains from
Medical Research: An Economic Approach with Kevin M. Murphy. He has written more
than 60 articles and monographs that have been published in professional journals.
From 1993 to 2003, he was Editor of the Journal of Political Economy, and from
1991-1993, he was a member of the Editorial Board of the American Economic Review,
two of the leading professional publications in economics and economic theory. He is
also a past founding editor of the Journal of Labor Economics (1982-92), and is currently
a member of the Editorial Advisory Board of the International Journal of the Economics
of Business and the Advisory Board of the Economics Research Network.
He is a research associate of the National Bureau of Economic Research, an
elected member of the Council on Income and Wealth, an elected Founding Member of
the National Academy of Social Insurance, a Fellow of the Stanford University Center for
the Study of Poverty and Inequality, and a member of the Brookings Panel on Economic
Activity. In 2004, he was elected an Honorary Fellow of the Society of Labor
Economists. In 2005, he received the Eugene Garfield Award for contributions to the
economics of medical research, and in 2006 he received the Kenneth Arrow Award from
the International Health Economics Association.
Professor Topel is also a Principal at Chicago Partners, a subsidiary of Navigant
Consulting, a consulting firm that specializes in the application of economics to law and
regulatory matters. He has held various visiting and research positions with the Board of
Governors of the Federal Reserve, the World Bank, Economics Research Center of the
National Opinion Research Center, the Brookings Panel on Economic Activity, the Rand
Corporation, and the Center for the Study of the Economy and the State.You can also read