The association of Emergency Department presentations in pregnancy with hospital admissions for postnatal depression (PND): a cohort study based ...
←
→
Page content transcription
If your browser does not render page correctly, please read the page content below
Xu et al. BMC Emergency Medicine (2017) 17:12
DOI 10.1186/s12873-017-0123-8

 RESEARCH ARTICLE                                                                                                                                 Open Access

The association of Emergency Department
presentations in pregnancy with hospital
admissions for postnatal depression
(PND): a cohort study based on linked
population data
Fenglian Xu1*, Elizabeth A. Sullivan1, Roberto Forero2 and Caroline S. E. Homer1

  Abstract
  Background: To investigate the impact of presenting to an Emergency Department (ED) during pregnancy on
  postnatal depression (PND) in women in New South Wales (NSW), Australia.
  Method: An epidemiological population-based study using linked data from the NSW Emergency Department Data
  Collection (EDDC), the NSW Perinatal Data Collection (PDC) and the NSW Admitted Patients Data Collection (APDC)
  was conducted. Women who gave birth to their first child in NSW between 1 January 2006 and 31 December 2010
  were followed up from pregnancy to the end of the first year after birth.
  Results: The study population includes 154,328 women who gave birth to their first child in NSW between 2006
  and 2010. Of these, 31,764 women (20.58%) presented to ED during pregnancy (95%CI = 20.38–20.78). Women who
  presented to ED during pregnancy were more likely to be admitted to hospital for the diagnosis of unipolar depression
  (the adjusted relative risk (RR) =1.86, 95%CI = 1.49–2.31) and the diagnosis of mild mental and behavioural disorders
  associated with the puerperium (the adjusted RR = 1.55, 95%CI = 1.29–1.87) than those without ED presentation.
  Conclusion: Women’s hospital admissions for postnatal depression were associated with frequent ED presentations
  during pregnancy.
  Keywords: Emergency Department presentation, Postnatal depression, Pregnancy, Postpartum, Data linkage, Population

Background                                                                             nulliparous women) showed that 16.1% of women were
Depression in the postnatal period is a major public                                   screened to be at risk of depression (using the Edinburgh
health problem that can significantly impact the health                                Postnatal Depression Scale, EPDS) during the first
of the whole family [1, 2]. One of our previous studies                                12 months postpartum [4]. The study also showed that
showed that the hospital admission rates for psychiatric                               poor physical health in the early postnatal period was
disorders in the first year after birth increased signifi-                             associated with poorer mental health throughout the
cantly between 2001 and 2010, with a more marked in-                                   first 12 months postpartum [4]. For example, women
crease from 2005 (1.16% in 2001, 2.28% in 2010) [3].                                   reporting greater than four health problems had a six-
The increase in hospital admissions was mainly attrib-                                 fold increase in the likelihood of reporting concurrent
uted to the diagnoses of unipolar depression, adjustment                               depression at three months postpartum (adjusted odds
disorders and anxiety disorders [3]. A recent prospective                              ratio(OR) = 6.69, 95%CI = 3.0–15.0) and a three-fold in-
pregnancy cohort study in Melbourne, Australia (n = 1507                               crease in the likelihood of reporting subsequent depres-
                                                                                       sion at 6–12 months postpartum (adjusted OR = 3.43,
* Correspondence: Fenglian.Xu@uts.edu.au                                               95%CI = 2.1–5.5) [4]. Women experiencing a greater
1
 Faculty of Health, University of Technology Sydney, Ultimo 2007, Australia            number of physical health problems also seem to be at
Full list of author information is available at the end of the article

                                         © The Author(s). 2017 Open Access This article is distributed under the terms of the Creative Commons Attribution 4.0
                                         International License (http://creativecommons.org/licenses/by/4.0/), which permits unrestricted use, distribution, and
                                         reproduction in any medium, provided you give appropriate credit to the original author(s) and the source, provide a link to
                                         the Creative Commons license, and indicate if changes were made. The Creative Commons Public Domain Dedication waiver
                                         (http://creativecommons.org/publicdomain/zero/1.0/) applies to the data made available in this article, unless otherwise stated.
Xu et al. BMC Emergency Medicine (2017) 17:12 Page 2 of 9
increased risk of reporting depression in early pregnancy delivery and neonatal outcomes. The APDC is a rou-
[5]. However, the impact of physical health problems tinely collected census of all hospital separations. It
during pregnancy on depression after birth (postnatal includes all patient hospitalisations in NSW public and
depression, PND) is unknown. To date, we have not private hospitals, including psychiatric hospitals and day
found any literature that explores the association be- procedures. It includes information on patient demo-
tween ED presentation during pregnancy and hospital graphics, diagnoses and clinical procedures. Since 1999,
admission for PND. It is important to understand this the diagnoses for admissions have been coded according
association so preventative measures can be put in place to the 10th revision of the International Statistical Clas-
if they are required. This study aims to address this gap sification of Diseases and Related Health Problems,
in this area of research. We have used population-based Australian Modification (ICD-10-AM) [7]. The EDDC
linked data to: is the primary data source from the EDs of NSW public
hospitals. It contains patient demographics (e.g. age,
1. describe the rate of ED presentations for women country of birth, sex and marital status), time-tracking
during pregnancy information, including arrival and discharge dates, and
2. compare the risks of hospital admission for PND triage category, mode of admission, disposition and the
in women with and without ED presentations diagnosis.
during pregnancy. Data linkage was performed by the NSW Department
of Health Centre for Health Record Linkage (CHeReL)
The assumption was that ED presentation in preg- using probabilistic record linkage methods and Choice-
nancy is associated with an increased risk of hospital maker software [8]. Identifying information from PDC,
admission for PND. PND refers to the principal diag- EDDC and APDC datasets was included in the Master
noses of depressive disorders including unipolar de- Linkage Key constructed by the CHeReL. At the comple-
pressive disorder, mental and behavioural disorders tion of the process, each record was assigned a Person
associated with the puerperium and others (the diag- Project Number to allow records for the same individual
noses are detailed in the methodology section) in the to be linked. Based on the 1,000 randomly selected sam-
first year after birth. ple of records, the false positive rate of the linkage was
0.3% and false negativeXu et al. BMC Emergency Medicine (2017) 17:12 Page 3 of 9
Fig. 1 The Data Linkage and Study Population
elsewhere classified] and F53.9 [Puerperal mental dis- for maternal age, maternal country of birth, maternal
order, unspecified]; (3) Others including F33 [recurrent diabetes mellitus and hypertension, gestational diabetes,
depressive disorder excluding the in remission three- smoking status during pregnancy, remoteness of living
digit code F33.4]; F34.1 [dysthymia]; F38 [other speci- area, a socio-economic indicator (i.e. the Index of Rela-
fied affective disorder]; and F39 [unspecified mood tive Socio-economic Disadvantage Quintile) [10], mode
(affective) disorder]. of birth, infant gender and birthweight. There were
In this study, only the hospital admission with a princi- missing values in 3,414 women’s records (2.21%). The
pal diagnosis in the first year after birth was used for the variables with missing values included remoteness of liv-
analysis of the rate, relative risk (RR) and adjusted RR. ing area (2585, 1.68%), a socio-economic indicator disad-
vantage (2585, 1.68%), smoking status during pregnancy
Statistical analysis (565, 0.37%), mode of birth (108, 0.07%), infant birth-
Descriptive statistics were used to analyse the rate of weight (99, 0.06%), baby’s gender (60, 0.04%) and maternal
hospital admission. Logistic regression was used to esti- age (31, 0.02%). There were no missing values in variable
mate the adjusted odds ratio (AOR) of women’s charac- of maternal country of birth, maternal and gestational dia-
teristics on ED presentation. Cox regression was used to betes mellitus, and maternal hypertension. The analyses
estimate the RR of ED presentations during pregnancy were conducted using IBM SPSS (Statistical Package for
on hospitalisation for PND. The RR was adjusted (ARR) the Social Sciences) Statistics 22) [11].Xu et al. BMC Emergency Medicine (2017) 17:12 Page 4 of 9
Ethics approval were 154,328 women who met the criteria and were in-
This study was approved by the NSW Population and cluded in the data analysis. Women’s characteristics,
Health Services Research Ethics Committee and the Hu- demographic factors and ED presentations are described
man Research Ethics Committee of the University of in Table 1. A total of 31,764 women (20.58%) presented
New South Wales and University of Technology Sydney, to ED during pregnancy in NSW between 2005 and
Australia (reference number: 2011/06/328). 2010 (95%CI = 20.38–20.78). The ED presentation during
pregnancy was associated with maternal age. ED presenta-
Results tion decreased significantly as age increased for women
The study population comprised primiparous women under 40 years old. Women aged between 35 and 39
who gave birth in NSW between 2006 and 2010. There years had the lowest ED presentation rate (rate = 13.50%,
Table 1 Primiparous women’s characteristic and ED presentation in pregnancy in NSW, 2005–2010
Indicator Value Woman ED presentations in pregnancy Rate AOR 95%CI
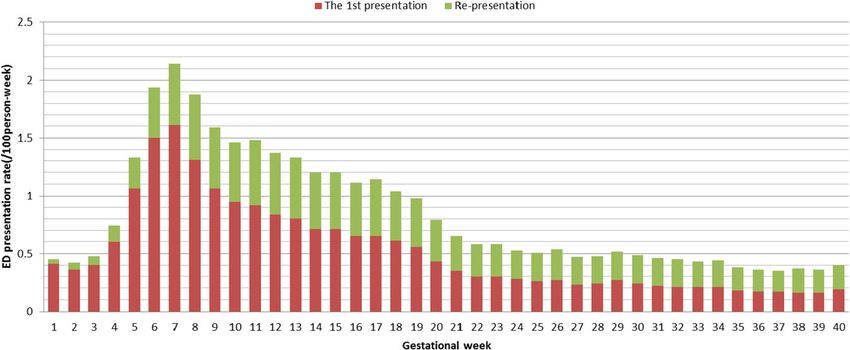
Maternal age*Xu et al. BMC Emergency Medicine (2017) 17:12 Page 5 of 9 95%CI = 13.03-13.97; AOR = 0.72, 95%CI = 0.74–0.80 gestational week (2.14/100 person-week, 95%CI = 1.91– compared with women aged 25 and 29). Young women 2.37) and then declined significantly until 22 weeks (Fig. 2). were more likely to visit the ED (rate = 39.07%, 95%CI = Table 2 shows the hospital admissions for PND in 38.14-40.00 for women aged below 20; AOR = 2.11, women with and without ED presentations during preg- 95%CI = 2.02–2.22 compared with those aged between nancy. Women who presented to ED during pregnancy 25 and 29 years). ED presentation was significantly associ- were more likely to be admitted to hospital for the diag- ated with relative socio-economic disadvantage, smoking nosis of unipolar depression (F32) (rate = 7.08/1000, in pregnancy, maternal and gestational diabetes mellitus, 95%CI = 6.16–8.00) than those without an ED presenta- and maternal hypertension. Women born outside Australia tion (rate = 2.89/1000, 95%CI = 2.59–3.19). There was no were less likely to visit the ED during pregnancy (Table 1). significant difference in hospital admission rates for the Compared with women living in major cities, those living diagnosis of mild or severe mental and behavioural dis- in inner regional areas were more likely to visit ED but orders associated with the puerperium (F53.0 and F53.1) those living in outer regional and remote areas were less between women with and without ED presentations dur- likely to visit ED during pregnancy (Table 1). ing pregnancy (Table 2 and Fig. 3). Overall, 21,357 visits (41.89%) were made by women Hospital readmissions were not homogeneously distrib- presenting to the ED only once whereas 10,407 women uted. The readmissions were attributed mainly to a small made multiple presentations, accounting for 29,625 number of women. (58.11%) of the 50,982 total number of presentations For the sub-categories of F53, F53.8 (other mental and during the observation period). Of the 31,764 women behavioural disorders associated with the puerperium, not who presented to the ED during the 10-month observa- elsewhere classified) and F53.9 (puerperal mental disorder, tion period, 20.58% (31,764/154,328) made at least one unspecified), the numbers of hospital admissions were too visit and 12.45% (19,218/154,328) made at least one sub- small to calculate their specific rates and RRs (8 hospital sequent visit. The total ED presentation rate was 33.03% admissions with the diagnosis of F53.8 and 2 admissions (50,982/154,328, 95%CI = 32.80–33.26). Using person- with the diagnosis of F53.9). However, the admissions of year as the denominator for comparison with another diagnoses were included in the analysis of overall F53. period or another population, the first presentation Table 3 shows that the risk of hospital admission for during the observation period was 27.40/100 person- PND was higher in women who presented to ED during year (31,764/115,911, 95%CI = 27.14–27.66/100); the re- pregnancy than without ED presentation (adjusted RR = presentation during the observation period was 16.58/100 1.64, 95%CI = 1.43–1.88). The adjusted RR was 1.86 person-year (19,218/115,911, 95%CI = 16.37–16.79/100). (95%CI = 1.49–2.31) for the diagnoses of unipolar de- The total presentation during the observation period pressive disorder (F32) and 1.55 (95%CI = 1.29–1.87) for was 43.98/100 person-year) (50,982/115,911, 95%CI = mild mental and behavioural disorders associated with 43.69–44.27/100). the puerperium (F53.0). The adjusted factors include Figure 2 shows the distribution of ED presentations and maternal age, maternal country of birth, maternal dia- the rate of ED presentation over gestational weeks. The ED betes mellitus and hypertension, gestational diabetes, presentations were below 0.50/100 person-week in the first smoking status during pregnancy, remoteness of living 3 gestational weeks. Since the 4th gestational week, the ED area, Index of Relative Socio-economic Disadvantage presentations increased significantly and peaked in the 7th Quintile, mode of birth, infant gender and birthweight. Fig. 2 The Rate of Emergency Department Presentations During Pregnancy, New South Wales, 2005–2010
Xu et al. BMC Emergency Medicine (2017) 17:12                                                                                        Page 6 of 9

Table 2 Hospital admissions for postnatal depression in women with and without ED presentations during pregnancy, NSW 2006–2011
Principal      ED               Woman The 1st admission                          Re-admission                   Overall admission
diagnosis      presentation
                                      Admission Rate                95% CI       Admission Rate        95% CI   Admission Rate       95% CI
               during pregnancy
                                                 (/1,000)                                  (/1,000)                       (/1,000)
Unipolar       No                  122564 279              2.28     2.01     2.55 75            0.61   0.47 0.75 354          2.89   2.59     3.19
depressive
disorder (F32) Yes                 31764    129            4.06     3.36     4.76 96            3.02   2.42 3.62 225          7.08   6.16     8.00
               Total               154328 408              2.64     2.38     2.90 171           1.11   0.94 1.28 579          3.75   3.45     4.05
Mild MBDP      No                  122564 479              3.91     3.56     4.26 63            0.51   0.38 0.64 542          4.42   4.05     4.79
(F53.0)
               Yes                 31764    158            4.97     4.20     5.74 15            0.47   0.23 0.71 173          5.45   4.64     6.26
               Total               154328 637              4.13     3.81     4.45 78            0.51   0.40 0.62 715          4.63   4.29     4.97
Severe MBDP No                     122564 97               0.79     0.63     0.95 64            0.52   0.39 0.65 161          1.31   1.11     1.51
(F53.1)
            Yes                    31764    25             0.79     0.48     1.10 10            0.31   0.12 0.50 35           1.10   0.74     1.46
               Total               154328 122              0.79     0.65     0.93 74            0.48   0.37 0.59 196          1.27   1.09     1.45
MBDP (F53)     No                  122564 562              4.59     4.21     4.97 147           1.20   1.01 1.39 709          5.78   5.36     6.20
               Yes                 31764    185            5.82     4.98     6.66 27            0.85   0.53 1.17 212          6.67   5.77     7.57
               Total               154328 747              4.84     4.49     5.19 174           1.13   0.96 1.30 921          5.97   5.59     6.35
Others         No                  122564 23               0.19     0.11     0.27 61            0.50   0.37 0.63 84           0.69   0.54     0.84
               Yes                 31764    11             0.35     0.17     0.63 4             0.13   0.04 0.33 15           0.47   0.26     0.78
               Total               154328 34               0.22     0.15     0.29 65            0.42   0.32 0.52 99           0.64   0.51     0.77
Overall        No                  122564 815              6.65     6.19     7.11 332           2.71   2.42 3.00 1147         9.36   8.82     9.90
depressive
disorders      Yes                 31764    304            9.57     8.50 10.64 148              4.66   3.91 5.41 452         14.23   12.93 15.53
               Total               154328 1119             7.25     6.83     7.67 480           3.11   2.83 3.39 1599        10.36   9.85     10.87
ED Emergency Department, MBDP Mental and behavioural disorders associated with the puerperium (F53)

The adjusted RR for severe mental and behavioural dis-                         Discussion
orders associated with the puerperium (F53.1) was not                          The association between ED presentation and PND is
statistically significant. The adjusted RR for other de-                       not well investigated [12, 13]. This study has shown
pressive disorders was 1.90, but the difference was not                        that women who visited the ED during pregnancy were
statistically significant (95%CI = 0.90–4.00). This may be                     more like to be admitted to hospital for PND after
attributed to the small number of women (only 34                               birth. This leads on from a prospective study in six
women were admitted to hospital for this diagnosis).                           metropolitan public maternity hospitals in Victoria,
                                                                               Australia which showed that women reporting five or
                                                                               more physical health problems (e.g. exhaustion, morn-
                                                                               ing sickness, back pain, constipation and severe head-
                                                                               aches or migraines) in early pregnancy had a three-fold
                                                                               increase of depressive disorders (adjusted OR = 3.13,
                                                                               95%CI = 2.14–4.58) in early pregnancy (gestation =
                                                                               15 weeks) [5]. A study in 181 women showed that
                                                                               women’s distress in the week following childbirth was
                                                                               associated with more frequent vomiting during the
                                                                               first 3–4 months of pregnancy [14]. The most common
                                                                               reasons for women visiting ED during pregnancy were
                                                                               haemorrhage and bleeding, abdominal pain and vomit-
                                                                               ing (Fig. 4). The most common gestation was seven
                                                                               weeks suggesting that early pregnancy issues were the
                                                                               main reason for ED presentation.
                                                                                  The ED presentation rate in pregnancy from this data
 Fig. 3 The Hospital Admission Rate (/1,000) of Women with and                 was 43.98/100 person-year (95%CI = 43.69–44.27/100
 without Emergency Department Presentation During Pregnancy,
                                                                               person-year). The rate was significantly higher than for
 New South Wales, 2005–2010
                                                                               the general population in NSW and Australia [15].
Xu et al. BMC Emergency Medicine (2017) 17:12 Page 7 of 9
Table 3 The relative risk (RR) of hospital admissions for postnatal depression in women with and without ED presentations during
pregnancy, NSW 2006–2011
Principal diagnosis ED presentation during pregnancy Woman RR 95% CI Adjusted RRa 95% CI
Unipolar depressive disorder (F32) No 122564 1 1
Yes 31764 1.79 1.45 2.20 1.86 1.49 2.31
Mild MBDP (F53.0) No 122564 1 1
Yes 31764 1.27 1.06 1.52 1.55 1.29 1.87
Severe MBDP (F53.1) No 122564 1 1
Yes 31764 0.99 0.64 1.54 1.17 0.74 1.85
MBDP (F53) No 122564 1 1
Yes 31764 1.27 1.08 1.50 1.53 1.28 1.81
Others No 122564 1 1
Yes 31764 1.85 0.90 3.79 1.90 0.90 4.00
Overall depressive disorders No 122564 1 1
Yes 31764 1.44 1.26 1.64 1.64 1.43 1.88
ED Emergency Department RR relative risk, MBDP Mental and behavioural disorders associated with the puerperium (F53)
a
Adjusted for maternal age, maternal country of birth, maternal diabetes mellitus and hypertension, gestational diabetes, smoking status during pregnancy,
remoteness of living area, Index of Relative, Socio-economic Disadvantage Quintile, delivery method, infant gender and birthweight
Fig. 4 The Top 10 Frequent Diagnoses for Women’s Emergency Department PresentationXu et al. BMC Emergency Medicine (2017) 17:12 Page 8 of 9 Based on the hospital statistics and population reports by Limitations the Australian Bureau of Statistics, omit ED presentation It is possible that the hospital admission for PND may be rates in NSW were estimated at 28.47% (person-year) over-enumerated, and thus the rate of PND overestimated, (2,007,864/7,053,755) in 2008–2009 [1, 13, 16]. The ED because admission could occur for medical reasons associ- presentation rate in Australia was estimated at 26.47% ated with the postnatal period [22, 23]. To minimise the (person-year) (5,742,139/21,691,653) in 2008–2009 [15, potential over-estimation of incidence rates, we included 16]. Australian hospital statistics for 2012–2013 show that only those admissions with a ‘principal’ diagnosis of de- there were more than 6.7 million ED presentations for the pressive disorder (i.e. the diagnosis primarily responsible period July 2012 to June 2013 [15]. The ED presentation for the admission). rate in Australia was lower than for the United States. An Unlike the NSW APDC, which has diagnoses coded overview of ED visits in the United States showed that by trained clinical information managers, the EDDC has there were approximately 421 visits to the ED for every substantial limitations in coding of diagnoses. The diag- 1,000 individuals in the population in 2011, and women noses in EDDC were recorded by medical, nursing or visited an ED 20% more often than men (458 versus 382 clerical personnel at the point of care. These personnel per 1,000 population) [17]. were not trained in clinical coding and the diagnoses In many countries, primary health care providers are were selected by keyword searching or tables of a limited experiencing an increased demand for Emergency Depart- set of diagnoses. The codes were assigned to the chosen ment (ED) services [15, 17]. In Australia, some studies diagnosis using tables built into the computer database have reported increases in estimates of between 2% and program. There are several different computer programs 4% in ED presentations in New South Wales (NSW) used in EDs. These programs use different classifications (2001–2011) [16], Western Australia (WA) (2006–2013) to record the diagnosis, including ICD-9-CM (Clinical [18] and Victoria (1999–2009) [19]. A recent study from Modification), ICD-10-AM (Australian Modification) or WA has predicted a 4.8% increase per annum in ED pre- SNOMED CT (the Systematized Nomenclature of Medi- sentations in the next five years [18]. However, there is cine – Clinical Terms) [24]. It is difficult to map and little literature on the ED presentation rates because of a group the diseases or symptoms because of the variation lack of accurate population data to use as the denomin- in computer programs and completeness of diagnoses. ator for the rate analysis. Data from women who have For example, some disease categories are not available in given birth provide a reliable means to calculate the ED some programs, but may be in others. A code commonly presentation rate in women who have given birth. recorded (2.85% of presentations with an ICD-10 diag- Our study also shows that the hospital admission rate nosis) was ‘Z53.8 – procedures not carried out for other for depression in the first year after birth in women reasons’. This may reflect workflow processes or the in- was 1.04% (95%CI = 0.99–1.09%). The rate was higher appropriateness of the use of ICD coding in this context. than in a previous study (0.49%) in NSW (2002–2004) The diagnoses for ED presentation were incomplete. [20]. The rate was also higher than in other countries, The records of only 89.28% of the ED presentations for example, Denmark [21]. A Danish population-based (45,519/50,982) included the diagnoses (ICD-9 or ICD- cohort study (1973–2005) showed that the rate of first- 10 or SNOMED). Of the ED presentations that included time hospital admissions for mental disorders was 0.6% the diagnoses, 60.25% (27,427) presentations had ICD-9 in the first month after birth [21]. The variation may be diagnoses; 23.48% (10,689) had SNOMED diagnoses and attributed to differences in study year and health ser- 16.26% (7,403) had ICD-10 diagnoses. The top 10 diag- vice accessibility. Our previous study showed that hos- noses for ICD-9, SNOMED and ICD-10 respectively are pital admission rates for psychiatric disorders in the described in Fig. 4. first year after birth increased significantly between Some predisposing factors for PND such as family 2001 and 2010, with a more marked increase from 2005 support and income were not available in the data. A (1.16% in 2001, 2.28% in 2010) [8]. contributing factor could have been a history of mental The strengths of this study are the size of the study health problems, however this was not assessed here. population and consecutive follow up of ED presenta- tions and hospital admissions for depression in the Conclusion first postpartum year. The large population size (over The presentation of women to an ED during pregnancy 154,000) women who gave birth for the first time, and was associated with a higher risk of admission to hos- who were followed up from pregnancy until the end of pital with a diagnosis of postnatal depression. The rea- the first year after birth, allowed us to examine the dis- sons for this need to be explored further in a future tributions of ED presentations over the period of preg- study. Clinicians should consider the association between nancy and hospital admissions for depression over the ED admission and a diagnosis of postnatal depression 1st year after birth. when planning a woman’s care.
Xu et al. BMC Emergency Medicine (2017) 17:12                                                                                                                  Page 9 of 9

Abbreviations                                                                        6.    Xu F, Hilder L, Austin MP, Sullivan EA. Data preparation techniques for a
APDC: Admitted Patients Data Collection; CHeReL: Centre for Health Record                  perinatal psychiatric study based on linked data. BMC Med Res Methodol.
Linkage; CI: confidence interval; ED: Emergency Department; EDDC: Emergency                2012;12(1):71.
Department Data Collection; ICD-10-AM: International Classification of Diseases      7.    National Centre for Classification in Health. The international statistical
and Related Health Problems 10th Revision Australian Modification; ICD-9-                  classification of diseases and related health problems, 10th revision,
CM: International Classification of Diseases and Related Health Problems, 9th              Australian modification (ICD-10-AM). Sydney: National Centre for
Revision, Clinical Modification; NHMRC: National Health and Medical Research               Classification in Health; 1999.
Councill; NSW: New South Wales; OR: Odds ratio; PDC: Perinatal Data Collection;      8.    Master Linkage Key (MLK) [www.cherel.org.au]
PDD: Postnatal depressive disorders; PND: Postnatal depression; RR: Relative risk;   9.    Australian Institute of Health and Welfare. Australian hospital statistics 2008–09.
SNOMED CT: Systematized Nomenclature of Medicine – Clinical Terms                          Health services series no. 17. Cat. no. HSE 84. Canberra: AIHW; 2010.
                                                                                     10.   Adhikari P. Socio-economic indexes for areas: introduction, use and future
Acknowledgements                                                                           directions, vol. 1351.0.55.015. Canberra: Australian Bureau of Statistics; 2006.
We would like to thank data custodians of the Ministry of Health and staff           11.   SPSS Software [http://www-01.ibm.com/software/analytics/spss/]
of the Centre for Health Record Linkage (CheReL) for providing the data,             12.   NHMRC National Health and Medical Research Council. Postnatal depression:
undertaking data linkage and providing advice. We acknowledge the                          A systematic review of published scientific literature to 1999. Canberra:
families who have contributed their data and professional staff involved                   Commonwealth of Australia; 2000.
in the data collection and management for this research.                             13.   Boyce PM. Risk factors for postnatal depression: a review and risk factors in
                                                                                           Australian populations. Arch Womens Ment Health. 2003;6 Suppl 2:S43–50.
Availability of data and materials                                                   14.   Abraham S, Taylor A, Conti J. Postnatal depression, eating, exercise, and
The datasets supporting the conclusions of this article will not be shared                 vomiting before and during pregnancy. Int J Eat Disord. 2001;29(4):482–7.
because the ethics approval for this study does not include the public               15.   Forero R, Mohsin M, Bauman AE, Ieraci S, Young L, Phung HN, Hillman KM,
data sharing.                                                                              McCarthy SM, Hugelmeyer CD. Access block in NSW hospitals, 1999–2001:
                                                                                           does the definition matter? Med J Aust. 2004;180(2):67–70.
Authors’ contributions                                                               16.   Leonard C, Bein KJ, Latt M, Muscatello D, Veillard AS, Dinh MM. Demand for
All authors participated in the study design and interpretation of data. FX                emergency department services in the elderly: an 11 year analysis of the
drafted the manuscript and conducted the data analysis. EAS, RF and CSEH                   Greater Sydney Area. Emerg Med Australasia. 2014;26(4):356–60.
have revised the manuscript critically for important intellectual content. The       17.   Australian Institute of Health and Welfare. Australian hospital statistics 2012–13.
final version of the manuscript was approved by all authors.                               Health services series no. 54. Cat. no. HSE 145. Canberra: AIHW; 2014.
                                                                                     18.   Mai Q, Aboagye-Sarfo P, Sanfilippo FM, Preen DB, Fatovich DM. Predicting
Competing interests                                                                        the number of emergency department presentations in Western Australia: A
The authors declare that they have no competing interests.                                 population-based time series analysis. Emerg Med Australasia. 2015;27(1):16–21.
                                                                                     19.   Lowthian J, Curtis A, Stoelwinder J, McNeil J, Cameron P. Emergency demand
Consent for publication                                                                    and repeat attendances by older patients. Intern Med J. 2013;43(5):554–60.
Not applicable.                                                                      20.   Xu F, Austin MP, Reilly N, Hilder L, Sullivan EA. Major depressive disorder in the
                                                                                           perinatal period: using data linkage to inform perinatal mental health policy.
Ethics approval and consent to participate                                                 Arch Womens Ment Health. 2012;15(5):333–41.
This study was approved by the NSW Population and Health Services                    21.   Munk-Olsen T, Laursen TM, Pedersen CB, Mors O, Mortensen PB. New
Research Ethics Committee and the Human Research Ethics Committee of                       parents and mental disorders: a population-based register study. JAMA.
the University of New South Wales and University of Technology Sydney,                     2006;296(21):2582–9.
Australia (reference number: 2011/06/328).                                           22.   Jones I, Heron J, Blackmore ER, Craddock N. Incidence of hospitalization
                                                                                           for postpartum psychotic and bipolar episodes. Arch Gen Psychiatry.
                                                                                           2008;65(3):356.
Publisher’s Note                                                                     23.   Matthey S, Ross-Hamid C. The validity of DSM symptoms for depression and
Springer Nature remains neutral with regard to jurisdictional claims in                    anxiety disorders during pregnancy. J Affect Disord. 2011;133(3):546–52.
published maps and institutional affiliations.                                       24.   Clinical Terminology [http://www.nehta.gov.au/get-started-with-ehealth/
                                                                                           what-is-ehealth/clinical-terminology].
Author details
1
 Faculty of Health, University of Technology Sydney, Ultimo 2007, Australia.
2
 Simpson Centre for Health Service Research, SWS Clinical School and
Ingham Institute for Applied Medical Research, University of New South
Wales, Liverpool, NSW 2017, Australia.

Received: 30 May 2016 Accepted: 11 March 2017

References
1. Almond P. Postnatal depression: A global public health perspective.
    Perspect Public Health. 2009;129(5):221–7.
2. World Health Organization. Mental health aspects of women’s reproductive                Submit your next manuscript to BioMed Central
    health : a global review of the literature. Geneva: WHO Library Cataloguing-           and we will help you at every step:
    in-Publication Data; 2009.
3. Xu F, Sullivan EA, Li Z, Burns L, Austin MP, Slade T. The increased trend in             • We accept pre-submission inquiries
    mothers’ hospital admissions for psychiatric disorders in the first year after          • Our selector tool helps you to find the most relevant journal
    birth between 2001 and 2010 in New South Wales. Australia BMC women’s
                                                                                            • We provide round the clock customer support
    health. 2014;14:119.
4. Woolhouse H, Gartland D, Perlen S, Donath S, Brown SJ. Physical health                   • Convenient online submission
    after childbirth and maternal depression in the first 12 months post partum:            • Thorough peer review
    results of an Australian nulliparous pregnancy cohort study. Midwifery.
                                                                                            • Inclusion in PubMed and all major indexing services
    2014;30(3):378–84.
5. Perlen S, Woolhouse H, Gartland D, Brown SJ. Maternal depression and                     • Maximum visibility for your research
    physical health problems in early pregnancy: findings of an Australian
    nulliparous pregnancy cohort study. Midwifery. 2013;29(3):233–9.                        Submit your manuscript at
                                                                                            www.biomedcentral.com/submit
You can also read