COVID-19 countermeasures, Major League Baseball, and the home field advantage: Simulating the 2020 season using logit regression and a neural ...
←
→
Page content transcription
If your browser does not render page correctly, please read the page content below
F1000Research 2020, 9:414 Last updated: 20 MAY 2020

RESEARCH ARTICLE
COVID-19 countermeasures, Major League Baseball, and the
home field advantage: Simulating the 2020 season using logit
regression and a neural network [version 1; peer review:
awaiting peer review]
Justin Ehrlich           1, Shankar Ghimire                2

1Department of Sport Analytics, Syracuse University, Syracuse, NY, 13244, USA
2Department of Economics and Decision Sciences, Western Illinois University, Macomb, IL, 61455, USA

     First published: 20 May 2020, 9:414                                            Open Peer Review
v1   https://doi.org/10.12688/f1000research.23694.1
     Latest published: 20 May 2020, 9:414                                           Reviewer Status AWAITING PEER REVIEW
     https://doi.org/10.12688/f1000research.23694.1
                                                                                    Any reports and responses or comments on the
Abstract
                                                                                    article can be found at the end of the article.
Background: In the wake of COVID-19, almost all major league sports
have been either cancelled or postponed. The sports industry suffered a
major blow with the uncertainty of sporting events being held in the near
future. Various scenarios of how and when sports might recommence have
been discussed. This paper examines various scenarios of how Major
League Baseball team performance is going to be impacted by the
presence of fans, or the lack thereof, in the context of physical distancing
and other COVID-19 countermeasures
Methods: The paper simulates, using a neural network and a logit
regression model, the win-loss probabilities for various scenarios under
consideration and also estimates the home effect for each team using data
for the 2017-2019 seasons.
Results: The model demonstrates that individual team home effect is
symmetric between home and away and teams will not necessarily have a
win or loss of any additional games in neutral stadiums, as teams with a
high home field effect will lose more neutral games that would have been at
home but will win more neutral games that would have been away.
However, the result of individual games will be different since home effect is
asymmetric between teams. Our simulation demonstrates that these
individual game differences may lead to a slight difference in Play-Off
Berths between a full season, a half season, or a full season without fans.
Conclusions: Without fans, any advantage (or disadvantage) from home
field advantage is removed. Our models and simulation demonstrate that
this will reduce the variance. This stabilizes the outcome based upon true
team talent, which we estimate will cause a larger divide between the best
and worst teams. This estimation helps decision makers understand how
individual team performance will be impacted as they prepare for the 2020
season under the new circumstances.

Keywords
MLB, Baseball, COVID-19, Neural Network, Logit

                                                                                                                                      Page 1 of 9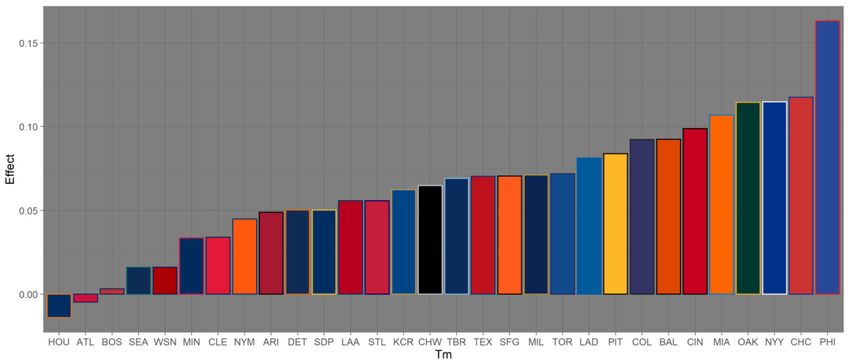
F1000Research 2020, 9:414 Last updated: 20 MAY 2020

Corresponding author: Justin Ehrlich (jaehrlic@syr.edu)
Author roles: Ehrlich J: Conceptualization, Data Curation, Formal Analysis, Funding Acquisition, Investigation, Methodology, Project
Administration, Resources, Software, Supervision, Validation, Visualization, Writing – Original Draft Preparation, Writing – Review & Editing;
Ghimire S: Formal Analysis, Investigation, Methodology, Validation, Writing – Original Draft Preparation, Writing – Review & Editing
Competing interests: No competing interests were disclosed.
Grant information: This work was supported by funds provided by the David B. Falk College of Sport and Human Dynamics, Syracuse University.
The funders had no role in study design, data collection and analysis, decision to publish, or preparation of the manuscript.
Copyright: © 2020 Ehrlich J and Ghimire S. This is an open access article distributed under the terms of the Creative Commons Attribution
License, which permits unrestricted use, distribution, and reproduction in any medium, provided the original work is properly cited.
How to cite this article: Ehrlich J and Ghimire S. COVID-19 countermeasures, Major League Baseball, and the home field advantage:
Simulating the 2020 season using logit regression and a neural network [version 1; peer review: awaiting peer review] F1000Research
2020, 9:414 https://doi.org/10.12688/f1000research.23694.1
First published: 20 May 2020, 9:414 https://doi.org/10.12688/f1000research.23694.1

                                                                                                                                             Page 2 of 9
F1000Research 2020, 9:414 Last updated: 20 MAY 2020
Introduction Advanced Media’s Baseball Savant Website using the Python
The 2019–2020 pandemic from the novel coronavirus package PyBaseball 1.0.4 (LeDoux, 2017/2020). The data
(COVID-19) has brought unprecedented countermeasures to every shows that out of the 7,290 home games played during the
sector of the economy, including individuals, groups, institu- 2017–2019 seasons, 3,881 (53.237%) resulted in wins and the
tions, and industries. The sports industry took one of the biggest remaining 3,409 (46.763%) resulted in a loss. Next, we seek
hits, with all major leagues in the U.S. cancelling or halting their to quantify the HFA’s role in this difference.
events. While these actions were necessary to address the public
health concern, each segment is now floating various proposals Calculating home advantage
to resume operations and give some relief to the significant There are various techniques to calculate the home advan-
portion of the economy that the sports industry comprises. tage depending on the sport, gender, league, and the nature
of scoring (Jones, 2015). Pollard et al. (2017) use a general lin-
Major League Baseball (MLB) is likely to be the first ear model to fit the home advantage. However, because we
American professional sporting league to resume, probably in have a categorical variable of win or lose, we need to follow
May or June (Passan, 2020). Players are willing (although not a non-linear approach. To test the hypothesis that teams have
all players agree to the method), the League is willing, the home-field advantage, we apply a logit regression model to pre-
Arizona government is willing, and health professionals have dict the probability of winning as a function of home game
approved a plan to move forward, known as the Arizona Plan. dummy, team fixed effects, opponent fixed effects, and the
This plan calls for players, coaches, and staff to be quarantined win-loss records. We estimate the following regression equation:
in hotels around the Phoenix area, and to play in empty ballparks
that include the ten Cactus League Spring Training parks, Chase Wini = αi + α1 Homei + α2 Teami + α3 Home × Teami + α3 Home × Oppi + ηZi + εi (1)
Field, and other Phoenix ballparks. One interesting aspect
of this arrangement is that the stadium size will not matter where Wini is a dummy variable that takes the value 1 if the
because there will not be any fans. This will be an opportunity recorded game resulted in a win for the team-opponent pair,
for MLB to get back into the spotlight and accumulate massive and zero otherwise; Homei accounts for home game; and Teami
television viewership that MLB has not seen in decades. The controls for the individual team fixed effects, and Oppi con-
experience will be completely optimized for TV viewing, and trols for the opponent fixed effects, Zi represents the win-loss
so the league will finally be able to experiment with proposed percentage for the team as well as the opponent, εi stands for
rule changes, including removing mound visits to make the the error term. The HFA is calculated accounting for the team
game go faster, adding a Robo Umpire, which has already fixed effects as well as the opponent fixed effects by interact-
been successfully tested last season via a partnership with the ing home with team and opponent separately. We run the logit
independent Atlantic League (Bogage, 2019), and an expanded model on all the data, with Home=1 for the home team and equal
roster giving players more rest due to the extremely hot to zero for the travelling team. Doing so separates the team fixed
temperatures of Phoenix. While all of this will alter predic- effects and home field advantage. The model in Equation 1 is
tions on who’s going to the playoffs, probably the biggest used to estimate both the win probability and the HFA per
impact that this plan will have on the games is the lack of the team. The HFA is obtained by calculating the marginal
home field advantage (HFA): the advantage that the home team effect (ME) of Home on the win probability for each team
has over the visiting team due to the home team having fans, separately.
the familiarity of the home team to their own ball park, and the
away team having to travel. Development of the neural network model
A neural network model was also created to act as a robust-
Baseball has been shown in previous studies to be less suscepti- ness check for the logit win prediction model. The software to
ble to the HFA effect than other professional sports (Edwards & train the model is hosted on GitHub (Ehrlich, 2020a). We
Archambault, 1979; Gómez et al., 2011; Pollard et al., 2017). used the R package nnet 7.3–14 (Ripley & Venables, 2020) for
Despite this, there is a measurable home field advantage in base- the neural network platform, and trained and tuned the model
ball, as shown by Jones (2015); Jones (2018). Building on this, with the R package caret 6.0–86 (Kuhn et al., 2020). We
we extend the analysis for the MLB under uncertainty of which developed a simulator to estimate what might happen if: 1) The
scenario the League will be following for the 2020 season. full 2020 season continued on in a parallel universe devoid of
In particular, we simulate the win-loss probabilities for three COVID-19; 2) MLB waits and is able to return and play half a
different scenarios as well as estimate the home advantage for season to packed stadiums around the All Star Break, which is
each team using the past three seasons’ data. This estimation assuming an extremely optimistic timeline of a return to normal
helps us understand how individual team performance is going life; 3) a full season is played without fans, which is likely
to be impacted as they prepare for the 2020 season in the new the only way they will be able to play this season (i.e., the
circumstances. Arizona Plan). The simulation was executed 100 times, and the
logit win prediction model was used as the basis for predicting
Methods each win. A random number between 0 and 1 was generated and
Data sources checked against the win probability provided by the model.
We use the MLB 2017–2019 season data for the 30 teams rep- If the random number was below the probability, then the team
resented in the league. The data were obtained from the MLB won, otherwise the team lost.
Page 3 of 9F1000Research 2020, 9:414 Last updated: 20 MAY 2020
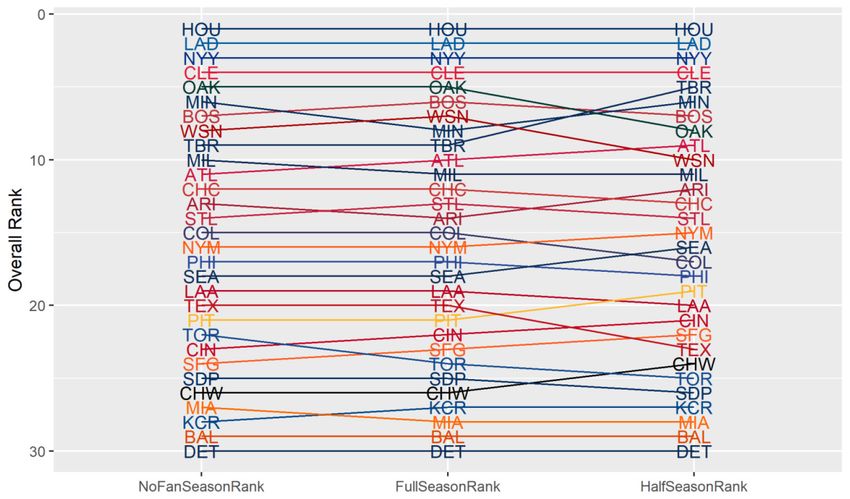
Results Figure 2, while the divisional results shown in Table 3. Table 4
The summary statistics of the training data is contained in provides statistics calculated during each season and averaged.
Table 1. The logit results from Equation 1, without the fixed This includes the correlation between the full season and the
effects, are reported in Table 2. Both log odds ratios and the half and no-fan seasons using both the overall rankings and
MEs are reported in this table. The results show that the indi- the win-loss percent (WL%). The full seasons rank correlations
vidual regressors included in the model show plausible impacts. are higher with the no-fans seasons (0.825) than the half sea-
Looking at the log-odds ratios, home games and the home team’s sons (0.735). The correlations using WL% is similar. The stand-
previous win-loss percentage (WL%) are more likely to result ard deviation of the predicted win probabilities is lower for the
in a win but the opponent’s WL% is less likely to result a loss no-fans seasons (0.073) than the full (0.085) and half sea-
for the home team. These results support the presence of the sons (0.085). The home effect was correlated with the win
HFA. The right half of the table shows the MEs for each varia- probabilities’ standard deviations and is negative for the no fans
ble. We are mainly interested in the MEe for the Home variable, seasons (-0.221). In other words, the higher the home effect, the
which is 0.064. This means, the marginal probability of winning a lower the variance.
game at home versus away field goes up by 6.4%. This is
the average HFA for all of the teams as a whole. The HFA for This neural network was also used as the win predictor in
each team is presented in Figure 1. In our sample, PHI seems to 100 simulations and the results are very similar to the logit win
have the highest home advantage and HOU seems to have the prediction model, which shows robustness in the simulation
lowest (negative, in fact) home advantage. results. Table 4 shows the statistical results of both models.
The correlation and standard deviation differences are approxi-
The model was trained using the 2017–2019 MLB regular sea- mately the same between the two models.
son games. The schedule for the 2020 season was estimated
using the schedule from the 2019 season. While the dates will The results of the simulations are available as Extended data
be off slightly, the team pairings will be nearly the same. The (Ehrlich, 2020b) and the code necessary for replicating the
wins and losses of the 100 simulations were added to form the results, including training the models, are hosted on GitHub
result of the 2020 season. The overall results are visualized in (Ehrlich, 2020a).
Table 1. Summary statistics used for training the model.
Variable Mean SD Min Median Max
Home 0.500 0.500 0.000 0.500 1.000
Prev WL % 0.500 0.114 0.000 0.500 1.000
PrevWL% Opp 0.500 0.114 0.000 0.500 1.000
Season 2018.000 0.816 2017.000 2018.000 2019.000
Table 2. Results of regression analysis.
Logit win prediction model Logit win prediction
marginal effects
Predictors Odds ratios Std. error p AME Std. error p
(Intercept) 0.876 0.174 0.447
Home 1.304 0.034F1000Research 2020, 9:414 Last updated: 20 MAY 2020
Figure 1. MLB home field advantage effect of individual teams.
Figure 2. MLB season 2020 change in simulated rank after 100 simulations.
Page 5 of 9F1000Research 2020, 9:414 Last updated: 20 MAY 2020
Table 3. Results of the simulation using the logit win prediction model.
No fan Full Half
season season season
Home
Division Tm Rank Berth WL% Rank Berth WL% Rank Berth WL% effect
AL Central CLE 1 y 0.593 1 y 0.587 1 y 0.584 0.034
AL Central MIN 2 w 0.573 2 0.565 2 w 0.572 0.033
AL Central CHW 3 0.419 3 0.414 3 0.425 0.065
AL Central KCR 4 0.390 4 0.397 4 0.402 0.062
AL Central DET 5 0.337 5 0.340 5 0.341 0.050
AL East NYY 1 y 0.623 1 y 0.614 1 y 0.607 0.115
AL East BOS 2 0.569 2 w 0.573 3 0.568 0.003
AL East TBR 3 0.567 3 0.564 2 w 0.582 0.069
AL East TOR 4 0.438 4 0.435 4 0.408 0.072
AL East BAL 5 0.347 5 0.349 5 0.357 0.092
AL West HOU 1 y 0.653 1 y 0.650 1 y 0.657 -0.014
AL West OAK 2 w 0.580 2 w 0.576 2 0.566 0.115
AL West SEA 3 0.473 3 0.468 3 0.491 0.016
AL West LAA 4 0.469 4 0.467 4 0.462 0.056
AL West TEX 5 0.463 5 0.454 5 0.436 0.070
NL Central MIL 1 y 0.565 1 y 0.555 1 y 0.553 0.071
NL Central CHC 2 w 0.544 2 w 0.545 2 0.550 0.118
NL Central STL 3 0.534 3 0.542 3 0.544 0.056
NL Central PIT 4 0.450 4 0.451 4 0.464 0.084
NL Central CIN 5 0.437 5 0.445 5 0.440 0.099
NL East WSN 1 y 0.569 1 y 0.565 2 w 0.556 0.016
NL East ATL 2 w 0.559 2 w 0.559 1 y 0.558 -0.005
NL East NYM 3 0.494 3 0.485 3 0.505 0.045
NL East PHI 4 0.475 4 0.477 4 0.479 0.163
NL East MIA 5 0.394 5 0.393 5 0.392 0.107
NL West LAD 1 y 0.632 1 y 0.632 1 y 0.634 0.081
NL West ARI 2 0.540 2 0.539 2 w 0.553 0.049
NL West COL 3 0.500 3 0.499 3 0.488 0.092
NL West SFG 4 0.437 4 0.441 4 0.437 0.071
NL West SDP 5 0.432 5 0.423 5 0.402 0.050
Page 6 of 9F1000Research 2020, 9:414 Last updated: 20 MAY 2020
Table 4. Key summary statistics of the simulation using will be less variance in the win probability between any two
the logit win prediction model. teams, which we estimate will cause a larger divide between the
best and worst teams. In conclusion, we believe that the results
Model simulated Logit NN of the Arizona Plan will be similar to a regular season with
Simulated Seasons 100 100 fans, and that the teams’ standings at the end of the regular
season will be more predictable than a normal season.
Full-NoFans Rank Correlation 0.825 0.814
Full-Half Rank Correlation 0.735 0.719
Data availability
Full-NoFans WL% Correlation 0.823 0.817 Source data
Full-Half WL% Correlation 0.734 0.718 Zenodo: Syracuse-University-Sport-Analytics/MLBCovid19.
NoFans WL% SD 0.073 0.073 https://doi.org/10.5281/zenodo.3775959 (Ehrlich, 2020a).
Full WL% SD 0.085 0.086
This project contains the following source data files:
Half WL% SD 0.085 0.086
Full WinProb SD-HomeEffect Correlation 0.361 0.251
• d ata/2008_2019Games.csv. (Input data scraped using the
scrapingMLB.ipynb.)
NoFans WinProb SD – HomeEffect -0.221 -0.268
Correlation • d ata/divisions.csv. (Input team division data for grouping
by division.)
Note: These statistics are calculated for each season and averaged.
WL% is predicted based upon the Win Prediction. • d ata/mlbTeamColors.csv. (Input team colors for the
visualizations.)
Discussion
Source data are also available on GitHub: https://github.com/
Based on the above results, since the team-home effect is
Syracuse-University-Sport-Analytics/MLBCovid19.
symmetric between home and away, teams will not necessar-
ily win or lose any additional games in neutral stadiums as teams
Extended data
with a high home field effect will lose more neutral games that
Harvard Dataverse: Replication Data for: COVID-19 Counter-
would have been at home but will win more neutral games that
measures, Major League Baseball, and the Home Field Advantage.
would have been away. The greater the home-team ME, the
https://doi.org/10.7910/DVN/OOMWSD (Ehrlich, 2020b).
less variance there will in of the predicted win probabilities.
To verify this assumption, we calculated the correlation of
HomeEffects and the standard deviation (SD) of win probabili- This project contains the following extended data files:
ties between a full (0.361) and no-fan season (-0.221). Since • d ivisionRankings. (Results of simulation using the logit
the home effect is symmetric for each team (the away field dis- model.)
advantage = -the home field advantage), decreasing the vari-
• d ivisionRankingsNN. (Results of simulation using the
ance does not affect the overall expected WL% for each team.
neural network model.)
However, the result of individual games will be different
since home effect is asymmetric between teams. For example, • h omeEffectLogit. (Team home effects using the logit
if the Cubs (highest home effect in the NL Central) plays the model.)
Cardinals (lowest home effect in the NL Central), the Cubs • h omeEffectNN. (Team home effects using the neural
will have a larger advantage playing at home then the Cardinals network model.)
will have playing at home (besides team fixed effects). These
differences are removed with the No-Fan scenario and the • m
odelCorrelationsSummaryWithNNResults. (Simulation
outcome will be solely based upon the talent of the teams. statistics from both the logit and neural network models.)
However, on average there only a slight change of overall
WL% (or playoff berth), just the SD of the results (see Table 3). Zenodo: Syracuse-University-Sport-Analytics/MLBCovid19.
Without fans, any advantage (or disadvantage) from home field https://doi.org/10.5281/zenodo.3775959 (Ehrlich, 2020a).
advantage, which cause higher levels of variance, is removed.
This stabilizes the outcome based upon true team talent. This project contains the following source files:
As fewer games have been played, the half-season will have • p ythonStatcastScraper/scrapingMLB.ipynb. (Python Jupiter
more upsets, but the SD is close to the same as the full season. Notebook code for scraping Statcast.)
• h alfSeasonPrediction.Rmd. (R Markdown Notebook
Conclusion
code for developing the logit and neural network models.
This paper analyzes the previous season MLB data to
Also contains the code for running the simulations.)
estimate the win-loss probabilities for the 2020 season for each
of the 30 teams in the League using logit regressions and a • A
ll the other data is intermediate output from the simu-
neural network. The Arizona Plan’s neutralization of HFA lations. The important output files are located in the
would not significantly affect the overall outcome of the season. above Harvard Dataverse repository.
In fact, our model predicts that the Arizona Plan season will
produce season results that are based more on the true talent Source code is also available on GitHub: https://github.com/
of the teams. Further, our simulation demonstrates that there Syracuse-University-Sport-Analytics/MLBCovid19.
Page 7 of 9F1000Research 2020, 9:414 Last updated: 20 MAY 2020
Mixed data and code hosted on GitHub and Zenodo are Data hosted on Harvard Dataverse are available under the
available under the terms of the GNU General Public License terms of the Creative Commons Zero “No rights reserved” data
v3.0. waiver (CC0 1.0 Public domain dedication).
References
Bogage J: National Baseball Hall of Fame accepts Atlantic League ‘robo ump’. 2015; 121(3): 791–804.
items. Washington Post. 2019. PubMed Abstract | Publisher Full Text
Reference Source Jones MB: Differences in home advantage between sports. Psychol Sport Exerc.
Edwards J, Archambault D: The home field advantage. Sports, games, and play: 2018; 34: 61–69.
Social and psychological viewpoints. 1979; 409–438. Publisher Full Text
Reference Source Kuhn M, Wing J, Weston S, et al.: caret: Classification and Regression Training
Ehrlich J: Syracuse-University-Sport-Analytics/MLBCovid19: First Release (Version 6.0-86) [Computer software]. 2020.
(Version v1.0.0). Zenodo. 2020a. Reference Source
http://www.doi.org/10.5281/zenodo.3775959 LeDoux J: Jldbc/pybaseball [Python]. 2020; (Original work published 2017).
Ehrlich J: Replication Data for: COVID-19 Countermeasures, Major League Reference Source
Baseball, and the Home Field Advantage. Harvard Dataverse, V1, UNF:6: Passan J: Sources: MLB, players eye May return in Arizona. ESPN.Com. 2020.
LiInpTKr15iER0wC31Bb9g== [fileUNF]. 2020b. Reference Source
http://www.doi.org/10.7910/DVN/OOMWSD
Pollard R, Prieto J, Gómez MÁ: Global differences in home advantage by
Gómez MA, Pollard R, Luis-Pascual JC: Comparison of the home advantage in country, sport and sex. Int J Perform Anal Sport. 2017; 17(4): 586–599.
nine different professional team sports in Spain. Perceptual and motor skills. Publisher Full Text
2011; 113(1): 150–156. Ripley B, Venables W: nnet: Feed-Forward Neural Networks and Multinomial
PubMed Abstract | Publisher Full Text Log-Linear Models (Version 7.3-14) [Computer software]. 2020;
Jones MB: The home advantage in major league baseball. Percept Mot Skills. Reference Source
Page 8 of 9F1000Research 2020, 9:414 Last updated: 20 MAY 2020
The benefits of publishing with F1000Research:
Your article is published within days, with no editorial bias
You can publish traditional articles, null/negative results, case reports, data notes and more
The peer review process is transparent and collaborative
Your article is indexed in PubMed after passing peer review
Dedicated customer support at every stage
For pre-submission enquiries, contact research@f1000.com
Page 9 of 9You can also read