The Dynamics of Stock Price Change Motion Effected by Covid-19 Pandemic and the Stock Price Prediction Using Multi-layered Neural Network - ITS
←
→
Page content transcription
If your browser does not render page correctly, please read the page content below
INTERNATIONAL JOURNAL OF COMPUTING SCIENCE AND APPLIED MATHEMATICS, VOL. 7, NO. 1, FEBRUARY 2021                                               8

   The Dynamics of Stock Price Change Motion
Effected by Covid-19 Pandemic and the Stock Price
  Prediction Using Multi-layered Neural Network
                                    Zani A. Rafsanjani, Devi Nurtiyasari and Angga Syahputra

   Abstract—In this paper, we work on the analysis of dynamical               differential equation to examine the fall in market value of
change on stock price during Covid-19 pandemic using nonlinear                commodity price. Thus, the differential equation is adopted to
deterministic motion equation. The model is given by the second-              the case of stock price. In this work, we use the Indonesian
order differential equation with constant coefficient over time
with some consideration under stock market structure. This coef-              Composite Stock Price Index (IHSG) and Waskita Karya
ficient shows the rate of change of stock price throughout Covid-             Company stock price. The fall in stocks price is analyzed using
19. Thus, the Least Square estimator is derived to determine the              the second-order differential equation such as described on
constant factor. Further, we conduct the Multi-layered Neural                 [2], [3], [4] under some consideration. Further, we estimate
Network algorithm to predict the future stock price. To provide               the coefficient in the solution of second-order differential
accurate forecasting results, the algorithm used in this paper
has to be able to recognize stock price data pattern which has                equation using Least Square estimation parameter. The work
dynamic characteristics. Multi-layered Neural Network solve the               on parameter estimation can be seen on [5].
data with dynamic characteristics by using more than one hidden                  Forecasting time series data using the classical model re-
layer. The input layers of this network are not directly connected            quires several assumptions such as the assumption of sta-
to the output layers of the network. Therefore, this algorithm                tionarity and the assumption of linearity. If the stationarity
is expected to provide accurate forecasting results. We use the
Jakarta Composite Stock Price Index (IHSG) and Waskita Karya                  assumptions are not satisfied, the time series data should be
Company stock price’s data for the subject of observation.                    transformed [6]. The Multi-Layered Neural Network model
                                                                              does not require stationary assumptions because the model to
  Index Terms—Stock price, differential equation, neural net-
work.                                                                         be built has the ability to adapt well to recognize data patterns.
                                                                              Furthermore, stock price data has a non-linear pattern, be-
                                                                              cause the data fluctuates. The existence of non-linear patterns
                         I. I NTRODUCTION
                                                                              indicates that the linear model will not be good enough for
     TOCK is one of the most popular financial instrument
S    among investors since it gives a number of financial
benefits. When the stock prices are on the bullish position,
                                                                              modeling and forecasting data, so that the non-linear Multi-
                                                                              Layered Neural Network model is expected to provide good
                                                                              forecasting results.
the profits are also high. However, the stock prices are also                    In the previous study, [7] is discussing the depreciation
very volatile which is influenced by supply and demand flows.                 model for Cacao and Cars commodity using the second-
Therefore, at a certain time the stock has decreased in price                 order differential equation. It also discusses to expect the
due to several factors. The main factors changing stock prices                parameter on the solution of the depreciation model using
are discussed in [1]. In the global issue of corona viruses,                  Linear Quadratic Estimator. Thus, the magnitude of the de-
the Covid-19 pandemic is currently in the midst of a global                   preciation value of the commodities can be obtained. Further,
economy that has resulted in significant changes in demand                    this method is applied to the change of stock prices to analyze
and supply of shares. This causes the Global Stock Price Index                its behaviour.
to decline and have an impact on a significant price decline
in the stock market.                                                                            II. L ITERATURE R EVIEW
   The significant change of stock is a concern for some                      A. Stock Market during Covid-19 Pandemic
researchers to find the common trend of the Covid-19 pan-                        Shares are a proof of ownership of the assets of companies
demic impact to the stock price. In this paper, we study the                  that issue shares [8]. Investment in the form of shares, or
stock price change trend during this pandemic with differential               commonly referred to as stock investments is the purchase or
equation approach. In [2], [3], [4] describe the possible use of              inclusion or ownership of shares of other companies for the
   Z. A. Rafsanjani is with the Mathematics Department of Ahmad Dahlan        purpose of obtaining profits and others [9]. Share price is the
University, Yogyakarta 55166, Indonesia e-mail: zani.anjani@math.uad.ac.id.   value of a stock that reflects the wealth of the company that
   D. Nurtiyasari is with UIN Sunan Kalijaga, Yogyakarta, Indonesia. She      issued the stock, where changes or fluctuations are determined
is now a lecturer in UIN Sunan Kalijaga, Yogyakarta, Indonesia e-mail:
devi.nurtiyasari@uin-suka.ac.id.                                              by the strength of demand and supply that occurs in the stock
   A. Syahputra is with the Economic and Islamic Business Faculty, Institut   market (secondary market). The more investors who want to
Agama Islam Negeri Lhokseumawe, Lhokseumawe, 24352 Indonesia, He              buy or save shares, the price goes up. Conversely, the more
is now a Lecturer on IAIN Lhokseumawe, Indonesia e-mail: anggasyahpu-
tra@iainlhokseumawe.ac.id.                                                    investors who want to sell or release a stock, the more the
   Manuscript received June 26, 2020; accepted December 14, 2020.             price moves down [10].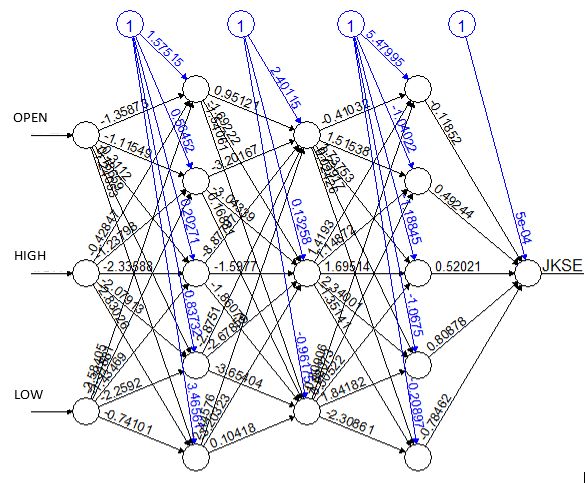
INTERNATIONAL JOURNAL OF COMPUTING SCIENCE AND APPLIED MATHEMATICS, VOL. 7, NO. 1, FEBRUARY 2021                                       9

   In the implementation of a country’s national economic de-        homogeneous linear equation where the right hand of (1) is
velopment, financing is needed from both the government and          given by S(x) = 0. Then the second case is given by S(x) 6= 0
the community. The capital market is one alternative source of       such that (1) can be expressed as non homogeneous differential
funding for both the government and the private sector [11].         equation.
The world economy, including Indonesia, is inseparable from             In the practical use of (1), it given an initial value problem
the capital market [12], in which there are traded shares that       to find the output solution y of the differential equation which
help support the economy.                                            satisfying boundary conditions y(x0 ) = y0 and y(x1 ) = y1 .
   Covid-19 has dealt a major blow to the Indonesian economy.        In contrast with the initial value problems, the boundary value
The Indonesian Stock Exchange’s stock index fell 33 percent          problem does not always have a solution.
compared to early 2020, which is the worst since 2015. The
exchange rate of the rupiah against the US dollar fell to the        C. Linear Least Square Estimation
level of 16,273, that is the lowest since June 1998. Foreign
                                                                        In the purpose of multi responses linear regression model,
investors in the money market and capital market continue
                                                                     Linear least squares estimation can be used to predict param-
to withdraw funds from the Indonesian market. This situation
                                                                     eters. First, we assumed that there are N measurements for
will not stop because the corona outbreak in Indonesia is still
                                                                     output vector yi ; i = 1, 2, . . . , N with m-dimensional output
widespread. Cases and victims of Covid-19 also continue to
                                                                     [5]. Further, the parameter can be estimated by minimizing the
grow [12].
                                                                     objective function of least squares which is shown by
   Covid-19 has an impact on all financial markets around the
world in a certain share. Trends in stock prices have dropped                                  N
                                                                                               X
significantly and continuously. Even Dow Jones and S&P                            S(k) =         [ŷi − Xi k]T Qi [ŷi − Xi k]       (2)
experienced a decline in share prices in various US companies                                  i=1

by 20% [13].                                                           Using the stationary criteria, yields a linear form
   Investor’s sentiments influence the stock markets signifi-                            N                      N
cantly. When the market is trending upwards and there is less
                                                                                         X                      X
                                                                                     [         xTi Qi xi ]k =         xTi Qi ŷi ,
perceived risk then investor behaves more optimistically. When                           i=1                    i=1
the market is trending downwards then investors’ sentiments
                                                                       such that the optimal parameter estimation can be obtained
become relatively pessimistic and investors will tend to wait
                                                                     as follows
to enter the market until a revival begins [14]. Another thing                        "N            #−1 " N          #
that also influenced investors’ policy in making decisions at                     ∗
                                                                                       X
                                                                                               T
                                                                                                         X
                                                                                                                 T
the Covid-19 was news in the media. The more news related                       k =        xi xi Qi         xi ŷi Qi .
                                                                                          i=1                     i=1
to unexpected things, the greater the number of shares that
investors will release [15], [16], [17].
   Covid-19 pandemic has a significant negative effect on stock      D. Multi-Layered Neural Network
market price returns in all affected countries and regions.              Neural network is an algorithm that is inspired by the
Covid-19 has a significant side effect on the performance of         working of neurons in the human brain. Each neuron will
major stock indexes in Asian stock markets, where stocks             transmit information and connected to each synopsis. The
experience abnormally larger declines. This is due to investor       simplest type of neural network is Single-layered Neural
sentiment of being a mediator and complete transmission              Network. There is no hidden layer in the architecture and the
channel for the effects of the Covid-19 plague on the stock          input layer is directly connected to the output layer. Single-
market. Current stock prices are a picture of potential fu-          layered Neural Network is an advanced feed network or feed
ture earnings, and investors see the Covid-19 pandemic very          forward [21], whereas a multi-layer neural network is a neural
disturbing economic activity and its effects are so alarming.        network that contains at least one input layer, one hidden layer,
Before something worse happens, a reasonable step taken by           and one output layer. The input layer will receive input data
investors is to sell shares [18].                                    and send the weighted input to the output layer via the hidden
   In line with the above research, Liu also believes that           layer.
currently, it is estimated that stock price trends are still very        Each Multi-layered Neural Network neuron is associated
volatile. There is still a room for stock prices to continue to      with linear or non-linear function, called activation function.
decline. Selling shares at this time is a profitable step until we   It is converting the input signal into an output signal which will
get a more stable market signal [19].                                be sent to another unit [22]. Activation functions that can be
                                                                     used as Multi-Layered Neural Network activators are divided
B. Second-order Differential Equations                               into 2 types, i.e. linear activation functions and nonlinear
                                                                     activation function. In the linear activation functions showed
  The second order linear differential equation can be shown         by Fig. 1, the output value is the same as the input value. It
as the form                                                          is formulated as follows.
                 d2 y        dy
           P (x) 2 + Q(x)        + R(x)y = S(x)            (1)                                       f (x) = x                       (3)
                 dx          dx
where P , Q, R and S are continuous functions. Further, it can         The complexity and variety of the data, as the neural
be divided into two different cases [20]. First, the so called       network input, usually does not match using linear activation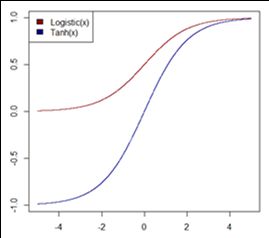
INTERNATIONAL JOURNAL OF COMPUTING SCIENCE AND APPLIED MATHEMATICS, VOL. 7, NO. 1, FEBRUARY 2021                                   10

                                                                      The stock price change over time t can be described as
                                                                    a dynamical movement. This gave by the continuous second
                                                                    order time varying differential equation. The acceleration
                                                                    of stock price movements equal to the rate of stock price
                                                                    movements which can be stated by the equation below
                                                                                         d2 S(t)    dS(t)
                                                                                                 +α         = 0,                  (6)
                                                                                           dt2         dt
                                                                    where S(t) is the stock price at time t for t ∈ (t0 , tN ) and α
                                                                    represents the stock price movement coefficient.
                                                                       In this case, we assumed that there is a lot of buyers and
                                                                    sellers in the market, where each of them has a good knowl-
                                                                    edge about the market information and we cannot influence
Fig. 1. Linear activation function.                                 the market about the stock prices.
                                                                       The solution of (3) with the given initial condition S(t0 ) =
                                                                    S0 and dS(tdt
                                                                                  0)
                                                                                     = v0 can be written as
                                                                                     S(t) = S(0) + β(1 − eα(t−t0 ) ),             (7)
                                                                                v0
                                                                    where β =   α.
                                                                       In this discussion, we take The Jakarta Composite Stock
                                                                    Price Index (IHSG) and Waskita Karya Company stock price
                                                                    which showed a sharp decline in national stock prices since
                                                                    March to June 2020. The stock prices experienced uncer-
                                                                    tain changes due to market sentiment towards the pandemic.
                                                                    Hence, the study of dynamics changing stock prices model
                                                                    can be applied for this case. Further discussion is given in the
                                                                    following sub-section.

                                                                    A. Dynamical Analysis of Jakarta Composite Stock Price
Fig. 2. Logistic and tanh activation function.
                                                                    Index (IHSG)
                                                                       The magnitude of stock price changes has dynamic prop-
function. Therefore, the nonlinear activation function is widely    erties. It also has a relationship with the acceleration rate of
used as activation function in neural network. One of the           price changes that is described by (6) which can be rewritten
nonlinear activation functions is logistic activation function      as
[23]. It is mathematically defined as follows                                        d2 S IH (t)       dS IH (t)
                                                                                           2
                                                                                                 + αIH           = 0,            (8)
                                    1                                                    dt               dt
                            f (x) =                           (4)   where IH-indexes represents the stock price for IHSG at time
                                 1 + e−x
                                                                    t and αIH work as coefficient movement of IHSG stock price
   Another nonlinear activation function is tanh activation         magnitude. Then the solution of (5) can be given by
function. It is similar to the logistic activation function. The                                               IH
difference is in the range of output values, which can be seen                 S IH (t) = S0IH + β IH (1 − eα       (t−t0 )
                                                                                                                              )
on Fig. 1. The output value of logistic activation function
                                                                    As for analytical purposes, we take IHSG stock price data
ranges between 0 and 1, while the output value of tanh
                                                                    from investing.com starts from March 2nd to June 19th, 2020.
activation functions ranges between -1 and 1. Tanh activation
                                                                    Thus, the data is drawn in Fig. 3. Figure 3 showed that IHSG
function is formulated as follows
                                                                    prices keep decreasing and it is softly increasing at the end
                                 1 − e−x                            of July 2020. Thus, the magnitude of price changes is drawn
                        f (x) =                               (5)
                                 1 + e−x                            in Fig. 4. Therefore, we can determine the analytical solution
                                                                    of (8) using initial magnitude v0 that is about -1.28%. Hence,
  III. DYNAMICAL C HANGE ON S TOCK P RICE D URING                   from the data above, the solution of (8) can be written as
 C OVID -19 PANDEMIC A NALYSIS USING S ECOND -O RDER                                              −1.28          IH

               D IFFERENTIAL E QUATIONS                                      S IH (t) = −1.25 + IH (1 − eα (t−t0 ) ).
                                                                                                   α
   In the middle of Covid-19 pandemic, as stated before that           Further, to analyze IHSG stock price behaviour, (2) is
the global economy has decline in all fields. One of the            applied to approximate coefficient magnitude αIH . The result
economic instruments effected by this pandemic is stock price.      is, we get the approximation coefficient αIH about 15.65%.
There is a significant change to the price compared with the        Therefore, IHSG stock price along Covid-19 pandemic is given
price before pandemic. By this observation, we need to analyze      by
the stock price movement.                                                    S IH (t) = −1.25 − 0.00082(1 − e15.65(t−t0 ) )    (9)
INTERNATIONAL JOURNAL OF COMPUTING SCIENCE AND APPLIED MATHEMATICS, VOL. 7, NO. 1, FEBRUARY 2021 11
Fig. 3. IHSG Stock Price from March until June 2020. Fig. 6. Waskita Karya Company Stock Price.
Fig. 4. The magnitude of IHSG price movements. Fig. 7. The magnitude of Waskita Karya price.
where WK indices figure out Waskita Karya Company stock
over time t and the coefficient αW K represents the movement
coefficient. Solving (10) we have dynamical stock price model
as below
WK
S W K (t) = S0W K + β W K (1 − eα (t−t0 )
)
In this section, the stock price data of Waskita Karya
Company was taken from investing.com. The data is shown
in Fig. 6.
Figure 6 indicates that Waskita Karya stock price decreases
since March 2020 effected by Covid-19 pandemic. Moreover,
Fig. 5. IHSG stock price analysis. the magnitude of stock price changes can be obtained from
Fig. 6 which is expressed in Fig. 7
Using the data and the form on (8) with the initial magnitude
In the Fig. 5 above, by using Linear quadratic estimator,
v0 = −0.67, Waskita Karya stock price at time t can be
we can analyze that during Covid-19 pandemic, IHSG stock
obtained as
prices fall in under Rp. 4000,00 per share. Although, using
this model approximation, IHSG stock price is predicted to 0.67 WK
S W K (t) = −1.97 − (1 − eα (t−t0 ) ) (11)
rebound at the end of June 2020. αW K
The magnitude coefficient αW K can be obtained by esti-
B. Dynamical Analysis of Waskita Karya Company Stock mating (11) using (2). Therefore, we got αW K = 0.1147 and
Price the stock price on (11) can be written as
The stock price changes of Waskita Karya Company can S W K (t) = −1.97 − 5.84(1 − e11.47(t−t0 ) )
be explained by second order differential equation in the re-
lationship between its magnitude and acceleration. The model From Fig. 8, we can analyze that Waskita Karya Company
given by equation below stock price showed a declining price since March 2020 ef-
d2 S W K (t) WK fected by Covid-19 pandemic, but it grows up starts from the
W K dS (t)
+ α =0 (10) middle of June 2020.
dt2 dtINTERNATIONAL JOURNAL OF COMPUTING SCIENCE AND APPLIED MATHEMATICS, VOL. 7, NO. 1, FEBRUARY 2021 12
TABLE II
JKSE NUMBER OF NEURONS IN THE HIDDEN LAYER .
Number of neurons MSE
(5,3,5) 0.007153424
(6,7,8) 0.00746213
(7,10,15) 0.00725567
(9,9,4) 0.00713456
(13,4,5) 0.007898753
(15,15,2) 0.00734521
(20,10,5) 0.007996213
Fig. 8. Waskita Karya stock price analysis.
TABLE I
T ERASVISTA NEURAL NETWORK TEST
χ2 df p-value Critical Critical
Chi- Chi-
Square Square
Value Value
(0.05) (0.10)
JKSE 7.3333 2 0.02556 5.991 4.065
WSKT.JK 35.117 2 2.386 ×10⁻⁸ 5.991 4.065
IV. S TOCK P RICE P REDICTION USING M ULTI -L AYERED
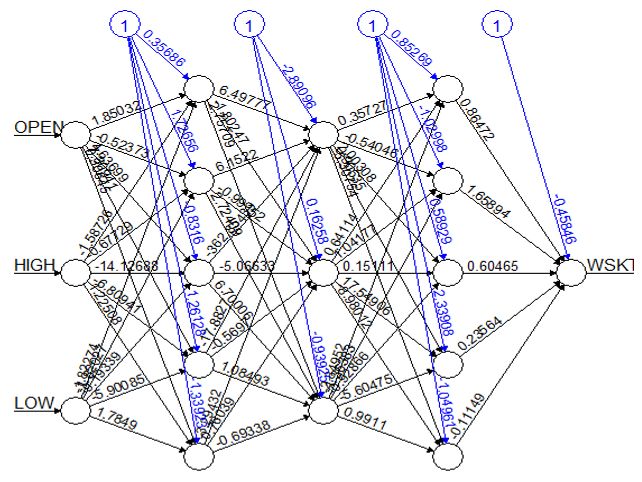
Fig. 9. Architecture for JKSE data.
N EURAL N ETWORK
Indonesian Composite Stock Price Index (IHSG) data and TABLE III
Waskita Karya Company (WSKT) stock price’s data have a P REDICTION OF IHSG.
dynamic characteristic. The data is fluctuating with varying
Time Close Price
magnitude of fluctuations. In most modeling, especially classic
models, it requires stationary assumptions, whereas in Multi- June, 19 2020 (Actual) 4987.776
Layered Neural Network model does not require stationary June, 20 2020 (Actual) 4925.248
assumptions because the built model has the ability to adapt June, 21 2020 (Actual) 4942.275
well to recognize data patterns. June, 22 2020 (Actual) 4918.831
Data complexity represents nonlinear data. The assumption June, 23 2020 (Actual) 4879.133
June, 24 2020 (Prediction) 4917.211
of non-linearity can be test by using the Terasvista Neural
Network Test. This test uses a Taylor series expansion of the
activation function. The results of checking data non-linearity
layers used is 3 hidden layers with the number of neurons was
assumptions using the Teraesvista Neural Network Test can
chosen by trial step on Table II.
be seen in Table I. The result of χ2 , df and p-value are
respectively 7.3333, 2, and 0.002556 for IHSG, and 35.1117, As the MSE value of the model with neuron trial is almost
2, and 2.386 × 10⁻⁸ for WSKT. The χ2 value of IHSG and the same, it is chosen the simplest model, i.e. (5,3,5) number
WKST are greater than the Chi-Square critical value (both of neurons in the hidden layers. It means that the hidden layers
using α = 0.05 and α = 0.1), so it can be concluded use 3 layers with the number of neurons are respectively 5, 3
that the data contain nonlinear patterns. The existence of and 5. Thus, the architecture for IHSG can be seen in Fig. 9.
nonlinear patterns indicates that the linear model will not By using architecture in Fig. 9, the prediction for one day
be good enough for modeling and forecasting, so that the ahead (June, 25 2020) is 4917.211. Table III shows the actual
nonlinear Multi-Layered Neural Network model will be more close price IHSG data and the prediction.
appropriate.
B. Multi-Layered Neural Network for Waskita Karya Com-
A. Multi-Layered Neural Network for Indonesian Composite pany Stock Price Prediction
Stock Price Index Prediction The architecture of the Multi-Layered Neural Network for
The architecture of the Multi-Layered Neural Network for Waskita Karya Company Stock Price Prediction was con-
Indonesian Composite Stock Price Index (IHSG) prediction ducted by logistic activation function with 3 input layers, i.e.
was conducted by logistic activation function with 3 input Waskita Karya stock low price, Waskita Karya Stock High
layers, i.e. IHSG Low Price, IHSG High Price, and IHSG Open Price, and Waskita Karya Stock Open Price, while the output
Price, while the output layer is IHSG Close Price. The hidden layer is Waskita Karya Stock Close Price and the hidden layersINTERNATIONAL JOURNAL OF COMPUTING SCIENCE AND APPLIED MATHEMATICS, VOL. 7, NO. 1, FEBRUARY 2021 13
TABLE IV using Least Square estimator. In this work, we took Jakarta
WSKT NUMBER OF NEURONS IN THE HIDDEN LAYER . Composite Stock Price Index and Waskita Karya Company
Number of neurons MSE
stock price as the object of observations. The results show
that the stock prices decrease since March 2020 effected by
(5,3,5) 0.005938236
Covid-19 pandemic and it starts to grow up again in the middle
(6,7,8) 0.00585358
of June 2020.
(7,10,15) 0.005751494
Further, the Multi layered Neural Network used to predict
(9,9,4) 0.005594167
the future price of those shares since it gave better prediction
(13,4,5) 0.005457839
than linear model. The experimental results showed that the
(15,15,2) 0.005624055
(20,10,5) 0.005535085
future shares predicted to be higher than the closed price be-
fore where IHSG predicted on 4917.211 and WSKT predicted
on 733 which is higher than the closed price before.
However, those two methods can be used to analyze stock
price movements and predict the future price. For the future
work, those two methods can be improved to predicting the
future stock prices in general.
R EFERENCES
[1] S. Sulia, “Analisis faktor–faktor yang mempengaruhi harga saham pada
perusahaan lq45 yang terdaftar di bursa efek indonesia,” Jurnal Wira
Ekonomi Mikroskil: JWEM, vol. 7, no. 2, pp. 129–140, 2017.
[2] T. Zeithamer, “The deterministic differential equation of the fall in the
market value of goods with the acceleration,” EuMotion, vol. 10, pp.
1–7, 2010.
[3] ——, “Economic phenomena from the viewpoint of the mechanics of
materials,” Procedia-Social and Behavioral Sciences, vol. 55, pp. 547–
Fig. 10. Architecture for WSKT data.
553, 2012.
[4] ——, “Possible uses of deterministic equations of motion in commodity
TABLE V price theory and for training appraisers,” in 4th International Conference
P REDICTION OF WSKT. on New Horizons in Education (INTE 2013), Roma, Procedia Social and
Behavioral Sciences, vol. 106, 2013, pp. 2063–2070.
Time Close Price [5] P. Englezos and N. Kalogerakis, Applied parameter estimation for
chemical engineers. CRC Press, 2000.
June, 19 2020 (Actual) 770 [6] C. Institute, Ethical and Professional Standards and Quantitative Meth-
June, 20 2020 (Actual) 760 ods. Wiley, 2020.
June, 21 2020 (Actual) 745 [7] Z. Rafzanjani, F. Farikhin, and S. Khabibah, “Estimasi parameter dalam
model depresiasi harga untuk komoditi kakao dan mobil,” Prosiding
June, 22 2020 (Actual) 735 Seminar Nasional Matematika dan Pendidikan Matematika UNDIP, pp.
June, 23 2020 (Actual) 725 65–69, 2015.
June, 24 2020 (Prediction) 733 [8] M. Mudjiyono, “Investasi dalam saham & obligasi dan meminimalisasi
risiko sekuritas pada pasar modal indonesia,” Jurnal STIE Semarang
(Edisi Elektronik), vol. 4, no. 2, pp. 01–18, 2012.
[9] E. Tandelilin, “Analisis investasi dan manajemen portofolio,” 2001.
used is 3 hidden layers with the number neurons was chosen [10] Y. Juliati, “Peranan pasar modal dalam perekonomian negara,” HUMAN
by trial step which can be seen on Table IV. The least MSE FALAH: Jurnal Ekonomi dan Bisnis Islam, vol. 2, no. 1, pp. 95–112,
2015.
was automatically chosen as the best model. [11] A. Barus, “Pengaruh reaksi pasar terhadap harga saham perusahaan
As the MSE value of the model with neuron trial is almost yang terdaftar di bursa efek indonesia,” Jurnal Wira Ekonomi Mikroskil:
the same, we choose the simplest model, namely (5,3,5) JWEM, vol. 4, no. 1, pp. 41–50, 2014.
[12] “Bahaya ekonomi di masa pandemi,”
number of neurons in the hidden layers. It means that the https://kolom.tempo.co/read/1322762/bahaya-ekonomi-di-masa-
hidden layers use 3 layers with the number of neurons are pandemi/full&view=ok, accessed: 2020-06-24.
respectively 5, 3 and 5. Thus, the architecture for WSKT can [13] N. Sansa, “The impact of the covid-19 on the financial markets:
Evidence from china and usa,” Electronic Research Journal of Social
be seen in Fig. 10. Sciences and Humanities, vol. 2, 2020.
By using architecture in Fig. 10, the prediction for one day [14] W. Burns, E. Peters, and P. Slovic, “Risk perception and the economic
ahead (June, 25 2020) is 733. Table V shows the actual close crisis: A longitudinal study of the trajectory of perceived risk,” Risk
Analysis: An International Journal, vol. 32, no. 4, pp. 659–677, 2012.
price WSKT data and the prediction. [15] B. Barber and T. Odean, “All that glitters: The effect of attention and
news on the buying behavior of individual and institutional investors,”
V. C ONCLUSIONS The review of financial studies, vol. 21, no. 2, pp. 785–818, 2008.
[16] A. Del Giudice and A. Paltrinieri, “The impact of the arab spring and
The dynamical stock price changes through Covid-19 pan- the ebola outbreak on african equity mutual fund investor decisions,”
demic can be expressed with the second order continuous Research in International Business and Finance, vol. 41, pp. 600–612,
2017.
time varying differential equation where its acceleration of [17] J. Engelberg and C. Parsons, “The causal impact of media in financial
price changes equals to its magnitude. The solution of this markets,” The Journal of Finance, vol. 66, no. 1, pp. 67–97, 2011.
differential equation represents the stock price prediction at [18] H. Liu, A. Manzoor, C. Wang, L. Zhang, and Z. Manzoor, “The covid-19
outbreak and affected countries stock markets response,” International
time t. To achieve this solution, the coefficient of magnitude Journal of Environmental Research and Public Health, vol. 17, no. 8,
price changes calculates by estimating the general solution p. 2800, 2020.INTERNATIONAL JOURNAL OF COMPUTING SCIENCE AND APPLIED MATHEMATICS, VOL. 7, NO. 1, FEBRUARY 2021 14
[19] Y. Liu, “The importance of trust distance on stock market correlation:
Evidence from emerging economics,” Borsa Istanbul Review, vol. 20,
no. 1, pp. 37–47, 2020.
[20] J. Stewart, D. Clegg, and S. Watson, Calculus: early transcendentals.
Cengage Learning, 2020.
[21] S. Haykin, Neural networks: a comprehensive foundation. Prentice-
Hall, Inc., 2007.
[22] L. Fausett, Fundamentals of neural networks: architectures, algorithms
and applications. Pearson Education India, 2006.
[23] D. Yeung, I. Cloete, D. Shi, and W. Ng, Sensitivity analysis for neural
networks. Springer, 2010.You can also read