Development Model of Syari'ah Financial Service Cooperatives with Data Envelopment Analysis Approach and Financial Performance, The Study on ...
←
→
Page content transcription
If your browser does not render page correctly, please read the page content below

International Journal of Recent Technology and Engineering (IJRTE)
                                                                     ISSN: 2277-3878, Volume-7, Issue-6S5, April 2019

       Development Model of Syari’ah Financial
     Service Cooperatives with Data Envelopment
     Analysis Approach and Financial Performance,
       (The Study on Syari’ah Financial Service
            Cooperatives in West Sumatera)
                                     Yurniwati, Tafdil Husni, Rida Rahim, Desyetti
                                                                      access to commercial banks, which aims to help and foster
      Abstract: The aim of this study is to assess and analyze the    poor communities to establish businesses to increase their
efficiency and financial performance of Sharia Financial              incomes.
Services Cooperatives (KJKS) in West Sumatera province. This             Husni, Rahim (2017) found that the KJKS performance
research was conducted at KJKS in Padang, Bukittinggi and
                                                                      was significantly negative with traditional efficiency
Agam District. Sample selection method was done by using
purposive sampling, and got sample of 104 KJKS. The data used         (Operational Cost per Operational Income), indicating that
consist of primary data and secondary data. Primary data were         the higher the KJKS financing cost, the lower the KJKS profit
obtained from questionnaires filled by respondents. Secondary         will be. Sari and Saraswati's (2017) study that analyzed the
data is obtained from KJKS financial report. Method of                performance of the banking industry in Indonesia for the
measuring efficiency used is Data Envelopment Analysis (DEA).         period 2012-2014 found efficiency influencing return on
The method of analysis using descriptive analysis and hypothesis      assets (ROA). Farandy, Suwito, and Dabutar (2017) to
testing is by multiple regression equation. The results showed that   measure the level of efficiency using the two-stage data
KJKS efficiency using the assumption of constans return to scale
                                                                      envelopment analysis (DEA) method. The results show that
(CRS) and return to scale variable (VRS) found efficient KJKS
during 2013-2015 period of 13.75% and 86.25% inefficient              the variable of ROA is affecting Islamic commercial bank
KJKS. The result of hypothesis testing shows that efficiency has      efficiency. It is indicated that ROA that describes the higher
no effect on ROA, BOPO and FDR have significant effect to             level of bank profitability will produce a more efficient bank.
ROA.                                                                  Banks that have higher profit levels could potentially have a
                                                                      higher level of efficiency [4].
   Index Term:      Data Envelopment Analysis, Financial                 The motivation of the researcher is to evaluate the
Performance, Sharia Financial Services Cooperative                    efficiency of KJKS with DEA (data evelopment analysis)
                                                                      method and to evaluate the performance of KJKS in
                                                                      accordance with the target of micro finance institution, which
             I. BACKGROUND RESEARCH                                   is to strengthen the role of cooperatives in improving
   Microfinance institutions are very important in improving          business competition condition and empowering UMKM.
micro enterprises in alleviating poverty, proving to be an            Research on microfinance institutions in poverty alleviation
effective tool to help the poor out of poverty [1][2][3].             has been conducted in 2010-2012 with studies through micro
Microfinance has great potential in developing MSME sector            credit nagari (KMN). The result of the research is the need for
in particular and improving the general economic condition            socialization and assistance in the channeling of nagari credit
of the poor. For example, Grameen Bank in Bangladesh and              in order to achieve the target of community empowerment
BankcoSol in Bolivia (Morduch, 1999). In accordance with              [5]. Since 2012, the Nagari Micro Finance Institution
research Ramzan (1997); Roberts and Roberts (2003);                   (LKMN) has changed to KJKS (Sharia Financial Services
Afrane (2003); Yurniwati and Rahim (2012) proves that                 Cooperative) pursuant to Law No. 17 of 2012 article 87, in
capital injection to MSMEs has a positive impact on the               the Minister of Cooperatives and Small and Medium
increase in business turnover. The vision of                          Enterprises of the Republic of Indonesia No.91 / Kep / IV /
microfinance institutions in Indonesia is to achieve a                KUKM / IX / 2004 concerning the Implementation of Sharia
                                                                      Financial Services Cooperative Business Activity (KJKS).
healthy, robust and efficient financial institution system and        KJKS as one of LKMS needs to be evaluated whether Sharia
help drive national economic growth and improve the                   financial service cooperatives are efficient, how about their
economy of the poor. Microfinance institutions are more               performance.
focused on providing finance for the poor who do not have                Financial sustainability can be demonstrated by KJKS
                                                                      independence and profitability, the level of payments and
                                                                      business success, as well as the benefits of the program for
Revised Manuscript Received on December 22, 2018.
    Yurniwati, Andalas University, Indonesia,
                                                                      the community.
yurniwati.fekon.unand@gmail.com
    Tafdil Husni, Andalas University, Indonesia
    Rida Rahim, Andalas University, Indonesia
    Desyetti, Andalas University, Indonesia

                                                                          Published By:
Retrieval Number:F11620476S519/19 ©BEIESP                                 Blue Eyes Intelligence Engineering
                                                                  942     & Sciences Publication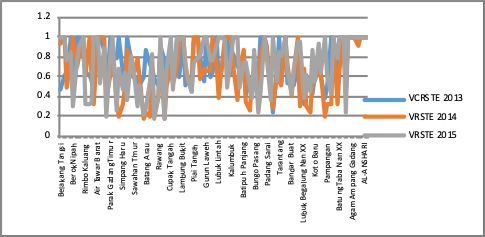
Development Model of Syari’ah Financial Service Cooperatives with Data Envelopment Analysis Approach and
        Financial Performance, (The Study on Syari’ah Financial Service Cooperatives in West Sumatera)

   The sustainability of the credit program is an essential        was originally developed by Farell (1957) which measures
component of achieving the MFI's program objectives,               the efficiency of a single technique input and one output to
namely,      the     profitability   required     to    achieve    multi input and multi output. DEA was popularized by
self-sustainability, ie, MFIs that generate sustainably positive   Charness, Cooper, and Rhodes (1978) with the assumption of
financial returns. Baitul Maal wat Tamwil (BMT) and KJKS           Constan Return to Scale (CRS) and developed again by
(Shariah Financial Service Cooperatives) Islamic                   Bunker, Charness, and Cooper (1994) assuming Variable
microfinance in West Sumatra is also potentially big in            Return to Scale (VRS). Both methods are finally renowned as
realizing a strong sector of UMKM. Overall, this study             CCR and BCC models.
provides some important contributions to the literature on
                                                                     C. Data Envelopment Analysis Models.
Sharia microfinance institutions. There are several indicators
to measure KJKS performance such as efficiency with DEA               1) CCR model (Charness, Cooper, and Rhodes). The most
(data envelopment Analysis) method, financial performance          basic DEA model is the CCR (Charness, Cooper, and
is ROA, BOPO and FDR. The result of research by using              Rhodes) model developed in 1978. In this model for each
DEA to measure efficiency find more efficiency of KJKS             DMU (Decision Making Unit) measurement entity, a virtual
means better performance of KJKS [6]. Research on the              input and output are generated Vi (input) and Vr (output)
other hand, found that ROA has an effect on efficiency, but        have value is unknown. So in DEA weights are generated
the result of this research is that efficiency has no effect on    from data and not specified from scratch. Each DMU will be
ROA.                                                               directed to efficient use of inputs and will produce the best
                                                                   goal value by every DMU available. The CCR model which
   II. THEORETICAL FOUNDATION AND PAST                             is the basic DEA model uses the assumption of Constan
                RESEARCH                                           Return toScale which assumes that the addition of one unit of
                                                                   input should result in the addition of one unit of output. used
A. Efficiency                                                      is every DMU operate optimally. Efficiency in this type is
   Efficiency is a key concept in assessing financial              also called Overall Efficiency ie technical efficiency and
institutions (Nigmonov, 2010) and one of the most popular          scale. The maximization above is a CCR or technical
performance parameters (Bank Indonesia, 2003). At the time         efficiency, so Xij is the number of i-th inputs from the j-DMU
of efficiency measurement, the bank is faced with the              and Ykj is the number of k-type outputs from the j-j DMU.
conditions of how to obtain an optimal level of output with        The efficiency rating is always less than or equal to 1. The
existing input levels, or to obtain a minimum level of input       DMU whose efficiency value is less than 1 means inefficient,
with a certain level of output. With diidetifikasikannya           while the DMU whose efficiency value equals 1 means the
allocation of inputs and outputs, can be analyzed further to       DMU is efficient.
see the causes of inefficiency [7].                                   2) Model BCC (Banker, Charness, and Chopper). The
   Efficiency consists of two components: technical                DEA BCC model known as the Variable Return to Scale
efficiency and allocative efficiency (Farell, 1957). Technical     (VRS) assumes that each addition of one input unit is
efficiency reflects the ability of the DMU to minimize the use     insignificant followed by the addition of one unit of output,
of inputs to produce a certain amount of output, while the         the addition of its output can be greater than one (Increasing
allocative efficiency reflects the DMU's ability to use inputs     Return to Scale), less than one (Decreasing Return to Scale)
in optimal proportions, given each price and production            or still (Constant Return to Scale). A production process is
technology. Coelli et all (199 also with total efficiency.         said to be efficient if the use of a certain number of inputs can
   There are several methods of measuring the efficiency of        produce the optimal amount of output or to produce a certain
banking that has been done so far [8], namely 1). Traditional      amount of output with minimal input, this efficiency is
Approach, using Index Number or ratio (BOPO); and 2). The          referred to as technical efficiency (pure technical efficiency).
Frontier Approach is based on the optimal behavior of the          This calculation model is often denoted as: DMU whose
firm in order to maximize output or minimize costs, as a way       efficiency value is less than 1 means inefficiency whereas
of economic units to achieve goals. In approach Frontier           DMU whose value is equal to 1 means the DMU is efficient.
Approach there are several approaches, namely 1).                     In addition to the above two models, several studies have
Deterministic Approach: often classified as Non-Parametric         developed a Technical Efficiency (TE) calculation from
Approach, this approach uses Tekhnical Mathematic                  CRS. DEA is divided into two components, namely: the first
Programing, or popular with Data Envelopment Analysis              component refers to the scale of efficiency, while the other
(DEA); and 2). Stochastic Approach: This approach is               components refer to the 'pure' TE. This can be done by
classified as a parametric approach, using Econometric             calculating CRS and VRS against the same suatudata. If there
Frontier [9][10].                                                  is a difference between the two TE scores of the DMU, this
                                                                   indicates that the DMU has an efficiency scale. Measurement
  B. Data Envelopment Analysis (DEA)                               of efficiency in financial institutions, including nonprofits,
   DEA is an efficiency measurement method that uses               has many approaches, among others: 1) Production
mathematical programming techniques. DEA measures the              Approach. This approach considers financial institutions as
relative efficiency of a Decision Making Unit (DMU) pool in        producers of savings and credit loans. Input is the amount of
managing resources of the same type to produce output of the       labor, fixed assets, and other materials. While the output is
same type, where the functional relationship of input to
output is unknown (Siswandi: 2004). DEA is used to measure
efficiency, including health care, education, transportation,
manufacturing, and banking. (Insukindro et al. 2000). DEA

                                                                        Published By:
                                                                        Blue Eyes Intelligence Engineering
Retrieval Number:F11620476S519/19©BEIESP                       943      & Sciences Publication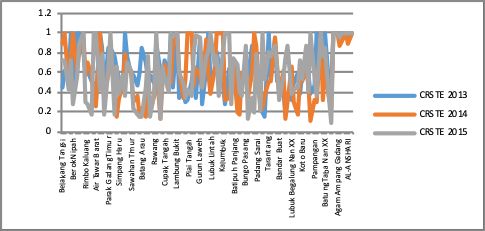
International Journal of Recent Technology and Engineering (IJRTE)
                                                                   ISSN: 2277-3878, Volume-7, Issue-6S5, April 2019

the amount of deposits, loans, and related transactions. 2)         interpret. While the frontier approach is used to assess the
Intermediation Approach.                                            efficiency of a bank and better than the traditional accounting
   In this approach, financial institutions are perceived as        approach. According to Drake and Hall (2003), there are two
intermediaries in financial services, which transform and           kinds of frontier approaches used in assessing efficiency ie
distribute financial assets from surplus units to deficit units.    and the parametric approach (Stochastic Frontier Analysis or
In this case, the inputs used are labor costs, capital, and         SFA) and nonparametric approaches (DataEnvelopment
interest payments on deposits. Outputs measured are credit          Analysis or DEA). Efficiency is one benchmark that can be
loans and financial investments. 3) Asset Approach. This            used to see bank performance. The more efficient a bank then
approach sees financial institutions as credit lending              the performance will also be better. studies found that BOPO
distributors whose output is measured by assets owned.              has a negative and significant effect on ROA. Hypothesis 2 is
                                                                    BOPO to ROA [11][12].
  D. Efficiency Measurement Approach with DEA
   Measurement of efficiency in financial institutions,               H. FDR and Financial Performance (ROA)
including nonprofits, has many approaches, the approaches              Financing Deposit Ratio (FDR) is a ratio that illustrates the
used, among others:                                                 comparison between loans issued with funds collected
   1) Production Approach. This approach considers                  (Buchori (2009) .In the KJKS the concept of FRD can also be
financial institutions as producers of savings and credit loans.    used to measure liquidity.The FDR ratio is expected to affect
Input is the amount of labor, fixed assets, and other materials.    ROA, whereby the more liquid the company is, the higher the
While the output is the amount of deposits, loans, and related      utilization of assets to generate profit Aka hypothesis 3 is
transactions.                                                       FDR has pengaru against ROA.
   2) Intermediation Approach. In this approach, financial
institutions are perceived as intermediaries in financial                          III. RESEARCH METHODS
services, which transform and distribute financial assets from         This research is a quantitative descriptive research. The
surplus units to deficit units. In this case, the inputs used are   study was conducted on Sharia Financial Services
labor costs, capital, and interest payments on deposits.            Cooperative (KJKS) in West Sumatra. The research data is
Outputs measured are credit loans and financial investments.        taken from the financial statements for the period of
   3) Asset Approach. This approach sees financial                  2013-2015 selected as the sample. Sampling method based
institutions as credit lending distributors whose output is         on purposive sampling method with criteria: (1) KJKS
measured by assets owned.                                           registered in the Office of Cooperatives and Industry in the
   E. Financial Performance (ROA)                                   city of Padang, Bukittinggi and Kabupaten Agam; (2) KJKS
   In this research, ROA is one indicator of performance. The       reporting the complete annual financial statements for the
reason this ratio is used as a performance measure is because       period 2013-2015; and (3) KJKS having the data required for
it attributes the total net result achieved with the asset being    this research. The sample of this study consisted of 95 KJKS
sacrificed to obtain the net result. This ratio includes all the    in Padang City, 5 KJKS in Agam Regency and 2 KJKS in
results obtained from operating, financing and investment           Bukitinggi City Based on the criteria, the sample of 104
activities [13][14][15].                                            KJKS comprised 95 KJKS in Padang City, 5 KJKS in Agam
                                                                    Regency and 2 KJKS in Bukitinggi city.
  F. Financial Efficiency and Performance (ROA)                        The data used are secondary data from the department of
    Increased efficiency leads to increased bank revenues,          cooperatives and industrial city of Padang, Bukittinggi city
reduced expenses, and will have an impact on the increase in        and Agam district. Dependent variable in this research is
the value of bank assets. Thus, the impact of bank efficiency       KJKS performance measured by using Return on Assets
is the growth of bank assets is positive. The more efficient the    (ROA) ratio. The ROA ratio is defined as the remaining
company's operations and the higher the efficiency of the           business return divided by its total assets (Scott, 2000). The
company's asset utilization, the company's ability to deliver       ROA ratios used in this study are in line with Scott's research,
returns to all funders will be even higher as well. The             2000 which is calculated by the formula of Business Returns
measurement of the operating efficiency and efficiency of the       divided by Total Assets.
asset utilization above is based on the company's financial            Independent variables, a) Efficiency, measured using Data
ratios. Thus there is an association of efficiency with ROA         Envelopment Analyisis b) Financing Deposit Ratio is
and ROE (Subramanyam and Wild 2009). According Koetter              measured by total financing per third party fund and c) BOPO
et.all (2006), efficiency can improve the performance of            measured by comparison of operational cost to operating
financial institutions and have a positive and significant          income. FDR is measured by the ratio of the ratio between the
relationship with financial performance indicators. In his          amount of funds disbursed to the community (financing) with
research, [16][17] used ROA and ROE as an indicator of              the amount of public funds and capital used. DEA
financial performance and found that efficiency affects ROA         calculations use input and output data. The input variables
and ROE. Hypothesis 1 is Efficiency effect on ROA                   include Fixed Asset, Wage and Salary load, Adm and
                                                                    General Expenses, Total Expenses, and Total Capital. The
  G. BOPO and Financial Performance (ROA)                           output variables are Financing of Current Year, Operating
   In the banking industry in Indonesia, a measure of               Income (margin), and Operating Income / other. Financing
efficiency often used to provide an assessment of bank
efficiency performance (Bank Indonesia Regulation Number
6/25 / PBI / 2004) is the ratio of BOPO. BOPO is an indicator
to measure traditionally efficient but not able to describe the
real condition of the bank, and the results are not easy to

                                                                        Published By:
Retrieval Number:F11620476S519/19 ©BEIESP                               Blue Eyes Intelligence Engineering
                                                                944     & Sciences Publication
Development Model of Syari’ah Financial Service Cooperatives with Data Envelopment Analysis Approach and
Financial Performance, (The Study on Syari’ah Financial Service Cooperatives in West Sumatera)
Deposit Ratio variables are measured by total financing per
third party fund.
First Analysis Method, calculate BOPO, ROA, FDR and
efficiency. Efficiency is calculated by using Data
Envelopment Analysis method treated with DEAP 2 DEA
calculation in this research using production and
intermediation approach. In DEA calculations, each Decision
Making Unit (DMU) is the subject of research. DMU is also
called the Decision Maker Unit in quantitative form that can
be calculated its efficiency. In this study DMU consists of
Sharia Financial Services Cooperative. A DMU is considered
efficient if it has a score of 1. Inefficiency can be seen from a
score of less than 1. Second, hypothesis testing includes
Coefficient of Determination (Adjusted R Square) and
Statistical Test t (Partial Test) to see the effect of independent
variables ie Efficiency, BOPO and FDR against the
dependent variable that is ROA.
IV. RESEARCH RESULTS
A. KJKS-BMT Financial Performance.
The result of the research shows the financial performance
of KJKS as follows; (1) The average total capital of KJKS is
297,965,872 million rupiah, meaning that most of
KJKS-BMT capital is still rolling. In 2010 the local
government provided initial capital of Rp 300 million per
kelurahan. On average, the current year financing amounted
to 289,639,377 million rupiah, indicating that almost all
capital owned by KJKS is channeled to productive
communities. Average cost (wage, salary, administrative and
general) amounted to 39,473,223 million rupiahs with an
average operating income of 49,409,572. Average operating
income is greater than the average cost of KJKS. The
financial performance assessed by using ROA, BOPO and
FDR increases unless the FDR declines. The financial
performance of ROA has increased from 3.92% in 2013 to
Fig. I. Average Efficiency of KJKS-BMT in 2013-2015
4.65% in 2015. The increase in ROA is still below the
standard set by the ministerial decree of the State Small and
The average scale of efficiency in 2013 is 88% with the
Medium Enterprise Cooperation No. 129 / Kep / M / KUKM
lowest value of 20.5% in KJKS Koto Pulai located in Koto
/ 2002 dated 29 November 2002, where the ROA standard is
Tangah sub-district in Padang city. The average efficiency
said to be good if ROA> 10%. ROA indicates the ability to
scale of 2014, amounting to 86% with the lowest value of
use Assets. BOPO also showed a good performance of
13.8% at KJKS Batu Gadang in Kecamatan Lubuk Kilangan
82.87% in 2013 and declined to 62.32% in 2015. This means
in Padang city. The efficiency calculations for 2013 and 2014
that the operational expenses compared to operating income
produce 14 or 13.74% efficient KJKS in West Sumatra, as
is better because it dropped in 2015 to 62.32%. However,
much as 86.26% of KJKS operate inefficiently.
FDR has increased from 62.11% in 2013 to 136.53% in 2015,
which means that the FDR rate has exceeded the
While in 2015 the average scale efficiency of 84% with the
government's required safe limit of 85% - 110%. This shows
lowest value of 18.8% in KJKS Pasia nan tigo in Koto
the lower bank liquidity ability, and if not managed properly
Tangah district in Padang city, efficiency calculation in 2015
will be fatal for the survival of micro financial institutions.
which yield 16 or 16% efficient KJKS-BMT and 84% KJKS
The calculation results from DER-CRSTE and VCRTSE
operate inefficiently during 2015. These results indicate that
software of CCR version with production and intermediation
there is an efficient increase in KJKS, although the increase is
approach shows the development of KJKS efficiency of West
not significant, this is because not all KJKS in West Sumatra,
Sumatra from 2013-2015, looks like picture 1 below.
managed by professional management in managing
microfinance institutions [18].
Published By:
Blue Eyes Intelligence Engineering
Retrieval Number:F11620476S519/19©BEIESP 945 & Sciences PublicationInternational Journal of Recent Technology and Engineering (IJRTE)
ISSN: 2277-3878, Volume-7, Issue-6S5, April 2019
B. KJKS Efficiency based on Return to Scale 84.6% are explained by other factors outside the regression
The result of calculation with DEA method shows RTS model being analyzed. By 2014, the value of the coefficient
value which most of KJKS is currently in economies of scale of determination (Adjusted R Square) of 0.986 / 98.6% which
position that is condition where KJKS able to decrease cost is close to 100% indicates that Efficiency, BOPO, and FDR
per unit of its service product (cost efficiency) through are able to provide all the information needed to predict the
business development and income increase. This is indicated variation of ROA changes. The remaining 0.014 or 1.4% is
by an indicator that as many as 47 KJKS (46.08 percent) are explained by other factors outside the regression model being
in the position of the IRS. analyzed. By 2015, the value of the coefficient of
determination (Adjusted R Square) of 0.509 or 50.9% which
is close to 100% indicates that Efficiency, BOPO, and FDR
are sufficient to provide all the information needed to predict
the variation of ROA changes. While the rest of 0.491 /
The results of this analysis have meaning that currently 49.1% is explained by other factors outside the research
KJKS can still optimize the existing capital and reduce model.
operational costs to improve efficiency. Efficient KJKS in F. Partial Test Results (t)
West Sumatra between 2013-2015 based on input orientation
Partial test results (t) Efficiency variable in 2013 has a
with DEAP 2 method of BCC version of 13.74% among
significance value of 0.972> 0.05. These results show that
others; Kampong Jao, Purus, Kapalo Koto, Limau Manih,
Efficiency has no effect on ROA. Year 2014 has a
Tabing Banda Gadang, Korong Gadang, Tarantang, Taba
significance value of 0.378> 0.05. These results show that
Batik, KJKS BMT Agami Madani Nagari Tiku Utara, KJKS
Efficiency has no effect on ROA. Year 2015 has a
Agam Madani Nagari Ampang Gadang, KJKS BMT Agam
significance value of 0.244> 0.05. These results show that
Madani Nagari Balingka, KJKS Agam Feed Sinayan, KJKS
Efficiency has no effect on ROA. Partial testing from year
AL-Anshari, KJKS Al-Hijrah. Inefficient KJKS in West
2013-2015 in every year shows the number of significance>
Sumatera is 86.26%.
0,05 meaning Efficiency has no effect to ROA. The results of
C. Peer Analysis for Inefficient KJKS-BMT data processing showed beta value -0.24, -0.05, 0.026 with
One of the advantages of Data Envelopment Analysis significance respectively that is 0.972, 0.378, 0.244. Testing
(DEA) method is that it can show efficient KJKS reference in 2013 and 2014 shows a negative relationship between
for inefficient KJKS in order to increase its efficiency level. efficiency and ROA and has no effect. While testing of 2015
Efficient inefficient KJKS reference such as KJKS Olo in shows a positive relationship with a beta value of 0.026 but
Padang Barat sub-district in Padang City, KJKS Batung Taba still has no effect. From the research conducted it can be
in Lubuk Begalung sub-district of Padang, KJKS Agam concluded that efficiency has no contribution to ROA and no
Madani Tiku Utara (Regency of Agam), KJKS Limau Manih effect.
(Kecamatan Pauh) and KJKS Kampung Jao (District of West Partial test results (t) BOPO variable in 2013 has a
Padang) in Padang City [19]. Similarly, other inefficient significance value of 0.010Development Model of Syari’ah Financial Service Cooperatives with Data Envelopment Analysis Approach and
Financial Performance, (The Study on Syari’ah Financial Service Cooperatives in West Sumatera)
processing showed beta value of 0.93.0.183,0.090 with 1. Financing for inefficient KJKS to match the target of the
significance respectively 0.027, 0.002, 0.026. These figures calculation result using Data Envelopment Analysis (DEA)
show that any increase in FDR of 1 will increase ROA by method so that its operational condition is more efficient.
0.93,0.183,0.090 assuming other independent variables are 2. The efficiency calculation should be conducted
considered fixed. On the other hand can also be seen periodically to evaluate and monitor KJKS conditions in
significance valueInternational Journal of Recent Technology and Engineering (IJRTE)
ISSN: 2277-3878, Volume-7, Issue-6S5, April 2019
20. Rahim, Rida (2010), Impact Analysis of Revolving Fund of KUR
(People's Business Credit) on SMEs Performance of BRI Bank
Partners, Management and Business Journal FE UA Payakumbuh: Vol
01, Number 2, December 2010. ISSN: 2086-6461
21. Rahim Rida (2011), KUR Financing Impact Analysis on UMK Bank
Partner Performance BNI Branch Pondok Kota Padang, Research
Department of Management.
22. Rhyne, E., 1998. The yin and yang of Microfinance: Peaching the Poor
and Sustainability. In: Christen R.P., McDonald, J. _Eds .., The
Microbanking Bulletin, Vol. II. The Economics Institute, Boulder,
23. Rhyne, E., Otero, M., 1992. Financial Services for Microenterprises:
Principles and Institutions. World Development 20 _11., 1561-1571.
24. Sherman, H.D. and Gold, F. (1985), Bank Branch Operating
Efficiency: Evaluation with Data Envelopment Analysis, Journal of
Banking and Finance 9 (2), 297-315
25. Tornqvist, L. (1936), The Bank of Finland's Consumption Price Index,
Bank of Finland Monthly Bulletin 10, 1-8
26. Yurniwati, Rida rahim (2012) Model Development of Micro Credit
Agencies Nagari to Improve the Prosperity of the Poor in West
Sumatra, DP2M-Dikti Jakarta
Published By:
Retrieval Number:F11620476S519/19 ©BEIESP Blue Eyes Intelligence Engineering
948 & Sciences PublicationYou can also read