An Introduction to HIPPO V4 - the Operational Monitoring and Profiling Solution for the Informatica PowerCenter platform. A Functional overview.
←
→
Page content transcription
If your browser does not render page correctly, please read the page content below
An Introduction to HIPPO V4 - the Operational Monitoring and
Profiling Solution for the Informatica PowerCenter platform.

A Functional overview.

`

Runner-Up 2012 MVP Competition

    Copyright Assertive Software Ltd 2012. All rights reserved.   Page 1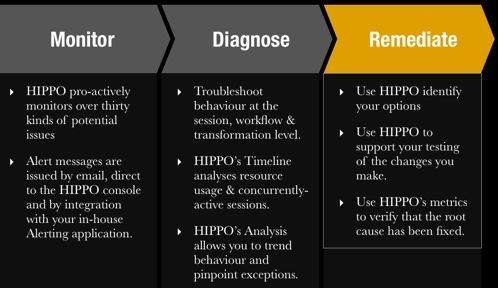
Introduction!...................................................................................3
    The Complexity Challenge.!...............................................................................................3

    HIPPO’s Unique Perspective!............................................................................................3

HIPPO’s Three-Step Approach;!...................................................4
    Monitor: the HIPPO Active Notification Centre (HANC)!.................................................4

    Diagnose and Remediate: the HIPPO Console!..............................................................4

    HIPPO’s unique approach!.................................................................................................5

HIPPO’s Key Features !..................................................................6
    HANC - HIPPO’s Active Notification Centre!....................................................................6

          HANC’s Alert Levels and Scope!................................................................................6

          HANC’s Alert mechanisms!.........................................................................................6

    2. HIPPO’s Dashboard!.......................................................................................................6

          HIPPO’s Filtering options!...........................................................................................6

    3. Resources!......................................................................................................................7

    4. Vital Signs!......................................................................................................................7

    5. Activity Monitor!..............................................................................................................8

    6. Search!.............................................................................................................................9

    7. Analysis!..........................................................................................................................9

    8. Workflow!........................................................................................................................9

    9. Task!...............................................................................................................................10

    10. Capacity Planning!.....................................................................................................10

    11. Timeline!......................................................................................................................10

Summary!......................................................................................11

Appendix!......................................................................................12
    HANC Notification Rules Summary!...............................................................................12

Published May, 2012.

   Copyright Assertive Software Ltd 2012. All rights reserved.                                                                                  Page 2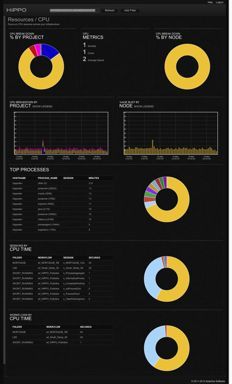
Introduc)on
We have created HIPPO because you need a holistic view of your PowerCenter estate,
not simply at an individual Mapping or Folder level, but also at a business level interpreting
the activity, incidents, trends and capacity in your PowerCenter environments.

HIPPO is an active monitoring, diagnostic and analysis tool that gives you an unrivaled
understanding of your Informatica estate and the Data Integration processes that it
supports to enable you to improve performance at every level.

The$Complexity$Challenge.

An organization’s Data Integration environment is a significant investment that provides a
key operational asset for the Business. However the environment is a complex one: CPU
and Memory resources, the Operating System, Network, Database, ETL and many other
processes interoperate to integrate operational, financial and business intelligence data in
ever larger volumes and in ever more demanding timeframes.

Considerable effort is devoted to optimizing these data integration processes but success
is limited by the lack of a big picture; how much Informatica capacity is needed? What
benchmark level of performance can be expected? How do I factor in other parallel data
integration processes when I estimate if SLAs will be met? How can variations in demand
be accommodated? Why does this Workflow fail intermittently for the same reason?

Over the past two years we have spent many hours meeting with Informatica
Administrators, Developers and Support staff from the smallest to the largest Informatica
customers to find out what they needed to know to make their jobs easier.

We identified five challenges that HIPPO needed to solve. They were;

1. It is extremely difficult to get visibility across the entire Informatica environment and
   there is little operational history available
2. Users need to connect to multiple tools to understand what is going on
3. Users need to do lots of manual work to identify trends in performance, resource
   availability and capacity in my Informatica environment
4. Informatica tools are too focused on individual repositories - Users need the big picture
   and then to focus on what has failed or is performing differently from normal irrespective
   of which repository it comes from
5. Too much time is spent log trawling!

HIPPO V4 has been designed to meet these challenges by combining an operational data
warehouse with real time monitoring and alerting linked to a real-time visualisation of your
entire Informatica environment.

HIPPO’s$Unique$Perspec=ve

Starting with Informatica, HIPPO monitors and profiles everything from an individual
transformation to an entire project. The Informatica estate aggregated as a service across
your Grid or multi-Node environment. Trends in performance by sessions, workflows,
projects or nodes are available over any timescale and HIPPO profiles non-Informatica
processes as well, allowing you to identify their share of CPU and Memory resource.

  Copyright Assertive Software Ltd 2012. All rights reserved.                          Page 3
HIPPO’s/Three3Step/Approach;

Monitor:$the$HIPPO$Ac=ve$No=fica=on$Centre$(HANC)

HANC, the HIPPO active monitoring solution, constantly monitors the activity and resource
usage within your Informatica estate alerting you to over thirty different kinds of issues
which include Service, Workflow and Session failure, abnormal patterns in CPU and
Memory usage at the Project, Workflow or Session level and breaches to SLAs and
changing trends in your Data Integration KPIs.

At its heart lies a powerful combination of information collection and interpretation
technologies that are key to the proactive monitoring of your PowerCenter estate and Data
Integration applications and services. Between them, these technologies facilitate
business activity monitoring of the Data Integration processes critical to your organization.

Diagnose$and$Remediate:$the$HIPPO$Console

HIPPO is unique because it analyses your environment from the bottom-up; CPU,
Memory, Data Movement and other key metrics are monitored and analyzed at the
individual Transformation, Session and Workflow level. This enables Developers to get the
information that they need to diagnose performance bottlenecks, Testers to identify if
performance thresholds have been met and Support Analysts to be alerted to incidents in
the production environment.

HIPPO then aggregates this operational information into a higher-level analysis. Firstly
HIPPO presents this information at a Folder, Domain, Repository, Grid, Integration
Service or Estate level to enable Informatica Administrators and Capacity Planners to
understand the trends in usage and performance in an intuitive way. Secondly, HIPPO
does something completely unique; it allows you to take a business view by logically
grouping Informatica and non-Informatica processes together to provide the Project-level
understanding of incidents, trends and performance that is vital to project managers and
stakeholders.
  Copyright Assertive Software Ltd 2012. All rights reserved.                         Page 4
HIPPO’s$unique$approach

Using a rapidly deployed, three-tier architecture with a light footprint, HIPPO delivers a
powerful enterprise wide monitoring and management capability for your entire Informatica
PowerCenter estate. HIPPO is entirely Grid-compliant and can simultaneously monitor any
number of Grids, Domains, Repositories, Integration Services and Hosts.

HIPPO's first tier, the instrumentation and collection tier, consists of software agents called
Collectors, which are located on each of the nodes to be monitored in your environment.

         HIPPO Topology

                                       BI & Reporting                                                                    Infa
                                            Tools                                                                     Repository

                                  Br                             BI Server
                                    ow                                                                                          Task & Workflow
                                      se
                                        r                                                                                          Metadata
                   Email Alerts

                                                   Dashboard                 Search &                         Fact                    OS
                                                   & Resources               Analysis                        Engine                 Profiler

                                                                  HIPPO                                                 HIPPO
                                                                                                                       Collector
                                                                Repository                  OS Metrics
                                                                                         Infa Task Metrics
                                                                             Activity     Logfile Analysis   HANC                  Repository
                                                        HANC
                                                                             Monitor    Facts & Dimensions   Engine                 Monitor

               Email Server

                                                               HIPPO Server                                      Informatica Node

The Collectors report the activity on each node to the second tier, HIPPO’s Analysis and
Consolidation tier, where HIPPO correlates infrastructure metrics with Informatica activity
and the performance values are consolidated and stored in the HIPPO Repository. This
tier includes HIPPO’s Active Notification Centre (HANC), the Fact Engine, the OS Profiler
and the Repository Monitor.

HANC then combines information from the HIPPO Repository with user-defined business
logic that allows meaningful alerts to be routed through email and other forms of
integration with your in-house monitoring systems to the most appropriate support
resource, providing your operations teams with the facts to take corrective action fast.

The third tier in HIPPO's architecture is the data visualization tier. This is HIPPO’s web-
driven user interface which we call the HIPPO Console. The Console provides an intuitive
graphical interface that supports real-time, color-coded visualisations at both logical and
technical levels. Interactive features, such as HIPPO’s TIMELINE, allow Users to direct
their analysis activities naturally to widen and narrow their perspective as required.
  Copyright Assertive Software Ltd 2012. All rights reserved.                                                                            Page 5
HIPPO’s$Key$Features 1. HANC$L$HIPPO’s$Ac=ve$No=fica=on$Centre HANC is HIPPO’s active alerting & notification module. HANC enables you to define over thirty kinds of monitoring rules that will trigger Alerts to be raised in a wide variety of circumstances. These rules are split into three categories; Exceptions, Deviations and SLAs and examples include sessions exceeding normal elapsed times, Service outages and resource thresholds being exceeded by individual sessions or workflows and a wide variety of other circumstances. See the Appendix at the end of this document for details. HANC’s Alert Levels and Scope HANC allows you to define the scope of a rule; at Folder, Workflow or Session Level, for example if you define a Cache Spill to Disk alert at Folder level then any session within that Folder which spills a cache to disk will trigger HANC to raise an alert. HANC’s Alert mechanisms HIPPO relays the alert in three ways; firstly direct to the HIPPO console where you can click on a ‘Review’ button to go straight to a detailed analysis of the problematic execution of that session or workflow. Secondly by email to your email account or to a group email account. Lastly, HIPPO also integrates directly with your in-house monitoring applications. 2.$HIPPO’s$Dashboard$ HIPPO’s Dashboard presents the key metrics for your environment; Elapsed Time by Folder breaks down where Informatica is spending its time in your environment, Dashboard Metrics breaks down activity in a row-based split by aggregating Source, LookUp and Target rows across your environment, Failures vs. Success vs. Rejections; summarizes session activity across your environment by the number of successful and failed executions. Memory % used by Project analyses memory consumption by project over your chosen date & filter range to give you an overall perspective on memory usage by project. CPU % used by Project analyses CPU consumption by project to give a perspective on which Projects are responsible for CPU usage in your environment. Data Movement by Project analyses the volume of data read from Sources and written to Targets across your environment and you can drill down, for instance by selecting a Node filter, and so on. The final chart is the SLA Trending chart, which presents the number of SLAs achieved vs. the number missed for each sample point over the date & time and filter criteria that you have set. If the filter type chosen was Project then this provides a high-level indicator of the health of that project in terms of SLA performance. HIPPO’s Filtering options All of HIPPO’s filtering options are available on the dashboard screen which means that you can select a particular date and time range to be applied to the information displayed or select a filer, for example, NODE, DOMAIN, REPOSITORY, HOST, GRID and Integration SERVICE. You can also filter by PROJECT which is a logical collection of Informatica and non-Informatica processes which is defined by you using the HIPPO Console. Copyright Assertive Software Ltd 2012. All rights reserved. Page 6
3.$Resources$

HIPPO analyses Resource usage by four categories: CPU, MEMORY, DATA MOVEMENT
and FILE DIRECTORIES. Each category contains up to nine charts:

CPU analyses CPU usage by Project and by Node across the Date and Filter criteria that
you have set. HIPPO’s analysis is fully grid compatible. The first five charts provide the
overall CPU resource available in your environment and then breaks down its usage by
Project and by Node.

HIPPO aggregates all of your CPU
resource together grouping Grid and Non-
Grid nodes together to give an overall
perspective of Informatica as a single
service no matter how distributed it is or if
the workflows and sessions are distributed
across your Grid resources. In this
feature’s remaining charts, HIPPO focuses
on the top consumers of CPU resource in
your environment by firstly listing the top
ten consumers of resource. This chart will
include Informatica and non-Informatica
processes to enable you to understand
where your valuable CPU resource is
being consumed. You can drill down from
these charts into an in-depth analysis of
each workflow and session listed.

MEMORY analyses memory resource
usage in a set of eight charts focusing on
Memory availability, usage and top
consumers. In this function HIPPO also presents metrics on Cache by Project and Memory
free by Node to give you a guide to load balancing in your environment and how
successfully it is being achieved.

DATA MOVEMENT provides nine charts which analyze data movement by volume of
Source & Target rows, project and by Node. Again you can apply Date & Time and a
variety of other filters to focus on a particular project or Node. This function in HIPPO is
often used as a recharge mechanism to enable projects to be recharged for use of a
shared Informatica central service, sometimes referred to as a ‘Hub’.

The fourth category in the Resources option is FILE DIRECTORIES which is there to help
HIPPO Users meet the challenge of high disk space demand often relating to large log
files or unplanned cache spill to disk activity.

4.$Vital$Signs$

Vital Signs is designed to provide an overall view of the health of the services in your
Informatica environment. As well as providing first line support to developers and support
analysts, Vital Signs can also be displayed ‘plasma screen style’ on an Informatica
Administrator’s workstation to constantly monitor your environment in real-time.

   Copyright Assertive Software Ltd 2012. All rights reserved.                           Page 7
There are three options: each provides a color-coded status for each of the Services in
your environment; Integration, Domain and Repository Services are displayed in green for
active and in red if the service is unavailable.

5.$Ac=vity$Monitor

HIPPO’s Activity Monitor Is designed to present a view of all workflow and session activity
from across your entire Informatica estate. There are two views;

Live View offers a real-time perspective on all of the workflows and sessions that are
running across your entire estate. There is no need to connect to individual Integration
services or Repositories: instead HIPPO handles all of that for you to enable a 360-degree
perspective on active processes.

Activity Monitor’s Historic View groups all of the workflows and sessions, which have
executed across your environment. The Date & Time and other Filter options are now
available which means that you select activity from a particular date & time range or an
individual Project, Node, Repository, Domain, Grid or Integration Service. Any combination
of the above filter criteria can be applied to the Historic View.

You can drill down into the details of individual Sessions and Workflows from anywhere
within the Activity Monitor to access all of the salient details from the session execution
including the reason for failure. This focus on the key information means that the support
analyst need not trawl the log file to diagnose the reason for failure but instead use HIPPO
to go direct to the issue which has triggered the failure.

  Copyright Assertive Software Ltd 2012. All rights reserved.                         Page 8
6.$Search

Search at Folder, Workflow and Session level: HIPPO enables you to search by a name,
or part of a name with or without a date and time of execution. Search by Resource
Usage: HIPPO enables you to search for individual executions of workflows and sessions
which have exceeded a CPU threshold (in CPU seconds), a
Memory threshold (in MBs), individual cache size (in MBs),
Cache Spilled to Disk or Time to First Row (in seconds).
Search for Executed SQL enables a User to search by a fully
resolved SQL statement. Lastly the SQL override Search
facility enables us to identify all sessions which have used this
feature which has a significant effect on Informatica’s
generation of automatic memory settings.

7.$Analysis

This is HIPPO’s Tuning workshop to enable you to focus your
remediation efforts on those workflows and sessions most
likely to result in performance improvements. There are four sub-functions within the
Analysis feature: Folder Analysis, Top Workflows, Top Sessions and Trending.

The Folder Analysis feature enables you to focus on an individual folder to identify top
Workflows by elapsed time, Data movement and concurrency metrics.

The Top Workflows examines the highest consumers of CPU, Memory, Data Movement
and elapsed time in your environment. All filters apply so you can focus on a particular
Project for your analysis. Drill down directly from here to HIPPO’s Workflow$feature.

The Top Sessions examines the Sessions which are the highest consumers of CPU,
Memory, Data Movement and elapsed time in your environment. As above, all filters apply
so you can focus on a particular Project or Repository for your analysis. Drill down directly
from here to HIPPO’s Task$feature for an in-depth analysis of an individual Session.

The Trending feature analyses Node-level load metrics by any of HIPPO’s filter criteria.

                                                                An example
                                                                chart from
                                                                Analysis /
                                                                Top Sessions
                                                                showing
                                                                Sessions by
                                                                Elapsed
                                                                Time
8.$Workflow

In the Workflow option HIPPO presents a detailed examination of an individual Workflow
performance via three options: Execution, Workflow Trends and History to gain a full
perspective of a single execution of a Workflow in the context of its execution trends.

  Copyright Assertive Software Ltd 2012. All rights reserved.                           Page 9
9.$Task
Task presents a detailed examination of an individual Task in five menu categories:
Transformations, Data Movement, Resources, Task Trends and Historical Analysis. This is
where HIPPO analyzes performance at the lowest level to enable you to identify
performance bottlenecks and incorrect session configuration settings.
(Detail from Task / Data
Movement showing the
commit point profile over
the execution period of
an individual Session)
10.$Capacity$Planning
Capacity Planner groups all of HIPPO’s trending charts into a single place to enable
Capacity Planners to understand trends in Data Movement, CPU and Memory usage by
Project and by Node. Trend all the way back to when HIPPO was installed.
(detail from Capacity
Planner showing Memory
usage by Project)
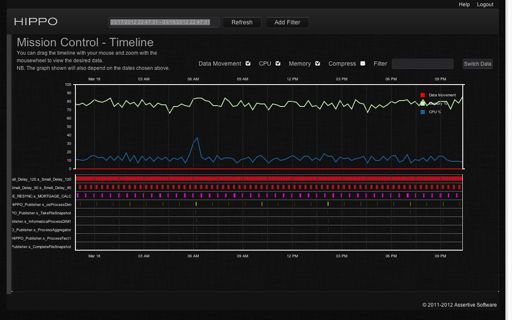
11.$Timeline
Timeline feature offers a unique perspective on how the resources available in your
environment are being shared between and consumed by the workflows and sessions that
are active at any point in time. Use the bar at the bottom of the screen to move along the
timeline and then zoom in on a particular point in time.
Copyright Assertive Software Ltd 2012. All rights reserved. Page 10Summary
HIPPO’s scope is wide. As the chart below illustrates, HIPPO collates data from across the
Informatica and Infrastructure technology stack.and it is the ability to correlate this data at
a granular level that is key to HIPPO’s ability to monitor and profile your entire Informatica
estate and the Infrastructure on which depends upon and interacts.
21%
10%
12%
Repository
Integration Services
27%
30% HOST / OS
Storage
Network
HIPPO is designed to alert you to issues in your environment, to help you to diagnose the
underlying cause of those issues and to ensure that the corrective steps that you take are
the right ones.
However HIPPO goes further: HIPPO allows you to take a business focused overview of
your Data Integration estate itself and of the Projects that it supports to ensure your Data
Integration environment is optimised to meet business demand now and in the future.
Installation Process and Platform Support
HIPPO can be rapidly installed using HIPPO’s wizard-driven installation process to enable
you to begin monitoring and profiling your environment immediately.
HIPPO supports version 8.6.1 to version 9.x of the informatica PowerCenter product.
HIPPO can be installed on any of the range of platforms supported by version 9.x of
PowerCenter. These platforms include Windows, Linux and Unix. HIPPO is shipped with
its own built-in Apache Web Server and PostgreSQL database but can also be installed
using your own Apache installation (Version 2.2 and above) and Oracle (Version 11g and
above). HIPPO requires two gigabytes of disk space for initial installation.
About Assertive Software Ltd
Assertive was founded in the UK in 2010 by a team of Data Integration and Infrastructure
specialists to bring new and innovative software products to the Data Integration market.
Since our inception we have been shortlisted for a number of Industry awards including the
nomination of HIPPO as a finalist in the 2012 Informatica Innovation Awards and being
awarded the runner-up prize in the 2012 Most Valuable Partner competition run by the
Informatica Marketplace division. Find out more about HIPPO and Assertive Software at
our website www.seetheippo.com where you will find a wealth of material including a
library of short videos which demonstrate the use of each of HIPPO’s key features.
Copyright Assertive Software Ltd 2012. All rights reserved. Page 11Appendix
HANC Notification Rules Summary
Exceptions Deviations SLA / KPI
Service Goes Down Zero Records Read/Written/In SLA on W'flow
Look Up Cache start time
Rejected Records Session/Workflow elapsed time SLA on W'flow
end time
Session/Workflow Failure Source Rows /Target Rows Rows
Processed
Waiting Session warning Lookup Cache # of Rows Elapsed Time
Continuous Throughput Rule Lookup Cache build time Read rate
Read Throughput Lookup Cache size Write rate
Write Throughput Aggregator Cache # of Rows
Integration Service CPU Aggregator Cache build time
Integration Service Memory Aggregator Cache size
Process CPU Sorter Cache # of Rows
Process Memory Sorter Cache build time
Specific directory > threshold value Sorter Cache size
Workflow/Session CPU Threshold Joiner Cache # of Rows
Session Cache Spills to Disk Joiner Cache build time
Workflow/Session Memory Joiner Cache size
Threshold
Time to First Row
Read Throughput
Write Throughput
End of Appendix.
Copyright Assertive Software Ltd 2012. All rights reserved. Page 12You can also read