Failure Mechanism of Pure Epoxy Coating in Near-Neutral Solution Focusing on Coating/Metal Interfaces
←
→
Page content transcription
If your browser does not render page correctly, please read the page content below
Int. J. Electrochem. Sci., 16 (2021) Article ID: 210365, doi: 10.20964/2021.03.67

                                                                          International Journal of
                                                                           ELECTROCHEMICAL
                                                                                   SCIENCE
                                                                                 www.electrochemsci.org

Failure Mechanism of Pure Epoxy Coating in Near-Neutral
Solution Focusing on Coating/Metal Interfaces
Chao Yang1,2,*, Guanjun Wang2, Qing Han2, Haibo Liu2, Anquan Wang2, Liang Sun2
1
  Postdoctoral Scientific Research Workstation of Shengli Oilfield Company, Dongying, 257000,
China;
2
  Technology Inspection Center of Shengli Oilfield, SINOPEC, Dongying, 257000, China
*
 E-mail: yangchao201001@163.com

Received: 30 September 2020 / Accepted: 24 December 2020 / Published: 31 January 2021

Electrochemical impedance spectroscopy (EIS) can provide a rapid and convenient method for
evaluating the coatings' anti-corrosion performance, especially for analyzing the evolution of water
diffusion. However, due to the coating/metal interfaces' limitation, the electrochemical reaction at
interfaces is still not elucidated. Therefore, focusing on coating/metal interfaces, this paper investigates
the coating failure mechanism on the coated X80-matrix with pure DGEBA coatings and the formation
process of Fe3O4 at interfaces.

Keywords: Epoxy coating; X80-matriax; Near-neutral; Fe3O4; Cathodic protection

1. INTRODUCTION

        Organic coatings are widely used in the anti-corrosive protection of buried pipelines. These
coatings isolate the pipelines from corrosive media and enhance the efficiency of the cathodic
protection. However, the coating's failure caused by the corrosive media diffusion could also be severe,
being a hot research topic for a long time, especially focusing on the electrochemical reaction at
coating-metal interfaces [1].
        Generally, the hydrogen bonds formed by water molecules and polymers are more stable than
the coating-metal bond. Therefore, when water molecules reach the coating/metal interface, the
fracture of the coating-metal bond occurs, causing the coating delamination [2-4]. However, in the
study of Nazarov et al. [5], the reversibility of the coating-metal bonding bond on the interface was
proved. Similarly, Leng et al. [6,7] used FTIR to prove that even a large number of water molecules
gathered on the interface, the delamination of coating-metal system would not take place. Therefore,
the electrochemical reaction process at the interface is the main cause of coating failure [8,9].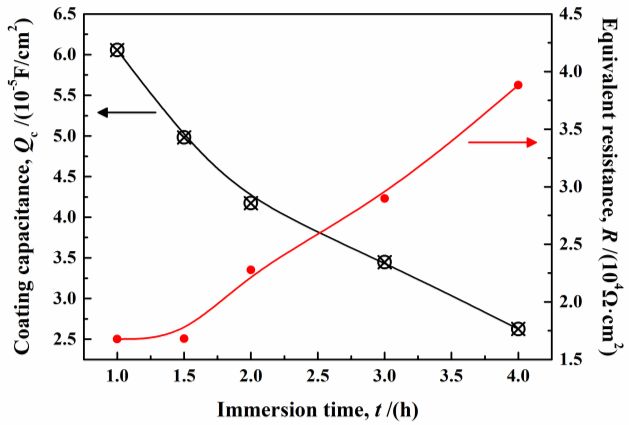
Int. J. Electrochem. Sci., 16 (2021) Article ID: 210365                                                 2

        Electrochemical impedance spectroscopy (EIS) provides a rapid and convenient method for
evaluating the coatings' anti-corrosion performance, where the fitted equivalent circuits can represent
the changes of related parameters (such as coating layer capacitors or resistors) and then further
analyze the failure behaviors. Because of the complexity of the coating structure and composition as
well as the limitation of the coating/metal interfaces, so far, a large number of publications have used
electrochemical tests to describe the changes of electrochemical parameters in the process of
immersion, and then described the process of coating failure from a macro point of views such as the
maximal phase angle and time constant.
        However, the researches focusing on the failure of the coatings caused by corrosive media
diffusion still have their limitations: (1) the relationship between fitted parameters from EIS and the
influence of the corrosive medium on the physical/chemical properties of the coatings is not well-
established, which leads to the inconsistency in the selection of equivalent circuits and the
determination of key factors in the failure behavior of the coatings. (2) Due to the coating/metal
interfaces' limitation, it is challenging to analyze the electrochemical reactions at interfaces directly.
        Therefore, in this paper, pure DGEBA epoxy coating applied on X80-matrix was used as the
main sample to explore the 3 wt.% NaCl solution's diffusion process. Focusing on coating-metal
interfaces, this paper targeted to explore the failure mechanism of epoxy coatings in near-neutral
solutions using an electrochemical method (EIS).

2. EXPERIMENTAL SETTINGS

2.1 Samples

        Working electrodes used in this work were obtained from an X80-matrix sheet. The steel
samples were sliced into 25×25×2 mm3 cubes, where the fringe effect was ignored [10], and they were
embedded in epoxy resin, leaving a working area of 25×25 mm 2. The specimen preparation was
controlled carefully to ensure that no grooves and bubbles were generated at the epoxy/steel interface.
The specimen's working surface was subsequently ground with sandpapers (800 and 1000 grit),
cleaned by distilled water and methanol, and dried [11].
        The experimental coating was a sample of DGEBA coating produced by Anhui Wuhu. The
weight ratio of epoxy resin to curing agent was 10:1, and the density was 1.28 g/cm 3. The coating was
applied on the surface of the X80-matrix (25×25 mm2) by a hand brush and cured for 7 days at room
temperature (25 ℃). The coating sample thickness was determined by QNIX8500 gauge through the
five-point sampling method to the final 25±5μm with a glass transition temperature of Tg=123 ℃.

2.2 Electrochemical test

        The electrochemical parameters were obtained by equivalent electric circuits by commercial
software of “ZimpWin” software. The test solution was formed by NaCl and deionized water, and
glacial acetic acid and hartshorn were used to adjust the pH of the test solution.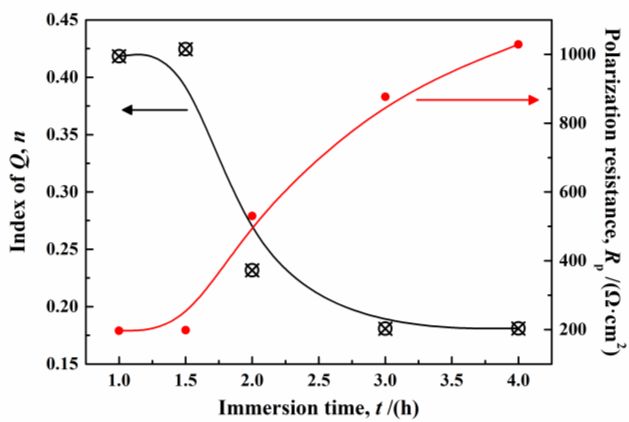
Int. J. Electrochem. Sci., 16 (2021) Article ID: 210365 3
The reference electrode was positioned close to the electrode surface (≤2mm). Thus, the effect
of ohmic drop on the potential measurement was negligible.
EIS measurements were quantified in the nominal frequency range of 105~10-2 Hz, and all
experiments were carried out in constant temperature-humidity chamber "GDJS-408" at temperature
25 ℃. The electrochemical parameters were obtained by equivalent electric circuits, using "ZimpWin"
software.
3. RESULTS AND DISCUSSION
3.1 Analysis of open-circuit potential (EOCP)
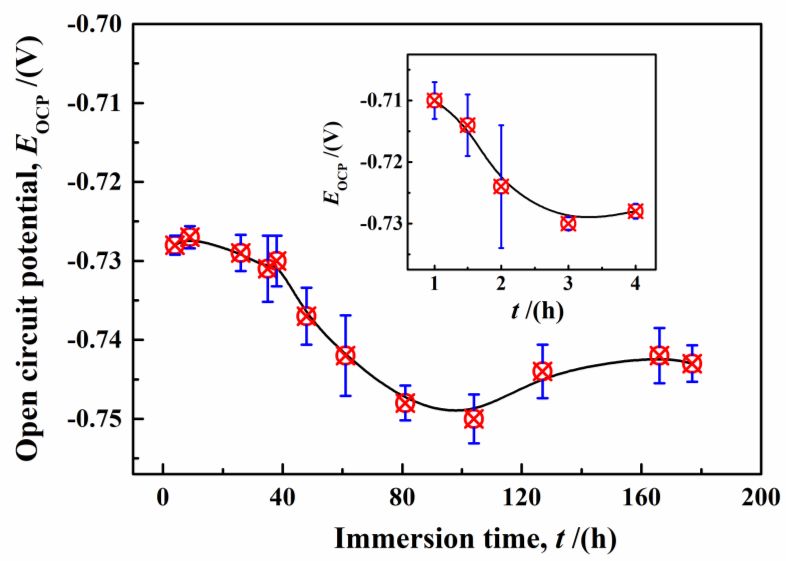
Fig.1 shows the changes in the open-circuit potential (EOCP) curves. The variation of the EOCP
curve could be divided into four stages:
(i) The first stage was found to be in the range of 0~3 h, where the coating's anti-corrosion
performance gradually decreased due to the diffusion of the electrolyte solution, showing an increasing
corrosion tendency [12-14] with a decreasing EOCP of -0.710→-0.728 V.
(ii) In the second stage (between 4~38 h), the EOCP decreased slightly (-0.728→-0.730 V).
Relevant studies suggested that in different coating systems, the time for the corrosive solution to
reach the coating/metal interface is about 7~8 h [15]. Therefore, in this stage, the cause of the slight
decrease in EOCP can be attributed to the corrosive medium reaching the coating/metal interface to form
the double electrical layer.
(iii) The third stage was between 38~104 h, where the EOCP decreased significantly (-0.730→-
0.750 V). Under these conditions, the double electrical layer at the coating/metal interface was formed,
suggesting that the coatings' micro-porous diffusion paths were established. Therefore, a large amount
of solution entered into the coating, leading to the epoxy coatings' degradation failure behavior [16].
(iv) In the fourth stage (104~177 h), the EOCP increased and remained unchanged. Since the
building of a large number of diffusion channels, the corrosive medium reached the coating/metal
interface to accelerate the electrochemical reaction. Afterward, the corrosion products at interfaces
diffused reversely into the epoxy coatings to block the diffusion paths, illustrated by the increase of
EOCP [17-19]. However, some researchers say that the increase of EOCP in this stage may be caused by
the interaction of water and functional groups of the epoxy coatings, increasing cross-linking density.
This explanation was linked to DGEBA epoxy coatings' characteristics, where the penetration of the
water molecules into the coatings may lead to the aggregation of small molecular fragments to form a
long polymer chains and then cause the increase of cross-linking density [20,21].
When the immersion time was higher than 1000 h, the epoxy coating was completely stripped
from the metal, and the metal was directly exposed to the corrosive medium. In this case, the EOCP
decreased until it remained unchanged (-0.77 V), which was equal to the EOCP of the uncoated X80
steel in 3 wt.% NaCl solution [22].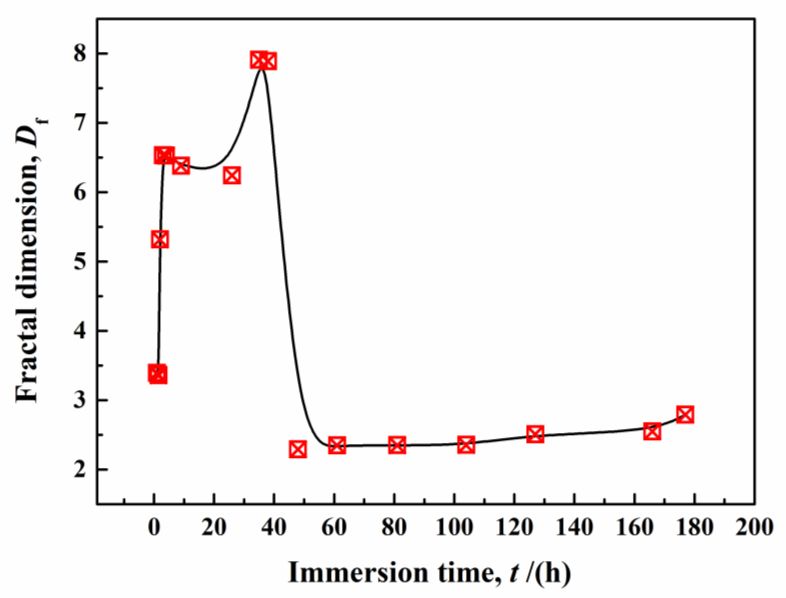
Int. J. Electrochem. Sci., 16 (2021) Article ID: 210365                                           4

Figure 1. Change of open circuit potential of coated X80-matrix in 3 wt.% NaCl solution (immersion
       time of 0~177 h, temperature - 25 ℃)

3.2 Analysis of electrochemical impedance spectroscopy (EIS)

        Generally speaking, in the initial stage of water diffusion, the coating behaved as a well-
performing capacitor to block the entering water, as the Nyquist diagrams showed a "standard" arc of
capacitive behavior [23], which was far from the curve tested in this paper.

Figure 2. Comparison of different equivalent circuit of Nyquist diagram of coated X80-matrix in 3
      wt.% NaCl solution (immersion time of 15 min, temperature - 25 ℃): (QR), (CR) and (Q(RO))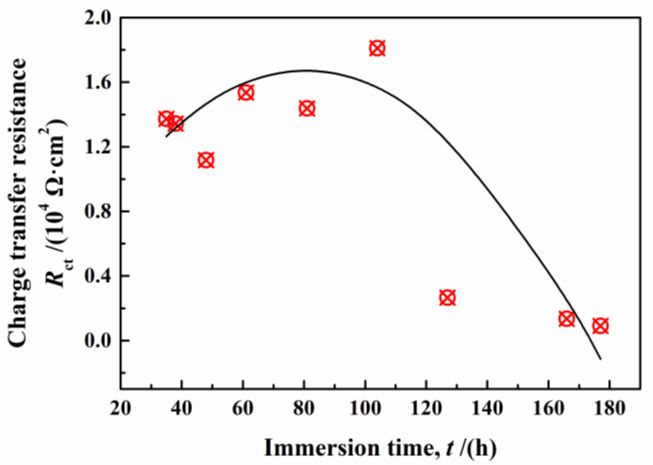
Int. J. Electrochem. Sci., 16 (2021) Article ID: 210365 5
Fig.2 shows the comparison between different fitted and measured curves at 15 min. Assuming
that the coating systems were uniform, their equivalent circuit should be (RC) a series of red curve
circuits. Considering the coatings' dispersion effect, the constant phase Angle element Q was used to
replace the pure capacitor C, in which its equivalent circuit was the (QR) series circuit in the blue
curve. However, the test curve in this paper was Q(RO) in black, which the main character was
different from the (RC) and (QR). At the high frequency of 105 Hz, the imaginary impedance deviated
from (QR), reflecting a blocked ion diffusion process. Meanwhile, the error of Q(RO) was less than
3‰. Therefore, Q(RO) was selected in the initial stage of water diffusion to describe the water
molecules' finite-layer diffusion process in coatings.
The finite layer diffusion element (O) was applied to describe the resistance of the coatings to
water diffusion, which can be expressed as follows [24]:
ZO =
1
YO j
tanh B j (1)
Where, YO was the capacitance of finite layer diffusion element in F/cm2 and B was the index.
The following equation can express the diffusion impedance in a finite layer:
Rw B / YO (2)
Therefore, the equivalent resistance can be described as follows:
R Rp Rw (3)
The EIS investigations of coated X80 steel in 3 wt.% NaCl solution at 20 ℃ were carried out.
The diffusion process of water in coatings can be divided into three stages: (i) the diffusion of water in
coatings; (ii) the formation of the double electrical layer at coating/metal interface and the (iii)
electrochemical reaction at coating/metal interfaces. The EIS curves are presented in Fig.3.
In the initial stage (0~4 h), there was only one capacitive arc in the Nyquist diagram and a
"peak" in logf-φ curve, suggesting a constant time to describe the water diffusion in micro-pores.
Therefore, the equivalent circuit was Rs(Qc(RpO)): Rs as solution resistance, Qc as coating capacitance,
Rp as polarization resistance and O as the limited diffusion layer capacitance.
With further diffusion of water, in the second stage (9~26 h), the imaginary impedance at
5
10 Hz in the Nyquist diagram increased gradually to tend to (QR) series circuit at 9 h, where the water
reached the coating/metal interface, and the diffusion paths in the coating were established, suggesting
the disappearance of the physical shielding effect of the coatings [25]. However, since the water
molecules had just arrived on the coating/metal interface, the water on the interface was not expanded,
and the double electric layer was not formed. Therefore, it was mainly the double electric layer
formation process present until 26 h. Therefore, the equivalent circuit was Rs(Qc(Rc(CdlRct)): Rs as the
solution resistance, Qc as the coating capacitance, Rc as the coating resistance, Cdl as the double-layer
capacitance and Rct as the charge transfer resistance.
In the third stage (35~177 h), once the electrochemical reaction at interfaces took place, the
Nyquist diagrams showed small capacitance characteristics at high frequencies and large capacitance at
low frequencies. Considering the single-molecule coating adopted in this paper, the coating was
considered to be uniform. Therefore, the equivalent circuit was described as the series circuit of the
electric double layer and coatings. As the diffusion paths were fully established, the electrochemical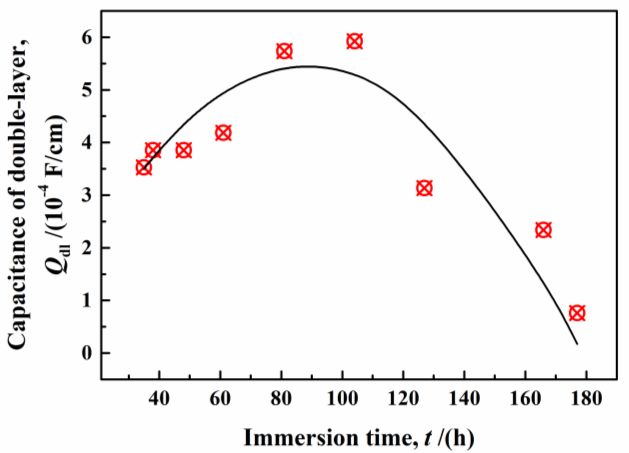
Int. J. Electrochem. Sci., 16 (2021) Article ID: 210365                                         6

reactions at coating/metal interfaces were affected by the coatings' nature, so the Qdl was placed
forward to replace the pure capacitance (Cdl).

                                               (1) 1~4 h

                                              (2) 9~26 h

                                             (3) 35~177 h

Figure 3. EIS analysis of coated X80-matrix in 3 wt.% NaCl solution in 3 wt.% NaCl solution
      (immersion time of 1~177 h, temperature - 25 ℃)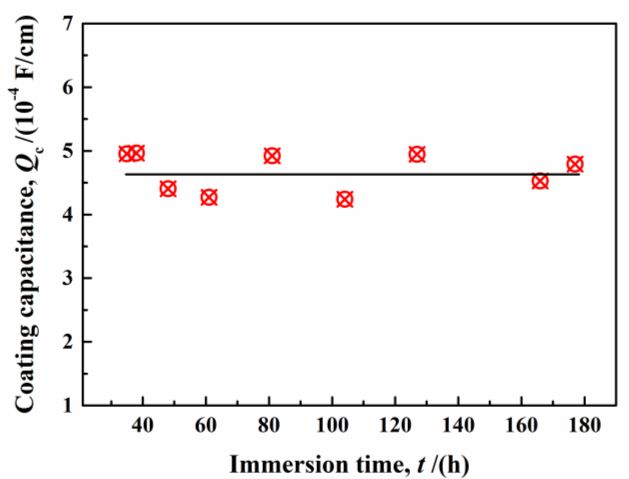
Int. J. Electrochem. Sci., 16 (2021) Article ID: 210365                                                 7

       Finally, the equivalent circuit of Rs(QcRc)(QdlRct) was established - Rs as solution resistance, Qc
as coating capacitance, Rc as coating resistance, Qdl as electric double-layer capacitance, Rct as the
charge transfer resistance.

(1) The diffusion of water molecules in coatings in the initial stage (immersion time of 0~4 h)

        Fig.4 shows the variation of the coating capacitance (Qc), equivalent resistance (R), index of Q
(n) and polarization resistance (Rp) in immersion time of 1~4 h. The results showed that the Qc
decreased while the diffusion values of Rw and Rp increased, which phenomena contradict the
traditional view that the coating degraded due to the water diffusion, showing an increasing
capacitance and a decreasing resistance. Although the experimental phenomena in this paper were
already reported [26], the phenomena were assigned to the water leading to an increasing cross-linking
density of the coatings. The water diffusing into the coatings promoted the movement of macro-
molecule chains, resulting in more adsorption sites between the polymer chains to enhance the cross-
linking density.
        The conclusion about the increase of cross-linking density of the coating caused by water
diffusion can be confirmed by two other parameters of n and Rp, as shown in Fig.4. As water diffused,
with the diffusion process's progress, n decreased from 0.42 (t=1.0 h) to 0.18 (t=4.0 h), tending to a
resistance characteristic. Meanwhile, Rp increased from 196.9 Ω·cm2 to 1029 Ω·cm2, showing that the
water molecules promoted the further cross-linking between coating chains. However, the time
constant of τ=Q·R≈0.965 s remained basically unchanged, indicating that there was only a water
diffusion process in this stage.

Figure 4. Changes of coating capacitance (Qc), equivalent resistance (R), index of Q(n) and
      polarization resistance (Rp) of coated X80-matrix in 3 wt.% NaCl solution (immersion time of
      1~4 h, temperature - 25 ℃)

        Theoretically, within the tested frequency range (105~10-2 Hz), as the coatings' phase angle (φ)
closer to 90°, a higher waterproof performance can be obtained. However, the maximal φ was ≈35°, far
less than 90°, which seemed to reflect the "poor" waterproof performance of the coatings. Meanwhile,
Int. J. Electrochem. Sci., 16 (2021) Article ID: 210365 8
the maximal phase angle frequency (fmax) remained basically unchanged (fmax=1.4874 Hz) during 0~4
h, while the maximal φ gradually decreased by 10.12% (35.145°→31.59°). In the logf-log|Z| curve, the
impedance results presented an inclined line with a slope of about "-1" in 105~10-2 Hz. These results all
proved that the coatings presented pure resistance characteristics in 0~4 h.
(2) Formation of the double electrical layer at the coating/metal interface (immersion time of 9~26h)
According to the Nyquist diagrams, when diffusion time reached 26 h, the charge transfer
process occurred at high frequencies. However, the imaginary impedance reduced slightly at 10 5 Hz,
and the capacitive reactance representing the substance diffusion at a lower frequency slightly changed,
indicating that this period behaved as the formation of the electric double layer at coating/metal
interfaces. The result was following the results of the analysis of Bode plots. The second time constant
representing double-layer capacitance appeared at f=126.9 Hz in the logf-φ curve, while the logf-log|Z|
curve showed a straight line with a slope of "-1".
Compared with the first stage (0-4 h), the Qc increased slightly (5.96→6.06×10⁻⁵ F/cm2), equal
to the value observed at t=1.0 h. Furthermore, the Rc increased with the immersion time
(1580→2654Ω·cm2), showing a further cross-linking process.
Fig.5 shows the variation of the capacitive reactance characteristics at high-frequencies over
immersion time. From the analysis discussed above, it can be observed that the second stage (9~26 h)
was mainly described with the formation of the electric double layer at the coating/metal interfaces.
With the increase of the immersion time, the capacitive reactance at high frequencies changed little
during 26~46 h, meaning that the electric double layer formation was completed at ≈26 h.
Figure 5. Change of high-frequency capacitance reactance arc of coated X80-matrix in 3 wt.% NaCl
solution (immersion time of 9~46 h, temperature - 25 ℃)Int. J. Electrochem. Sci., 16 (2021) Article ID: 210365 9
(3) Electrochemical reaction at coating/metal interfaces in immersion time of 35~177 h
As the water diffusion went on, capacitance-resistance characteristics at high frequencies
gradually disappeared. Meanwhile, the logf-log|Z| curve was divided into two sections by the
frequency f=1 Hz in Bode plots, representing the double electric layer at the high-frequency area and
the coatings at low frequency, respectively. In the range of 105~10-2 Hz, the impedance of material
diffusion (f=10-2 Hz, |Z|=2923→1680 Ω) and the charge transfer resistance (f=105 Hz, |Z|=154→67 Ω)
decreased gradually with the immersion time, characterized by the degradation process of the
coating/metal system. Therefore, the two aspects could be analyzed in detail as follows.
a) Electrochemical reaction at coating/metal interfaces
Fig.6 shows the variation of capacitance characteristics at high frequency. As the water
diffusion continued, the capacitive reactance arc at interfaces gradually reduced, as the capacitance
characteristics (imaginary impedance, Zim) and the resistance characteristics (real impedance, Zre) in
the time of 35~104 h decreased (Zre=615→409 Ω·cm2, Zim=2159→1600 Ω·cm2). However, at 166 h,
Zre=58 Ω·cm2 and Zim=403 Ω·cm2, indicated that the falling rate in 104~166 h was enlarged by about
300%.
At high-frequency, the logf-φ curve showed similar characteristics between 35~166 h. Within
35~104 h, the maximal φ decreased from 13.7° to 11.7°, while the fmax increased from 221 Hz to
1172Hz. At 166 h, the peak value of the high frequency basically disappeared.
Figure 6. Change of high-frequency capacitance reactance arc of coated X80-matrix in 3 wt.% NaCl
solution (immersion time of 37~177 h, temperature - 25 ℃)Int. J. Electrochem. Sci., 16 (2021) Article ID: 210365 10
Fig.7 shows the changes of double-layer capacitance (Qdl) and charge transfer resistance (Rct).
Both values showed a trend of increase first (35~104 h) and decreased between 104~166 h. At
35~104h, due to the increase of the concentration gradient, the double-layer thickness was compressed,
leading to an increasing of the Rct value. However, at 104~166 h, the macro phase at coating/metal
interfaces was developed, meaning that the double-layer disappeared, and the bubble phenomenon of
the coatings was heightened. At this time, it can be theoretically considered that the double-layer
thickness increased with the decrease of Qdl and Rct.
b) Decrease of anti-corrosion performance of the coatings
In the low-frequency region, the maximal φ increased from 29.4° to 37.1°, while the
corresponding fmax decreased from 0.09 Hz to 0.03 Hz, which indicated that the material diffusion
process dominated the whole process.
Figure 7. Changes of coating capacitance (Qc), coating resistance (Rc), capacitance of double-layer
(Qdl) and charge transfer resistance (Rct) of coated X80-matrix in 3 wt.% NaCl solution
(immersion time of 37~177 h, temperature - 25 ℃)
Accordingly, the diffusion paths within the coatings until 26 h were established, which meant
that the further diffusion could not affect the changes of the physical structure of the coating itself, soInt. J. Electrochem. Sci., 16 (2021) Article ID: 210365 11
the coating capacitance was unchanged (Qc=4.67×10⁻⁴ F/cm2). However, in the third stage (104~166 h),
the coating resistance (Rc) presented the rules of first increase (35~104 h) and subsequent decrease
(104~166 h). The main reasons involved two aspects: (1) Depending on the well-defined diffusion
paths, a large number of ions diffused into the coatings, inducing a decrease of the Rc value; (2) The
electrochemical reaction at interfaces was intensified due to the presence of the ions, and then higher
amount of corrosion products diffused inversely into the coatings and accordingly blocked the
diffusion paths, increasing the Rc. The results of this analysis were following the value of EOCP.
3.3 Analysis of coating failure due to interfacial electrochemical reactions
In the near-neutral solution (3 wt.% NaCl), when the corrosive medium reached the
coating/metal interface, the anode activated the metal corrosion process (Fe→Fe2++2e-), and the
cathode performed the O2 depolarization process (O2+2H2O+4e-→4OH-). In this case, the
alkalinization and the corrosion products at interfaces destroyed the coating-metal bond, which
accelerated the coatings' delamination. Furthermore, due to the limitation of the coating-metal interface,
once the O2 at the interfaces was exhausted, it was extremely difficult to replenish O2, thus developing
an oxygen concentration cell. Under these circumstances, the metal at interfaces worked as an anode
during the corrosion process. At the same time, due to the hydrolysis of Fe 2+
(Fe2++2H2O→Fe(OH)2+2H+), the pH at interfaces changed from alkaline to acidic [27], which
accelerated the dissolution of the metal. The oxygen concentration gradient formation promoted
corrosion products' aggregation at the interface, and the corrosion products overflowed through the
micro-pore diffusion paths, covering the surface of the sample.
The fractal dimension (Df) was used to describe the coating-metal interfaces [28,29]: the higher
roughness induced a greater fractal dimension. In EIS analysis, the index (n) of constant phase angle
element (Q) reflected the material-interface heterogeneity related to the fractal geometry, as shown in
Eq.(4). In this paper, the fractal dimension can reflect the degree of corrosion reaction at interfaces and
preliminarily determine the time of electrochemical reaction.
1
Df 1 (4)
n
Fig.8 shows the changes in fractal dimensions (Df) in immersion time of 1~177 h. The whole
curve was divided into three stages. (i) During the first stage (0~4 h), the corrosive medium entered
into the coatings, leading to increased inhomogeneity of the coatings, manifested as the increase of
fractal dimension. (ii) In the second stage (9~26), the corrosive stage had reached the coating/metal
interfaces to form a double-layer; therefore, the fractal dimension basically remained unchanged. (iii)
In the final (35~166 h), the fractal dimension increased rapidly in 35~38 h and then decreased sharply
after 48 h. This behavior occurred as the electrochemical reaction locally began to damage the metal
interface's integrity after 35 h, and subsequently, the electrochemical reaction occurred at whole
interfaces. Therefore, the fractal dimension firstly reduced rapidly and then increased a little linearly
(R2=0.823).Int. J. Electrochem. Sci., 16 (2021) Article ID: 210365 12
Figure 8. Change of fractal dimension of coated X80-matrix in 3 wt.% NaCl solution (immersion time
of 1~177 h, temperature - 25 ℃)
Fig.9 shows the corrosion mechanism at coating/metal interfaces.
(i) When corrosive medium (including H2O/Na+/Cl-/O2) reached the coating/metal interfaces,
the anodic process was dominated by the dissolution of metal (Fe→Fe2++2e-), and the cathode was the
place of the depolarization process of oxygen (O2+2H2O+4e-→4OH-). At this time, the pH at the
interface increased and then destroyed the coating-metal bond.
Figure 9. Corrosion mechanism at coating/metal interfaces in near-neutral solutionInt. J. Electrochem. Sci., 16 (2021) Article ID: 210365 13
(ii) When the oxygen on the interface was exhausted, an oxygen concentration gradient was
formed, accelerating the metal-matrix's corrosion. Meanwhile, the Fe2+ promoted H+/Had combined to
generate H2, leading to a macroscopic bubble phenomenon on the coatings' surface. The effect of the
immediate corrosion product (Fe(OH)2) on the failure of the coating was mainly reflected in two
aspects: a) a part of Fe(OH)2 reached the coating surface via the diffusion paths and then formed a red-
brown precipitate - Fe(OH)3; b) the other part of the Fe(OH)2 transformed into a dense black Fe3O4
[30].
4. CONCLUSION
In this paper, the failure process of the epoxy coatings in a near-neutral solution was analyzed
by electrochemical experiments. The main conclusions were as follows:
(i) In a near-neutral environment, the electrochemical reactions at coating/metal interfaces were
prerequisites for the coating failure. Once the corrosive medium reached the interfaces, the
electrochemical reaction promoted the destruction of the coating/metal bond to accelerate the
delamination and destroy the physical structure of the coatings due to the corrosion products entering
the coatings.
(ii) Focusing on the electrochemical reaction at interfaces, the dynamic mechanism was put
forward in a near-neutral solution, especially for the formation reaction of the dense Fe3O4.
References
1. C. Yang, X. Xing, Z.L. Li, and S.X. Zhang, Polymers-Basel, 12 (2020) 138.
2. C.F. Dong, A.Q. Fu, X.G. Li, and Y.F. Cheng, Electrochim. Acta, 54 (2008) 628.
3. B. Wessling, and J. Posdorfer, Electrochim. Acta, 44 (1999) 2139.
4. A. Miszczyk, and T. Schauer, Prog. Org. Coat., 52 (2005) 298.
5. A. Nazarov, and D, Electrochim. Acta, 49 (2004) 2955.
6. A. Leng, H. Streckel, and M. Stratmann, Corros. Sci., 41 (1998) 547.
7. J. Carrasco, A. Hodgson, and A. Michaelides, Nat. Mater., 11 (2012) 667.
8. A. Leng, H. Streckel, and M. Stratmann, Corros. Sci., 41 (1998) 579.
9. A. Leng, H. Streckel, and M. Stratmann, Corros. Sci., 41 (1998) 599.
10. L.V.S. Philippe, S.B. Lyon, C. Sammon, and J. Yarwood, Corros. Sci., 50 (2008) 887.
11. L.Y. Xu, X. Su, Z.X. Yin, Y.H. Tang, and Y.F. Cheng, Corros. Sci., 61 (2012) 215.
12. Y.T. Lin, T.M. Don, C.J. Wong. F.C. Meng, Y.J. Lin, S.Y. Lee, C.F. Lee, and W.Y. Chiu, Surf. Coat.
Tech., 3 (2018) 1128.
13. S.Y. Arman, B. Ramezanzadeh, S. Farghadani, M. Mehdipour and A. Rajabi, Corros. Sci., 77
(2013) 118.
14. H. Hayatdavoudi and M. Rahsepar, J. Alloy. Compd., 727 (2017) 1148.
15. B. Ramezanzadeh, M.H.M. Moghadam, N. Shohani and M. Mahdavian, Chem. Eng. J., 320 (2017)
363.
16. S.M. Park and M.Y. Shon, J. Ind. Eng. Chem., 21 (2015) 1258.
17. B. Liu, Z.G. Fang, H.B. Wang, and T. Wang, Prog. Org. Coat., 76 (2013) 1814.
18. H. Jeon, J. Park, and M. Shon, J. Ind. Eng. Chem., 19 (2013) 849.
19. S. Zheng, and J. Li, J. Sol-Gel Sci. Techn., 54 (2010) 174.
20. F.T. Shirehjini, I. Danaee, H. Eskandari and D Zarei, J. Mater. Sci. Technol., 32 (2016) 1152.Int. J. Electrochem. Sci., 16 (2021) Article ID: 210365 14
21. T.H. Yun, J.H. Park, J.S. Kim and J.M. Park, Prog. Org. Coat., 77 (2014) 1780.
22. H.P. Ji, T.H. Yun, K.Y. Kim, Y.K. Song and J.M. Park, Prog. Org. Coat., 74 (2012) 25.
23. K. Schaefer and A. Miszczyk, Corros. Sci., 66 (2013) 380.
24. B.A. Boukamp, Solid State Ionics, 20 (1986) 31.
25. H. Marchebois, C. Savall, J. Bernard and S. Touzain, Electrochim. Acta, 49 (2004) 2945.
26. X.W. Liu, J.P. Xiong, Y.W. Lv, and Y. Zuo, Prog. Org. Coat., 64(2009)497.
27. R. Hasanov, S. Bilgi, and G. Gece, J. Solid State Electr., 15 (2011) 1063.
28. P. Hammer, F.C. dos Santos, B.M. Cerrutti, S.H. Pulcinelli, and C.V. Santilli, J. Sol-Gel Sci. Techn.,
63 (2012) 266.
29. L. Liu, Y. Cui, Y. Li, T. Zhang, and F. Wang, Electrochim. Acta, 62 (2012) 42.
30. Y. Hua, S.S. Xu, Y. Wang, W. Taleb, J.B. Sun, L. Zhang, R. Barker, and A. Neville, Corros. Sci.,
157 (2019) 382.
© 2021 The Authors. Published by ESG (www.electrochemsci.org). This article is an open access
article distributed under the terms and conditions of the Creative Commons Attribution license
(http://creativecommons.org/licenses/by/4.0/).You can also read