Relationship between air diffusivity and permeability coefficients of cementitious materials
←
→
Page content transcription
If your browser does not render page correctly, please read the page content below

RILEM Technical Letters (2020) 5: 26‐32
https://doi.org/10.21809/rilemtechlett.2020.114

Relationship between air diffusivity and permeability coefficients of
cementitious materials

Yuya Sakai 1*

1
    Institute of Industrial Science, The University of Tokyo, Japan

Received: 05 June 2020 / Accepted: 28 August 2020 / Published online: 04 September 2020
© The Author(s) 2020. This article is published with open access and licensed under a Creative Commons Attribution 4.0 International License.

Abstract
In this study, a straight circular tube was used to represent a capillary pore and theoretically investigate the relationship between the diffusion and air
permeability coefficients. First, an equation to correlate the air diffusivity and permeability in a straight circular tube was derived. Then, data were collected
from previous studies in which both the air diffusivity and permeability were measured, and the applicability of the derived equation to cementitious
materials was verified. Although a correction factor was not used, the two datasets exhibited good quantitative agreement. This indicates that the derived
equation can be applied to cementitious materials, including concrete, and the measured air diffusivity can be converted into concrete permeability (and
vice versa) using the derived equation.
Keywords: Air permeability; Diffusion; Concrete; Mortar; Cement paste

        Introduction                                                                conducted air permeability tests on actual structures in Japan
                                                                                    and overseas [14, 15] (Fig. 1). However, it is unclear whether
Evaluation of concrete durability is becoming increasingly                          the actual penetration of oxygen or carbon dioxide due to
important for rational design and maintenance. Carbon                               diffusion can be evaluated using the air permeability test. The
dioxide and oxygen are important deterioration factors for                          correlation between the air diffusivity and permeability
reinforced‐concrete structures, as they cause carbonation of                        coefficients has been reported [16–19], but no method for
the concrete and corrosion of the reinforcement [1].                                converting the air permeability into the diffusivity has been
Therefore, appropriate evaluation of the resistance to gas                          established. Once the relationship between the air diffusivity
penetration should be performed to assess the potential or                          and the permeability is established, the penetration of carbon
durability of concrete structures. Generally, air diffusivity                       dioxide and oxygen can be estimated according to the air
tests [2,3] or air permeability tests [4–6] are conducted to                        permeability measured with a simple experimental setup or
evaluate the air penetration in concrete. The driving force in                      even non‐destructive testing.
the former case is the concentration gradient of the relevant
                                                                                    The author has investigated the relationships between the
gas, whereas that in the latter case is the pressure gradient.
                                                                                    various pore‐structure indicators of cementitious materials
The conditions in a diffusivity test are closer to the real
                                                                                    and ion, air, and water transfer. Among the indicators, the
conditions of oxygen and carbon‐dioxide penetration in
                                                                                    total porosity had the strongest correlation with chloride‐ion
concrete. However, the experimental setup of the diffusivity
                                                                                    diffusion [20], and the threshold pore diameter obtained
test is complex because the pressures on the two flat surfaces
                                                                                    using the method proposed by the author had the strongest
of the sample plate should be kept equal, and the gas
                                                                                    correlation with air and water permeabilities [21, 22] and air
concentration should be monitored during the test.
                                                                                    diffusion [23]. These relationships indicated that air
In air permeability testing, the volume of air penetrating the                      permeability can be empirically converted into the air
concrete due to a pressure gradient is determined by                                diffusion (and vice versa) by using the threshold pore
measuring the volume of air penetration or air pressure. This                       diameter as an indicator, but the results may have low
test can be conducted using a relatively simple setup.                              accuracy.
Recently, devices for in situ investigation of the air
permeability have been developed [7–13]. The author has

* Corresponding author: Yuya Sakai, Email: ysakai@iis.u‐tokyo.ac.jp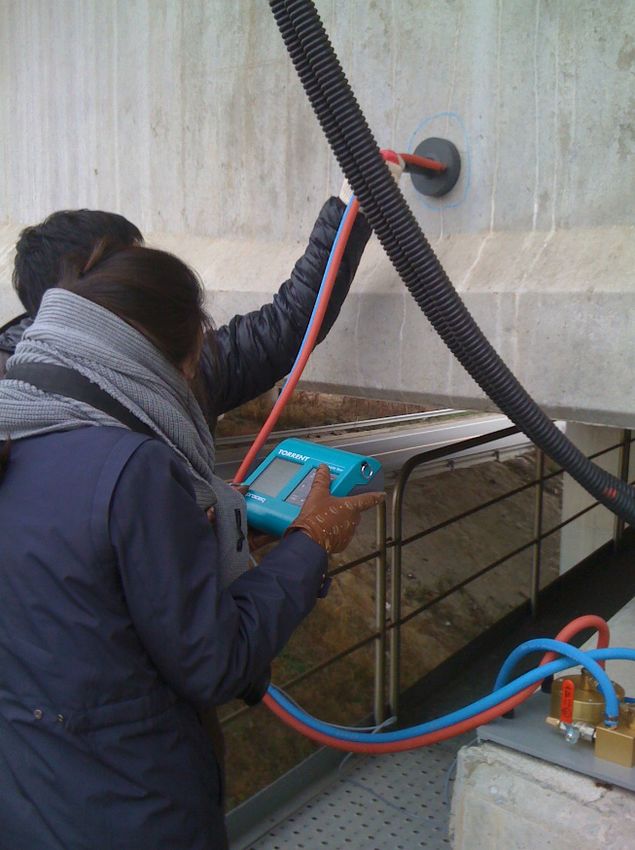
Y. Sakai, RILEM Technical Letters (2020) 5: 26‐32 27
Derivation of theoretical equation
Airflows can be divided into two main types: molecular and
viscous. In a molecular flow, collisions between air molecules
and the wall are dominant and occur in a small space or
depressurised condition. In a viscous flow, collisions between
air molecules are dominant and occur in a large space or
pressurised condition. The dominant flow can be determined
by examining the Knudsen number, which is calculated as
follows [24]:
, (1)
Kn
a Ls
where λ represents the mean free path (m), which is the
average distance travelled by a gas molecule between
successive impacts, and Ls represents the characteristic length
(m), which corresponds to the diameter of the pipe or pore. λ
can be calculated as follows [25]:
1 k BT ,
(2)
2 Pd 2
where kB is the Boltzmann constant (1.3807 × 10‐23 N∙m/K), T
represents the temperature (K), P represents the pressure
(Pa), and d represents the molecular diameter (m).
In general, a flow with Kn < 0.01 is considered to be viscous, Kn
> 1 is considered to be molecular, and 0.01 ≤ Kn ≤ 1 is
considered to be transient [24, 26]. When the molecular flow
b is dominant, the molecular diffusion coefficient through the
tube Dm is expressed as follows [27]:
Cm l , (3)
Dm
1
A Hs
4
where Cm represents the conductance in the molecular flow
(m3/s), l represents the distance between two points (m), A
represents the inner cross‐sectional area of the circular tube
(m2), β represents the coefficient of the surface roughness, H
represents the tube perimeter (m), s is a constant ( 10‐5 m2/s;
In this study, a straight circular tube was used to represent a however, Dm* and the Dm used in the present study cannot be
capillary pore for theoretically investigating the relationship directly compared, as Dm corresponds to a specific circular
between the diffusion and air permeability coefficients. Then, tube, whereas Dm* is the measured value for specimens made
data were collected from studies in which both the diffusion of cementitious materials.
and permeability coefficients of concrete, mortar, and paste
For a straight circular tube, Cm is expressed as follows [25, 27]:
were measured, and the reported and calculated values were
compared to confirm that the obtained relationship is 2r 3 ,
Cm (4)
applicable to actual cementitious materials with a complex 3l
pore structure. where r represents the tube radius (m). The air permeability
coefficient when the molecular flow is dominant, i.e. km (m2),
is expressed as follows [29]: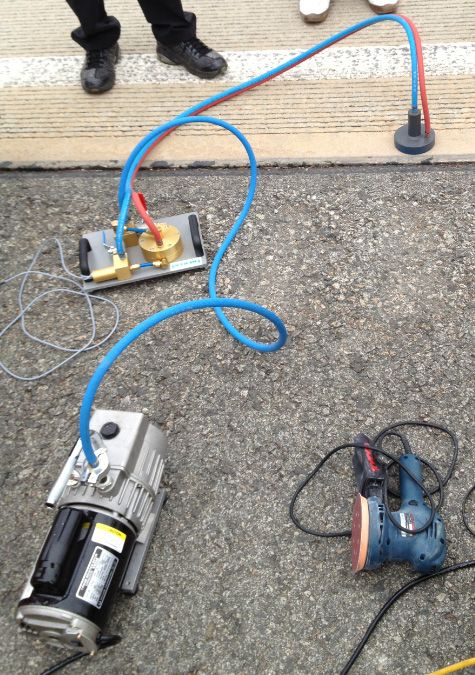
Y. Sakai, RILEM Technical Letters (2020) 5: 26‐32 28
2 , (5) derived using Eq. (10), which assumes that the viscous flow is
km r
3 Pm dominant.
where μ represents the viscosity of the air (Pa∙s), and Pm Fig. 4 shows the relationship between the air permeability
represents the mean pressure of two points (Pa). By and diffusion coefficients for D0 = 0.160 × 10‐4 m2/s (diffusion
combining Eqs. (3)–(5), the relationship between the air coefficient between CO2 and air at 20 °C and the atmospheric
diffusion and the permeability coefficients when the pressure [31]) and 0.202 × 10‐4 m2/s (diffusion coefficient
molecular flow is dominant is obtained as follows: between N2 and O2 at 20 °C and the atmospheric pressure
[31]). These gas types correspond to the experimental
Pm
Dm km . (6) conditions introduced in the next section. Pm was set as 52,
100, and 225 kPa. Here, the pressures 52 and 225 kPa
In contrast, in a large space where the viscous flow is correspond to the means of the atmospheric pressure and 3
dominant, the diffusion coefficient Dv is equal to that of the kPa (initial absolute pressure obtained using the double‐
bulk, where the effect of the boundary is negligible. In this chamber method [7]) and 350 kPa (highest absolute pressure
case, the diffusion coefficient is expressed as follows: obtained using the Cembureau method [34]), respectively.
There was almost no difference between the D0 values of
Dv D0 , (7)
0.160 × 10‐4 m2/s and 0.202 × 10‐4 m2/s, although a slight
where D0 represents the bulk diffusion coefficient of the gas difference was observed in the region where the air
(m2/s). permeability was higher than a few 10‐16 m2. The diffusion test
The diffusion coefficient D considering the molecular, viscous, results for methane and air are discussed in the next section.
and transient flows is expressed as follows [30]: The coefficient was 0.210 × 10‐4 m2/s [31]; this is almost
identical to the data presented in Fig. 4. A change in Pm shifted
1 1 1 . (8)
the curves horizontally.
D Dv Dm
By combining Eqs. (6)–(8), D can be expressed as follows:
D0 Pm k m . (9)
D
D0 Pk m
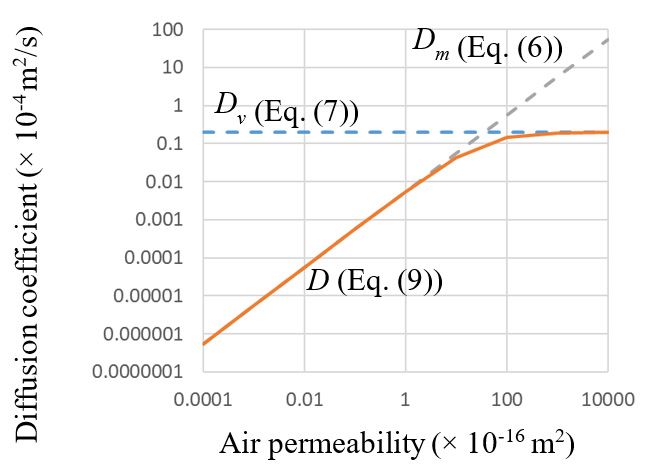
Fig. 2 presents the relationship between the air diffusion and
permeability coefficients (D and km, respectively) calculated
using Eq. (9), assuming Pm = 100 kPa, μ = 0.000018 Pa∙s, and
D0 = 0.202 × 10‐4 m2/s (the diffusion coefficient between N2
and O2 at 20 °C and the atmospheric pressure [31]). As shown,
the curve of D connects those of Dm and Dv smoothly.
As indicated by Eq. (7) and Fig. 2, Dv remains constant.
Conversely, when the viscous flow is dominant, the air
permeability coefficient, i.e., kv (m2), depends on the pore size
and can be calculated using Eq. (10) [32].
r2 Figure 2. Relationship between the air diffusivity and air permeability
kv (10)
8 described by Eqs. (6), (7), and (9).
The following equation was proposed [33] to correlate the air
permeability and diffusion coefficients:
k constant Db , (11)
where k is the air permeability coefficient. According to the
theoretical derivations, b = 2; however, k agrees well with the
experimental results at b = 1. For deriving Eq. (11), Eq. (10)
was used; therefore, the viscous flow was assumed implicitly.
Fig. 3 shows the k values calculated using Eq. (11) for b = 1 and
2 with the D curve in Fig. 2. The constants in Eq. (11) for b = 1
and 2 were set as 200 and 25000, respectively. In Eq. (11), no
distinction between the viscous and molecular flows is
observed; therefore, their relationship is linear on a double‐
logarithmic scale. As shown in Fig. 3, b = 2, which is a
theoretically derived value, yields a slope that is different
from those of the viscous and molecular flows derived using Figure 3. Relationship between the air diffusivity and permeability
Eq. (9). Using b = 1 results in a slope equal to that for the described by Eqs. (9) and (11).
molecular flow, but this is a coincidence, because Eq. (11) is
Y. Sakai, RILEM Technical Letters (2020) 5: 26‐32 29
Table 1. Related works analysed in this study.
Diffusion test Permeability test
Reference Specimen
Gas 1 Gas 2 Gas Monitor Unit Pressure (kPa)
[16] Concrete O2 N2 Air Flow rate cm4/(s∙N) 200
[17] Mortar CH4 Air Air Flow rate cm2 N/A
[18] Concrete O2 N2 Air Pressure m2 3
[19] Paste CO2 Air Air Pressure m2 150–250
[35] Concrete O2 N2 Air Flow rate cm4/(s∙N) 200
[36] Mortar O2 N2 O2 Pressure m/s 100 → 50
[37] Concrete O2 N2 O2 Pressure m/s 100 → Lower
[38] Mortar O2 N2 O2 Flow rate m2 50–250
used. Assuming that the applied pressure was 250 kPa, the
difference between the results of these equations was 70 %,
which corresponded to a small difference on the logarithmic
scale. In [18], a unique equation was used to calculate the
diffusion coefficient for eliminating the effect of the sample
thickness, because thin specimens typically exhibit smaller
diffusion coefficients. The difference between the results for
this equation and the conventional equation used in the
literature was minimal, because sufficiently thick specimens
Figure 4. Relationship between the air diffusivity and permeability
were used in the previous studies.
described by Eq. (9) with different values of D0 and Pm. In [16] and [35], fly ash and granulated blast furnace slag were
used, respectively, and data for various moisture contents
Data from previous studies were presented. In [36], the samples were immersed in
different aqueous solutions before drying, whereas in [37]
Studies in which both the air diffusivity and permeability were and [38], the samples were conditioned at various humidity
measured were reviewed, as shown in Table 1. In the table, and temperature values.
the materials, gases in the diffusion and permeability tests,
units, and applied pressures in the permeability tests are
presented. The units of the air diffusivity and permeability
were converted to cm2/s and m2 when other units were used.
When the reported air permeability value had a unit of m/s, it In the measurement of the air permeability coefficient, it is
was multiplied by μ (0.000018 Pa∙s) / γ (12.7 N/m3) to convert difficult to determine the air permeability of the molecular
it to m2. When the reported air permeability value had a unit flow km because generally, the measured air permeability
of cm4/(s∙N), it was multiplied by 10‐4 × μ (0.000018 Pa∙s) to includes contributions from the viscous flow and transition
convert it to m2. flow. Therefore, in the conversion from the air permeability
to the air diffusivity using Eq. (9), it is assumed that km = k,
The equations for calculating air diffusivity and permeability
where k is the total air permeability coefficient, which
were not the same in the studies analysed. However, the
considers the viscous and molecular flows obtained in the
reported values were adopted ‘as is’ because the original data
actual measurements. According to this assumption, Eq. (9) is
were not available; hence, it was impossible to calculate the
redefined as follows:
air diffusivity and permeability using the same approach.
Different equations have been used in previous studies for D0 Pm k . (12)
D
the pressure and flow rate, but these equations are similar D0 Pm k
because they are based on Darcy’s law. In [17] and [35], for
calculating the pressure difference, (P12 – P22)/(2P2) was used, Results and discussion
which was also derived from Darcy’s law. Here, P1 represents Fig. 5 presents the calculated and reported air diffusivity and
the applied (input) pressure, and P2 represents the output permeability values. The reported data are distributed on two
pressure (atmospheric pressure). However, in [16], P1 – P2 was lines with different slopes; these data were obtained for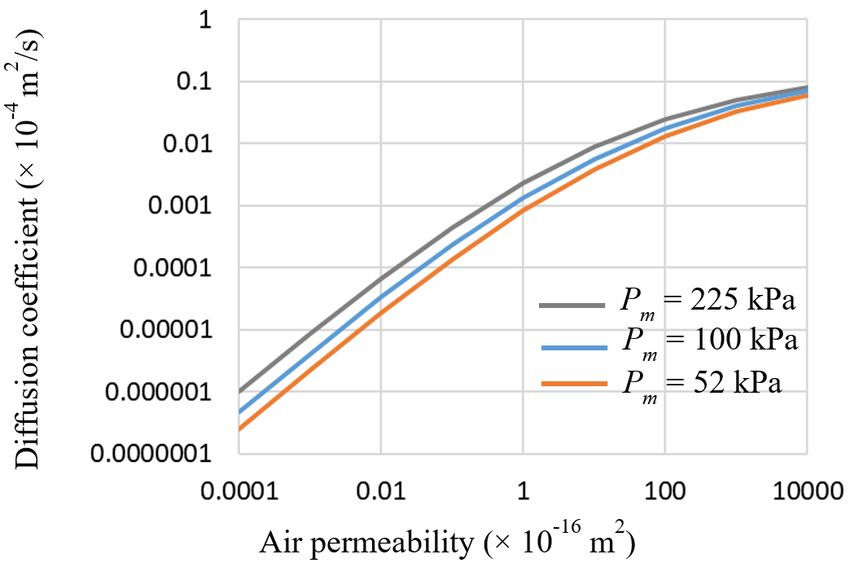
Y. Sakai, RILEM Technical Letters (2020) 5: 26‐32 30
concrete as well as mortar and cement paste. As shown, there According to Eq. (13), when k = 50 × 10‐16 m2, r is 325 nm,
was a strong correlation between the air diffusion and which is close to 620 nm on the logarithmic scale. This result
permeability coefficients for the cementitious materials. The validates the foregoing discussion and Eq. (13).
calculated values were obtained assuming that Pm = 100 kPa, These calculations indicate that the largest difference
μ = 0.000018 Pa∙s, and D0 = 0.202 × 10‐4 m2/s (diffusion between the calculation and measurement results occurred
coefficient between N2 and O2 at 20 °C and atmospheric at the boundary of the molecular and viscous flows, and the
pressure [31]). The effect of the gas type on D0 was small, as main reason for this difference was the assumption of km = k,
shown in Fig. 4. Pm was maintained at 100 kPa to achieve because when the air permeability is low, the molecular flow
better visibility (see Fig. 4 for the effect of Pm). The calculated
is dominant; thus, k ≅ km. Conversely, when the air
and reported values exhibited good quantitative agreement,
without the need for a correction factor. This indicates that permeability is high, Eq. (12) becomes D ≅ D0. Therefore, the
Eq. (9) can describe the relationship between the diffusion validity of the assumption that km = k becomes questionable
coefficient and air permeability in cementitious materials. The when the air permeability is moderate or when the transition
calculated diffusion coefficients tended to be larger than the flow is dominant.
reported experimental results, with the differences increasing As it is difficult to obtain km from the air permeability tests, a
when the air permeability was approximately 1 × 10‐16 m2. The parametric study is required. The calculated air diffusivity
reasons for the differences may include the assumptions near the boundary can be varied by modifying Eq. (8) as
made in the calculation of the diffusion coefficients and air follows:
permeabilities and the experimental differences among the
1 1 1 , (14)
studies referenced. However, the main reason is the
assumption made in the calculation of D (that km = k). This is D a Dva Dma
discussed later in the paper. where a is a constant. The shape of the curve changes with
respect to a, and the changes are largest near the boundary.
By using Eq. (14) instead of Eq. (8), Eq. (12) is expressed as
follows:
D0 Pm k . (15)
D
a
D0 Pmk
a a
Fig. 6 presents the curves with a = 0.15, 0.25, and 1. As shown,
a = 0.25 yielded the best fit to the data for formulating the
relationship between the diffusion coefficient and the air
permeability with km unknown and k known.
Figure 5. Relationship between the air diffusivity and permeability
described by Eq. 10 with P0 = 100 kPa.
In the experiments, there was a point of a deviation from
linearity at an air permeability of approximately 50 × 10‐16 m2.
This indicates that the air permeability of 50 × 10‐16 m2 was
the boundary between the molecular and viscous flows.
Using Eq. 2, the mean free path at the atmospheric pressure
(P = 100 kPa) was calculated as 62 nm, assuming T = 293 K and
d = 0.38 nm (diameter of a nitrogen molecule). Therefore,
according to the thresholds described in Section 2, the viscous
Figure 6. Relationship between the air diffusivity and permeability
flow became dominant at r > 6200 nm, and the molecular
described by Eq. (15).
flow was dominant at r < 62 nm. On the logarithmic scale, the
midpoint of these radii was 620 nm. This radius can be
The consistency of the results in Fig. 6 validates the
assumed as the boundary between the viscous and molecular
conversion of the air permeability into the diffusion
flows. Therefore, when the measured air permeability was 50
coefficient using Eq. (15), even though it was difficult to obtain
× 10‐16 m2, the representative pore radius in terms of the air
km in the actual measurements. As introduced previously,
penetration was 620 nm. A relationship between the air
devices that can evaluate the air permeability of concrete in a
permeability and the representative pore radius was
non‐destructive manner are presently available, and it is
empirically derived [23] as follows:
possible to obtain the diffusion coefficient of concrete onsite
r (nm) 46 k (1016 m 2 ) . (13) using such devices and Eq. (15). Furthermore, Fig. 6 indicates
that it is not necessary to evaluate both the air diffusivity and
permeability, because either one can be obtained by
converting the other. The results of this study will contribute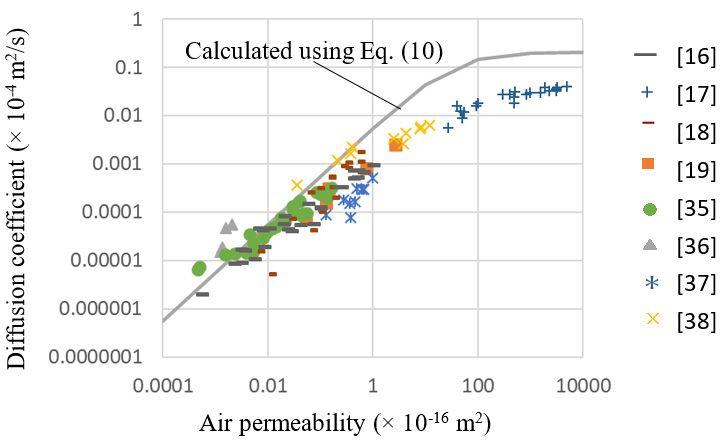
Y. Sakai, RILEM Technical Letters (2020) 5: 26‐32                                                                                           31

to the rational evaluation of the durability of concrete                   References
structures.
                                                                      [1] AM. Neville, Properties of Concrete 5th Edition. Trans‐Atlantic
Fig. 7 shows the curves for D0 = 0.160 × 10‐4 m2/s (diffusion              Publications, Inc (2012).
coefficient between CO2 and air) at Pm = 52 (mean pressure            [2] K. Kobayashi, K. Shuttoh, Oxygen diffusivity of various cementitious
                                                                           materials. Cem Concr Res (1991) 21(2): 273‐284.
obtained using the double‐chamber method [7]), 100, and                    https://doi.org/10.1016/0008‐8846(91)90009‐7
225 kPa (highest mean pressure determined using the                   [3] YF. Houst, FH. Wittmann, Influence of porosity and water content on
Cembureau method [34]); these curves were obtained using                   the diffusivity of CO2 and O2 through hydrated cement paste. Cem
                                                                           Concr Res (1994) 24(6): 1165‐1176.
Eq. (15) and a = 0.25. This relationship can be used to convert            https://doi.org/10.1016/0008‐8846(94)90040‐X
the air permeability into the diffusivity of CO2 and O2               [4] RK. Dhir, PC. Hewlett, YN. Chan, Near surface characteristics of
molecules in air (N2) because the D0 of these gases did not                concrete: intrinsic permeability. Mag Concr Res (1989) 41(147): 87‐
                                                                           97. https://doi.org/10.1680/macr.1989.41.147.87
change significantly (Fig. 4). N2 and air are compatible, as the      [5] JJ. Kollek, The determination of the permeability of concrete to
diffusion coefficients of CO2 vs. N2 and CO2 vs. air are 0.16 ×            oxygen by the Cembureau method‐a recommendation. Mater Struct
10‐4 m2/s [31].                                                            (1989) 22(3): 225‐230. https://doi.org/10.1007/BF02472192
                                                                      [6] RILEM TC 116‐PCD, Permeability of concrete as a criterion of its
                                                                           durability. Mater Struct (1999) 32: 174‐179.
                                                                      [7] RJ. Torrent, A two‐chamber vacuum cell for measuring the coefficient
                                                                           of permeability to air of the concrete cover on site. Mater Struct
                                                                           (1992) 25(6): 358‐365. https://doi.org/10.1007/BF02472595
                                                                      [8] RK. Dhir, PC. Hewlett, EA. Byars, IG. Shaaban, A new technique for
                                                                           measuring the air permeability of near‐surface concrete. Mag Concr
                                                                           Res (1995) 47(171): 167‐176.
                                                                           https://doi.org/10.1680/macr.1995.47.171.167
                                                                      [9] PA. Claisse, E. Ganjian, TA. Adham, A vacuum‐air permeability test for
                                                                           in situ assessment of cover concrete. Cem Concr Res (2003) 33(1): 47‐
                                                                           53. https://doi.org/10.1016/S0008‐8846(02)00912‐2
                                                                      [10] P. Paulini, A laboratory and on‐site test method for air permeability
                                                                           of concrete, 2nd International Symposium on Service Life Design for
                                                                           Infrastructure, Delft, The Netherlands (2010) 995‐1002.
                                                                      [11] A. Nonaka, N. Yuasa, Rapid testing method for air permeability of
                                                                           structural concrete using drilled hole. J Struct Constr Eng
                                                                           (Transactions of AIJ) (2014) 79(700): 689‐696.
                                                                           https://doi.org/10.3130/aijs.79.689
Figure 7. Relationship between the air diffusivity and permeability
                                                                      [12] K.Yang, P.A.M. Basheer, Y. Bai, B.J. Magee A.E.Long, Development of
described by Eq. (15) with a = 0.25 and D0 = 0.160 × 10‐4 m2/s.            a new in situ test method to measure the air permeability of high
                                                                           performance concretes. NDT & E International (2014) 64: 30‐40.
     Conclusions                                                           https://doi.org/10.1016/j.ndteint.2014.02.005
                                                                      [13] B.G. Salvoldi, H. Beushausen, M.G. Alexander, Oxygen permeability of
                                                                           concrete and its relation to carbonation. Constr Build Mater (2015)
In this study, the relationship between the air diffusivity and            85:30‐37. https://doi.org/10.1016/j.conbuildmat.2015.02.019
permeability was investigated via a theoretical approach and          [14] Y. Sakai, C. Nakamura, T. Kishi, TH. Ahn, Interpretation of non‐
literature survey. An equation for the relationship between                destructive test results for evaluation of mass transfer resistance of
the air diffusivity and permeability in molecular, transition,             concrete members. the 5th International Conference of ACF (2012).
                                                                      [15] Y. Sakai, C. Nakamura T. Kishi, Correlation between permeability of
and viscous flows was derived. Although a straight circular                concrete and threshold pore size obtained with epoxy‐coated
tube was assumed in the derivation of the equation, the                    sample. J Adv Concr Technol (2013) 11(8): 189‐195.
calculated values exhibited good quantitative agreement with               https://doi.org/10.3151/jact.11.189
                                                                      [16] H. Iwasawa, I. Ujike, S. Nagataki, Study of relation between air
experimental data. This indicates that the air diffusion and               permeability coefficient and oxygen diffusion coefficient of concrete.
permeability are governed by the same factors (possibly the                Annual Conference of Japan Society of Civil Engineers (1990) 764‐765
pore structure). The air diffusion coefficient can be converted            (in Japanese).
                                                                      [17] K. Sasaki, H. Miyakoshi, Air and water permeabilities of coal ash and
into the permeability coefficient (and vice versa) using the               portland cement mortars. Scientific and technical reports of the
equation derived in this paper. The analysed studies provided              Mining College, Akita University (1992) 13:1‐8 (in Japanese).
data for concrete, mortar, and cement paste of various mix            [18] T. Toyofuku, T. Shirakawa, T. Sato, Non‐destructive testing for
                                                                           evaluation of concrete structures. Kyugikyo (2009) (in Japanese).
designs prepared under various conditions; however, further           [19] K. Namoulniara, P. Turcry, A. Aït‐Mokhtar, Measurement of CO2
tests of samples prepared under extreme conditions are                     effective diffusion coefficient of cementitious materials. European J
needed to determine the limitations of the equation derived                Env Civ Eng (2016) 20(10): 1183‐1196.
                                                                           https://doi.org/10.1080/19648189.2015.1132011
in this paper.                                                        [20] Y. Sakai, Relationship between pore structure and chloride diffusion
                                                                           in cementitious materials. Constr Build Mater (2019) 229: 116868.
     Acknowledgements                                                      https://doi.org/10.1016/j.conbuildmat.2019.116868
                                                                      [21] Y. Sakai, Correlations between air permeability coefficients and pore
This study was supported by JSPS KAKENHI (grant number                     structure indicators of cementitious materials. Constr Build Mater
18K13809).                                                                 (2019) 209: 541‐547.
                                                                           https://doi.org/10.1016/j.conbuildmat.2019.03.068
     Conflicts of interest                                            [22] Y. Sakai, Relationship between water permeability and pore structure
                                                                           of cementitious materials. Mag Concr Res 2019 (in print).
There are no conflicts of interest to declare.                             https://doi.org/10.20944/preprints201812.0073.v1
                                                                      [23] Y. Sakai, C. Nakamura, T. Kishi, Evaluation of mass transfer resistance
                                                                           of concrete based on representative pore size of permeation
                                                                           resistance. Constr Build Mater (2014) 51: 40‐46.
                                                                           https://doi.org/10.1016/j.conbuildmat.2013.10.037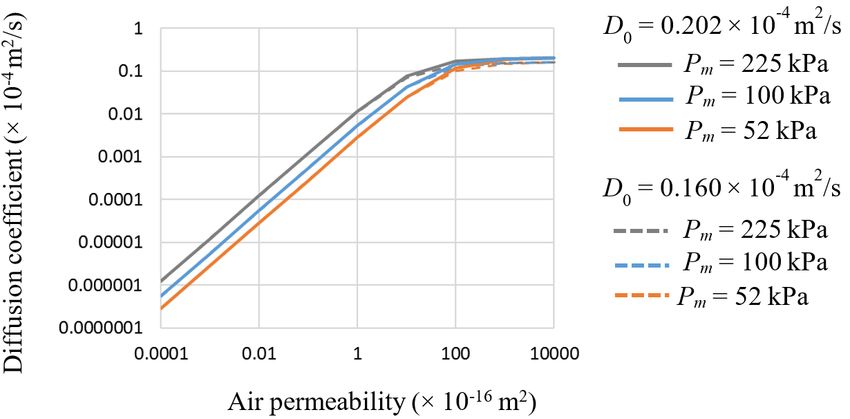
Y. Sakai, RILEM Technical Letters (2020) 5: 26‐32                               32

[24] A. Chambers, RK. Fitch, BS. Halliday, Basic vacuum technology. IOP
     Publishing (1998). https://doi.org/10.1201/NOE0750304955
[25] M. Pirani, J. Yarwood, Principles of vacuum engineering. Chapman
     and Hall (1961)
[26] JF. O'Hanhon, A user's guide to vacuum technology. John Wiley &
     Sons (2003).
[27] H. Kumagai, G. Tominaga, Y. Tuzi, G. Horikoshi, Vacuum science and
     engineering. Shokabo (2012) (in Japanese).
[28] Y. Sakai, T. Kishi, Numerical simulation of air permeability in
     covercrete assuming molecular flow in circular tubes. Constr Build
     Mater (2016) 125: 784‐789.
     https://doi.org/10.1016/j.conbuildmat.2016.08.105
[29] Y. Sakai, Numerical study on the relationship among air permeability,
     pore size and pressure assuming molecular and viscous flows. J Adv
     Concr Technol (2017), 15(3): 103‐109.
     https://doi.org/10.3151/jact.15.103
[30] P. Schneider, D. Gelbin, Direct transport parameters measurement
     versus their estimation from mercury penetration in porous solids.
     Chem Eng Sci (1985) 40(7): 1093‐1099.
     https://doi.org/10.1016/0009‐2509(85)85067‐3
[31] WM. Haynes, Handbook of chemistry and physics, CRC Press, (2012).
[32] SJ. Glass, DJ. Green, Permeability and infiltration of partially sintered
     ceramics, J Amer Ceram Soc (1999) 82(10): 2745‐2752.
     https://doi.org/10.1111/j.1151‐2916.1999.tb02151.x
[33] LO. Nilsson, T. Luping, Chapter 3 ‐ Relations between different
     transport parameters. In J. Kropp & H.K. Hilsdorf, eds. Performance
     criteria for concrete durability. RILEM (1995): 15‐32.
[34] JJ. Kollek, The determination of the permeability of concrete to
     oxygen by the Cembureau method‐a recommendation. Mater Struct
     (1989) 22(3): 225‐230. https://doi.org/10.1007/BF02472192
[35] I. Ujike, M. Narazaki, S. Nagataki, A study on relationship between air
     permeability and diffusions of oxygen and of chloride ions. Paper
     presented at the Proceedings of Japan Concrete Institute. 1993.
[36] C. Villani, TE. Nantung, WJ. Weiss, The influence of deicing salt
     exposure on the gas transport in cementitious materials. Constr Build
     Mater (2014) 67: 108‐114.
     https://doi.org/10.1016/j.conbuildmat.2013.08.018
[37] C. Peretti, A. Leemann, R. Loser, P. Lura, Influence of different
     conditioning regimes on the oxygen diffusion and oxygen
     permeability of concrete. Paper presented at the 2nd International
     Conference on Microstructural‐Related Durability of Cementitious
     Composites, Amsterdam, The Netherlands 2012.
[38] HS. Wong, NR. Buenfeld, MK. Head, Estimating transport properties
     of mortars using image analysis on backscattered electron images.
     Cem Concr Res (2006) 36(8): 1556‐1566.
     https://doi.org/10.1016/j.cemconres.2006.05.002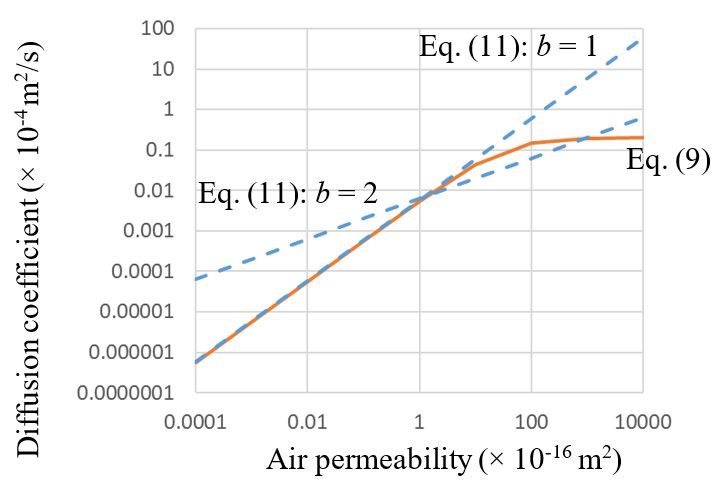
You can also read