Amazon forests did not green up during the 2005 drought
←
→
Page content transcription
If your browser does not render page correctly, please read the page content below
GEOPHYSICAL RESEARCH LETTERS, VOL. 37, L05401, doi:10.1029/2009GL042154, 2010
  Click
  Here
    for
 Full
Article

Amazon forests did not green‐up during the 2005 drought
Arindam Samanta,1 Sangram Ganguly,2 Hirofumi Hashimoto,3 Sadashiva Devadiga,4
Eric Vermote,5 Yuri Knyazikhin,1 Ramakrishna R. Nemani,6 and Ranga B. Myneni1
Received 11 December 2009; accepted 26 January 2010; published 5 March 2010.

[1] The sensitivity of Amazon rainforests to dry‐season                  sphere will act to accelerate global climate changes signif-
droughts is still poorly understood, with reports of                     icantly [Cox et al., 2000]. However, the drought sensitivity
enhanced tree mortality and forest fires on one hand, and                of these forests is poorly understood and currently under
excessive forest greening on the other. Here, we report                  debate. Extreme droughts such as those associated with the
that the previous results of large‐scale greening of the                 El Niño Southern Oscillation (ENSO), when the plant‐
Amazon, obtained from an earlier version of satellite‐                   available soil moisture stays below a critical threshold level
derived vegetation greenness data ‐ Collection 4 (C4)                    for a prolonged period, are known to result in higher rates of
Enhanced Vegetation Index (EVI), are irreproducible, with                tree mortality and increased forest flammability [Nepstad et
both this earlier version as well as the improved, current               al., 2004, 2007]. The drought of 2005, however, was unlike
version (C5), owing to inclusion of atmosphere‐corrupted                 the ENSO‐related droughts of 1983 and 1998 ‐ it was
data in those results. We find no evidence of large‐scale                especially severe during the dry season in southwestern
greening of intact Amazon forests during the 2005                        Amazon but did not impact the central and eastern regions
drought ‐ approximately 11%–12% of these drought‐                        [Marengo et al., 2008]. There are varying reports of forest
stricken forests display greening, while, 28%–29% show                   response to this drought ‐ higher tree mortality and decline
browning or no‐change, and for the rest, the data are not                in tree growth from ground observations [Phillips et al.,
of sufficient quality to characterize any changes. These                 2009] and more biomass fires [Aragao et al., 2007], on
changes are also not unique ‐ approximately similar                      the one hand, and excessive greening from satellite ob-
changes are observed in non‐drought years as well.                       servations [Saleska et al., 2007, hereafter SDHR07], on the
Changes in surface solar irradiance are contrary to the                  other. Reconciling these reports remains a priority.
speculation in the previously published report of enhanced                 [3] The availability of a new and improved version of
sunlight availability during the 2005 drought. There was                 satellite‐derived vegetation greenness data set ‐ Collection 5
no co‐relation between drought severity and greenness                    (C5) Enhanced Vegetation Index (EVI) ‐ facilitates a con-
changes, which is contrary to the idea of drought‐induced                ciliation of the aforesaid reports for two reasons. First, the
greening. Thus, we conclude that Amazon forests did not                  C5 EVI data were generated from significantly improved
green‐up during the 2005 drought. Citation: Samanta, A.,                 algorithms and input‐data filtering schemes related to clouds
S. Ganguly, H. Hashimoto, S. Devadiga, E. Vermote, Y. Knyazikhin,        and aerosols that otherwise corrupt EVI data [Didan and
R. R. Nemani, and R. B. Myneni (2010), Amazon forests did not            Huete, 2006] ‐ aerosols from biomass burning are wide-
green‐up during the 2005 drought, Geophys. Res. Lett., 37, L05401,       spread in the Amazon during the dry season [e.g., Eck et al.,
doi:10.1029/2009GL042154.                                                1998; Schafer et al., 2002], and aerosol loads were signifi-
                                                                         cantly higher, compared to other years, during the dry sea-
1. Introduction                                                          son of 2005 [Koren et al., 2007; Bevan et al., 2009].
                                                                         Second, this data set spans a longer time period (2000–
  [2] The Amazon forests store significant amount of car-                2008). Our analysis here is focused on answering the fol-
bon, by some estimates as much as 100 billion tons [Malhi                lowing five questions: (a) are the results published by
et al., 2006], in their woody biomass. Should these forests              SDHR07 reproducible with both the current and previous
die due to moisture stress in a progressively warming cli-               versions of EVI data? (b) What fraction of the intact forest
mate and savannas replace them, as some studies have                     area impacted by the drought exhibited anomalous greening
suggested [e.g., Cox et al., 2004; Salazar et al., 2007;                 in year 2005? (c) Is there evidence of higher than normal
Huntingford et al., 2008], the carbon released to the atmo-              amounts of sunlight during the 2005 drought, which may
                                                                         have somehow caused the forests to green‐up, as speculated
    1
      Department of Geography and Environment, Boston University,        by SDHR07? (d) If drought caused the forests to green‐up,
Boston, Massachusetts, USA.                                              is there a relationship between the severity of drought and
    2
      BAERI, NASA Ames Research Center, Moffett Field, California,       the spatial extent or magnitude of greening? (e) Are
USA.                                                                     greenness changes during the 2005 drought unique com-
    3
      Department of Science and Environmental Policy, California State
University, Monterey Bay, Seaside, California, USA.                      pared to changes in non‐drought years?
    4
      Sigma Space Corporation, at NASA Goddard Space Flight Center,
Greenbelt, Maryland, USA.                                                2. Data and Methods
    5
      Department of Geography, University of Maryland, College Park,
Maryland, USA.                                                             [4] Detailed information on data and methods is provided
    6
      Biospheric Science Branch, NASA Ames Research Center, Moffett      in the auxiliary material.7 “Amazon forests” in this report
Field, California, USA.
                                                                            7
Copyright 2010 by the American Geophysical Union.                             Auxillary materials are available in the HTML. doi:10.1029/
0094‐8276/10/2009GL042154$05.00                                          2009GL042154.

                                                                  L05401                                                          1 of 5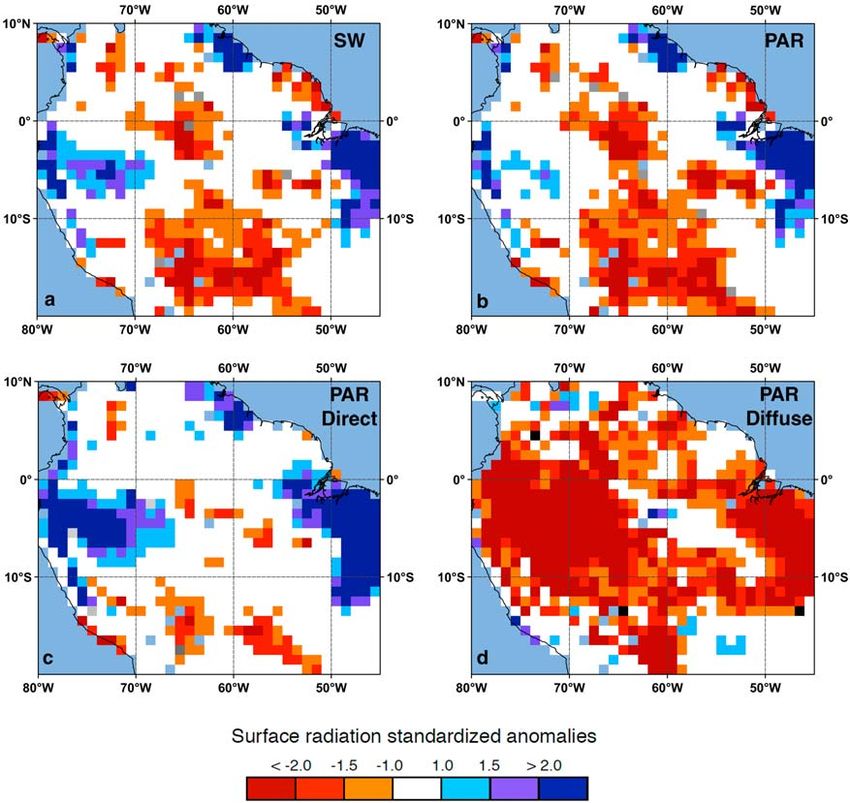
L05401 SAMANTA ET AL.: AMAZON DROUGHT SENSITIVITY L05401
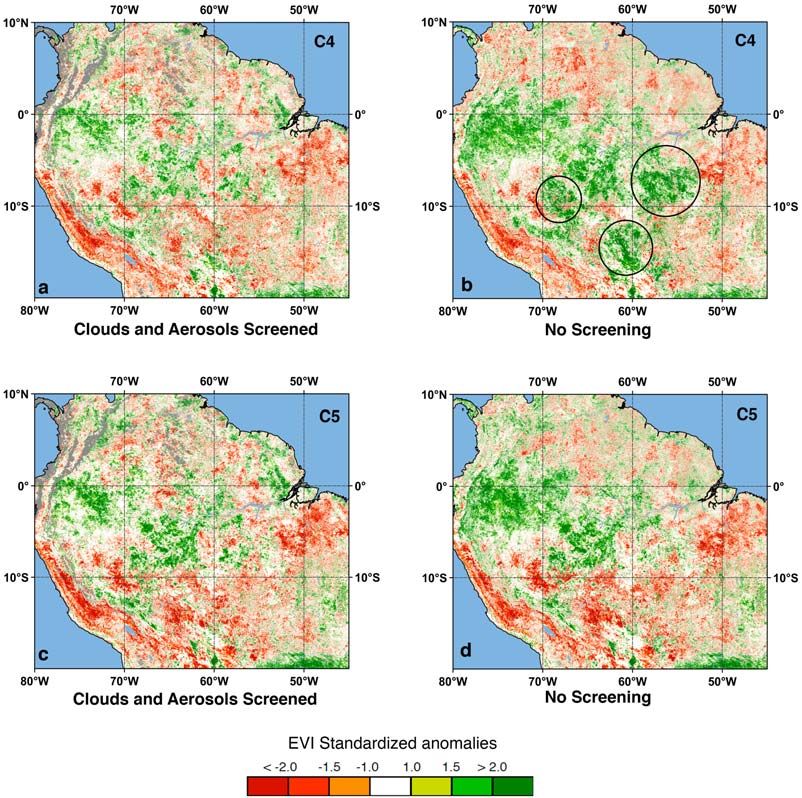
Figure 1. Spatial patterns of July to September (JAS) 2005 standardized anomalies of Enhanced Vegetation Index (EVI) at
1×1 km2 spatial resolution. (a) Collection 4 (C4) EVI data filtered for clouds (adjacent cloud, mixed clouds and possible
shadow) and aerosols (high and climatology aerosols); and anomalies calculated as by SDHR07. (b) C4 EVI with no data‐
quality filtering (same as Figure 1B of SDHR07). (c) Collection 5 (C5) EVI data filtered for clouds (adjacent cloud, mixed
clouds and possible shadows) and aerosols (high and climatology aerosols); and anomalies calculated as by SDHR07.
(d) C5 EVI with no data‐quality filtering. For consistency between C4 and C5 EVI, anomalies are calculated relative to the
base period 2000–2004.
refer to intact (i.e., undisturbed) Amazon forests, south of Three prominent patches of greening in SDHR07 (encircled
the Equator, affected with drought during the dry season in Figure 1b), the largest one being approximately
(July–August–September) of 2005 (Figure S1). 300,000 km2 in extent, are missing (Figures 1a, 1c, and 1d),
and these are located in regions of atmosphere contamina-
tion of EVI (Figures S2b and S2c). Exclusion of atmo-
3. Results and Discussion sphere‐corrupted data generates somewhat similar patterns
[5] SDHR07 claim to have filtered out cloud, shadow and with both versions of the EVI data (Figures 1a and 1c and
aerosol contaminated data from their analysis. However, Table S1). Thus, we conclude that the results of SDHR07
their published patterns cannot be reproduced when such cannot be reproduced either with C4 or C5 EVI data ow-
data are filtered out (Figure 1a compared to Figure 1B of ing to inclusion of atmosphere‐corrupted data in their
SDHR07) and the spatial extent of greening decreased by analysis.
35% (Table S1). SDHR07’s patterns can be reproduced only [6] The quality flags accompanying the EVI data indicate
if no data are screened from analysis (Figure 1b). SDHR07’s aerosols as the dominant source of atmosphere corruption of
patterns also cannot be reproduced with the newer C5 EVI EVI data during the dry season in the Amazon region
data, irrespective of whether atmosphere‐corrupted data are (Figure S2 of the auxiliary material) ‐ large quantities of
filtered or not (Figures 1c and 1d). These current EVI data aerosols emanate from biomass burning during this time
show 28–35% less greening than SDHR07 (Table S1). [e.g., Eck et al., 1998; Schafer et al., 2002]. Aerosol con-
2 of 5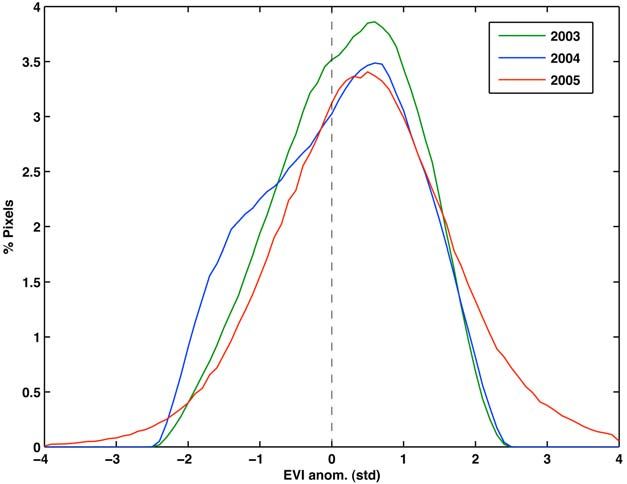
L05401                            SAMANTA ET AL.: AMAZON DROUGHT SENSITIVITY                                            L05401

Figure 2. Spatial patterns of July to September (JAS) standardized anomalies of all sky (total sky) surface radiation at 1° × 1°
spatial resolution for 2005. (a) Shortwave (SW) radiation. (b) Photosynthetically active radiation (PAR, 400–700 nm).
(c) Direct PAR. (d) Diffuse PAR. The reference period for anomaly calculation is 2000–2004.

tamination, as indicated by the “high” and “climatology”         EVI data are invalid, being atmosphere‐corrupted. Including
quality flags, was higher during the dry season of 2005          data from more recent years (2007 and 2008) does not
compared to non‐drought years (Figures S2b and S2c) ‐            change these estimates (Table S3). Thus, we conclude that
consistent with several other reports of anomalous aerosol       there is no evidence of large‐scale greening of Amazon
loads during the 2005 dry season [e.g., Koren et al., 2007;      forests during the 2005 drought in regions for which valid
Bevan et al., 2009]. Such corrupted EVI data must be ex-         EVI data are available.
cluded from analysis [e.g., Didan and Huete, 2006] (cf.            [7] SDHR07 speculate that increased levels of sunlight,
auxiliary material). This will reduce the length of EVI data     from lower cloudiness during the drought, might have
record, i.e., there may not be valid EVI data for one or two     somehow caused the forests to green‐up, drawing on the
months in the third (July–September) quarter of a year.          light‐limited nature of Amazon rainforests [Nemani et al.,
Consequently, the quarterly mean EVI calculated from the         2003]. The expectation of increased sunlight on the forest
remaining valid EVI data will be incorrect because EVI           canopy due to lower cloud cover may be true for dry sea-
increases monotonically through the dry season [e.g., Huete      sons, in general, and for the drought of 2005, in particular,
et al., 2006]. Similarly, the lack of valid quarterly mean EVI   which coincided with the dry season of 2005 [Marengo et
from one or more years will bias the climatological mean         al., 2008]. However, as mentioned earlier, dry seasons in
and standard deviation in view of the short record length        the Amazon are also associated with significant aerosol
(2000–2006, excluding 2005) and, the 2005 dry season EVI         loads in the atmosphere from biomass burning [e.g., Eck et
anomalies, as well. The correct estimate of greening, after      al., 1998; Schafer et al., 2002]. This was especially the case
accounting for these issues (cf. auxiliary material), is about   in 2005 (Figure S3) [e.g., Koren et al., 2007; Aragao et al.,
11–12% (Figure S1). Another 28–29% of these forests show         2007; Bevan et al., 2009]. High levels of aerosol optical
no‐changes or browning (Figure S1). The remaining 60% of         depth may reduce photosynthetically active radiation (PAR;
                                                             3 of 5
L05401 SAMANTA ET AL.: AMAZON DROUGHT SENSITIVITY L05401
Figure 3. Frequency distribution (%) of July to September EVI standardized anomalies in intact forests within the 2005
drought region, south of the Equator. Shown here are distributions from two non‐drought years ‐ 2003 and 2004; and
drought year 2005. The reference period used for anomaly calculation is 2000–2008, but excluding 2005.
400–700 nm) by 20%–45%, under cloudless skies [e.g., Eck this, we analyzed the entire nine‐year (2000–2008) dry
et al., 1998; Schafer et al., 2002]. We find that surface season C5 EVI record. During the non‐drought years of
shortwave radiation declined over 35% of the Amazon 2003 and 2004, approximately 8% of the intact forests show
forests during the dry season of 2005 (Figure 2a) and PAR greening compared to 11% in the drought year 2005
declined over an even larger region (47.5%) (Figure 2b). (Table S3). The extents of browning or no‐change in 2003
Thus, we conclude that there is no evidence of enhanced (27%) and 2004 (27%) are also similar to that in 2005 (23%)
surface sunlight levels during the drought of 2005. (Table S3). EVI anomalies of these forests display nearly
[8] Aerosol scattering of solar radiation may increase the identical negatively skewed (i.e., dominated by positive EVI
diffuse fraction of sunlight incident on the forest canopy, anomalies) frequency distributions in 2003, 2004 and 2005
which may enhance photosynthetic rates [e.g., Gu et al., (Figure 3). Moreover, the relative extent of greening vis‐à‐
2003; Niyogi et al., 2004; Mercado et al., 2009; Oliveira vis browning in non‐drought year 2003 (8% vs. 4%,
et al., 2007]. However, reductions in diffuse PAR were respectively) is also not significantly different from that in the
observed over 78.5% of Amazon forests (Figure 2d) and drought year 2005 (11% vs. 4%, respectively) (Table S3).
these regions overlap with areas of greening (Figure S1). Besides, prominent spatial patterns of greening and
The extent of decline in direct PAR (14%) was much browning, unrelated to precipitation anomalies, are found in
smaller (Figure 2c). Thus, the observed changes in total and other non‐drought years as well. Thus, we conclude that the
direct‐to‐diffuse fractions of surface solar radiation are spatial patterns of EVI changes seen in drought year 2005
contrary to the expectation of enhanced surface sunlight are not unique in comparison to non‐drought years.
levels during the drought of 2005. Therefore, we conclude
that the speculation of light driven greening of Amazon
forests during the drought of 2005 is without basis. 4. Conclusions
[9] If the greening of Amazon forests in 2005 was in- [11] This study attempts to reconcile contradictory reports
duced by the drought, then the magnitude and spatial extent of increased tree mortality [Phillips et al., 2009] and ex-
of greening should be expected to vary systematically with tensive biomass burning [Aragao et al., 2007] with anom-
the severity of drought. We find that 11%–14% of Amazon alous greening of Amazon forests (SDHR07) during the
forests show greening, while, 24%–30% display browning 2005 drought. Our analysis here is focused on answering the
or no change, irrespective of how the precipitation deficit, a following five questions.
measure of drought severity, is varied (increased or de- [12] First, are the results published by SDHR07 repro-
creased) (Table S2). Besides, the magnitudes of greening ducible with both the current (C5) and previous (C4) ver-
and browning also do not change with drought severity sions of EVI data? The greening patterns published by
(Table S2). Thus, we conclude that there was no co‐varia- SDHR07 cannot be reproduced with C4 EVI data when
tion between the severity of drought and the spatial extent atmosphere‐corrupted data are filtered and analyzed fol-
and magnitude of greenness changes of Amazon forests in lowing SDHR07. The published patterns also cannot be
2005. reproduced with the newer C5 EVI data irrespective of
[10] Finally, how unique are the drought year 2005 whether corrupted data are filtered or not. Thus, we con-
greenness changes relative to non‐drought years? To assess clude that the results of SDHR07 are not reproducible.
4 of 5L05401 SAMANTA ET AL.: AMAZON DROUGHT SENSITIVITY L05401
[13] Second, what fraction of the intact forest area im- Cox, P., R. Betts, M. Collins, P. Harris, C. Huntingford, and C. Jones
pacted by the drought exhibited anomalous greening in year (2004), Amazonian forest dieback under climate‐carbon cycle projec-
2005? About 11–12% of the forests show greening, while tions for the 21st century, Theor. Appl. Climatol., 78(1–3), 137–156,
doi:10.1007/s00704-004-0049-4.
28–29% of the forests show no‐changes or browning, and Didan, K., and A. R. Huete (2006), MODIS Vegetation Index product se-
for nearly 60% of the drought impacted area, there are no ries collection 5 change summary, NASA, Tucson, Ariz. (Available at
valid EVI data to make a determination of changes. Thus, http://modland.nascom.nasa.gov/QA_WWW/forPage/MOD13_VI_C5_
Changes_Document_06_28_06.pdf)
we conclude that there is no evidence of large‐scale Eck, T. F., B. N. Holben, I. Slutsker, and A. Setzer (1998), Measurements
greening of the Amazon forests during the 2005 drought in of irradiance attenuation and estimation of aerosol single scattering albe-
regions for which valid EVI data exist. do for biomass burning aerosols in Amazonia, J. Geophys. Res., 103
(D24), 31,865–31,878, doi:10.1029/98JD00399.
[14] Third, is there evidence of higher than normal Gu, L., et al. (2003), Response of a deciduous forest to the Mount Pinatubo
amounts of sunlight during the 2005 drought, which may eruption: Enhanced photosynthesis, Science, 299(5615), 2035–2038,
have somehow caused the forests to green‐up, as speculated doi:10.1126/science.1078366.
by SDHR07? Our analysis indicates that surface shortwave Huete, A. R., et al. (2006), Amazon rainforests green‐up with sunlight in
dry season, Geophys. Res. Lett., 33, L 06405, doi:10.1029/
radiation declined over 35% of the Amazon forests during 2005GL025583.
the dry season of 2005 and PAR declined over an even Huntingford, C., et al. (2008), Towards quantifying uncertainty in predic-
larger region (47.5%). Similarly, reductions in diffuse PAR tions of Amazon “dieback,” Philos. Trans. R. Soc., Ser. B., 363(1498),
1857–1864, doi:10.1098/rstb.2007.0028.
were observed over 78.5% of Amazon forests. These re- Koren, I., L. A. Remer, and K. Longo (2007), Reversal of trend of biomass
ductions are contrary to the expectation of enhanced surface burning in the Amazon, Geophys. Res. Lett., 34, L20404, doi:10.1029/
sunlight levels during the drought of 2005. Thus, we con- 2007GL031530.
clude that the speculation of light driven greening of Malhi, Y., et al. (2006), The regional variation of aboveground live bio-
mass in old‐growth Amazonian forests, Global Change Biol., 12(7),
Amazon forests during the drought of 2005 by SDHR07 is 1107–1138, doi:10.1111/j.1365-2486.2006.01120.x.
without basis. Marengo, J. A., C. A. Nobre, J. Tomasella, M. D. Oyama, G. S. De Oliveira,
[15] Fourth, if drought caused the forests to green‐up, is R. De Oliveira, H. Camargo, L. M. Alves, and I. F. Brown (2008), The
drought of Amazonia in 2005, J. Clim., 21(3), 495–516, doi:10.1175/
there a relationship between the severity of drought and the 2007JCLI1600.1.
spatial extent or magnitude of greening? We find that 11%– Mercado, L. M., et al. (2009), Impact of changes in diffuse radiation
14% of Amazon forests show greening and 24%–30% dis- on the global land carbon sink, Nature, 458, 1014–1017,
doi:10.1038/nature07949.
play browning or no‐change, irrespective of how the pre- Nemani, R. R., et al. (2003), Climate‐driven increases in global terrestrial
cipitation deficit, a measure of drought severity, is varied. net primary production from 1982 to 1999, Science, 300(5625), 1560–
Thus, we conclude that there was no co‐variation between 1563, doi:10.1126/science.1082750.
the severity of drought and the spatial extent and magnitude Nepstad, D., et al. (2004), Amazon drought and its implications for forest
flammability and tree growth: A basin‐wide analysis, Global Change
of greenness changes of Amazon forests in 2005. Biol., 10(5), 704–717, doi:10.1111/j.1529-8817.2003.00772.x.
[16] Fifth, are greenness changes during the 2005 drought Nepstad, D., I. Tohver, D. Ray, P. Moutinho, and G. Cardinot (2007),
unique compared to changes in non‐drought years? During Mortality of large trees and lianas following experimental drought in
an Amazon forest, Ecology, 88, 2259–2269, doi:10.1890/06-1046.1.
the non‐drought years of 2003 and 2004, approximately 8% Niyogi, D., et al. (2004), Direct observations of the effect of aerosol loading
of the intact forests show greening compared to 11% in the on net ecosystem CO2 exchanges over different landscapes, Geophys.
drought year 2005. The extents of browning or no‐change in Res. Lett., 31, L20506, doi:10.1029/2004GL020915.
2003 (27%) and 2004 (27%) are also similar to that in 2005 Oliveira, P. H. F., et al. (2007), The effects of biomass burning aerosols and
clouds on the CO2 flux in Amazonia, Tellus, Ser. B, 59, 338–349,
(23%). Thus, we conclude that the spatial patterns of EVI doi:10.1111/j.1600-0889.2007.00270.x.
changes seen in drought year 2005 are not unique in com- Phillips, O. L., et al. (2009), Drought sensitivity of the Amazon rainforest,
parison to non‐drought years. Therefore, our overall con- Science, 323(5919), 1344–1347, doi:10.1126/science.1164033.
Salazar, L. F., C. A. Nobre, and M. D. Oyama (2007), Climate change con-
clusion is that the Amazon forests did not green‐up during sequences on the biome distribution in tropical South America, Geophys.
the 2005 drought. Res. Lett., 34, L09708, doi:10.1029/2007GL029695.
Saleska, S. R., K. Didan, A. R. Huete, and H. R. da Rocha (2007), Amazon
forests green‐up during 2005 drought, Science, 318(5850), 612,
[17] Acknowledgments. This research was funded by the NASA doi:10.1126/science.1146663.
Earth Science Program. We thank one anonymous reviewer for helpful Schafer, J. S., et al. (2002), Observed reductions of total solar irradiance
by biomass‐burning aerosols in the Brazilian Amazon and Zambian
comments.
Savanna, Geophys. Res. Lett., 29(17), 1823, doi:10.1029/2001GL014309.
S. Devadiga, Sigma Space Corporation, at NASA Goddard Space Flight
References Center, Mail Code 614.5, Greenbelt, MD 20771, USA.
Aragao, L., Y. Malhi, R. M. Roman‐Cuesta, S. Saatchi, L. O. Anderson, S. Ganguly, BAERI, NASA Ames Research Center, Moffett Field, CA
and Y. E. Shimabukuro (2007), Spatial patterns and fire response of 94035, USA.
recent Amazonian droughts, Geophys. Res. Lett., 34, L07701, H. Hashimoto, Department of Science and Environmental Policy,
doi:10.1029/2006GL028946. California State University, Monterey Bay, Seaside, CA 93955, USA.
Bevan, S. L., P. R. J. North, W. M. F. Grey, S. O. Los, and S. E. Plummer Y. Knyazikhin, R. B. Myneni, and A. Samanta, Department of
(2009), Impact of atmospheric aerosol from biomass burning on Amazon Geography and Environment, Boston University, 675 Commonwealth
dry‐season drought, J. Geophys. Res., 114, D09204, doi:10.1029/ Ave., Boston, MA 02215, USA. (arindam.sam@gmail.com)
2008JD011112. R. R. Nemani, Biospheric Science Branch, NASA Ames Research
Cox, P. M., R. A. Betts, C. D. Jones, S. A. Spall, and I. J. Totterdell (2000), Center, Mail Stop 242‐4, Moffett Field, CA 94035, USA.
Acceleration of global warming due to carbon‐cycle feedbacks in a cou- E. Vermote, Department of Geography, University of Maryland, College
pled climate model, Nature, 408, 184–187, doi:10.1038/35041539. Park, MD 20742, USA.
5 of 5You can also read