Modeling the Relation Between Driving Behavior and Fuel Consumption
←
→
Page content transcription
If your browser does not render page correctly, please read the page content below
WHITE PAPER

Modeling the Relation Between
Driving Behavior and Fuel
Consumption

Many companies are investing in coaching services for professional
drivers with the goal of teaching them how to reduce fuel usage, as
well as other eco-driving skills. To succeed, a clear perception of the
variations in fuel consumption that can be attributed to driving
behaviour is required.
Currently, vehicles operated by CGI client Scania Group, a leading
global transport provider, are equipped with monitoring devices that
generate both driver and vehicle data. This allows us to relate fuel
consumption with data gathered using a CAN Bus (controller area
network) and from other sources like weather.
To model the relation, we combined predictive analytics with Scania
data on more than three million trips completed across seven
European Union countries. In this paper, we explain the methods
used and models built that allow for comparisons of the impact of eco-
driving coaching for different fleets and countries.
We also discuss unexpected statistical relations encountered during
the analysis. In addition, we propose an estimated effect of coaching
(EEOC), which provides a realistic estimate of the fuel savings to be
gained from eco-driving coaching.
1                                                                                     cgi.com
                                                                          © 2014 CGI GROUP INC.
TABLE OF CONTENTS

SCANIA’S ECO-DRIVING PROGRAM ..................................................................... 3

LEVERAGING SCANIA’S RICH DRIVER DATA...................................................... 4

     Clusters .............................................................................................................. 5

     Fuel consumption model .................................................................................. 6

USING THE MODELS FOR FUEL MANAGEMENT CONSULTING ........................ 8

CHALLENGES DURING THE PROCESS ................................................................ 9

     Filtering ............................................................................................................... 9

     Simpson paradox............................................................................................... 9

     User feedback .................................................................................................... 9

CONCLUSION ......................................................................................................... 10

REFERENCES ......................................................................................................... 10

2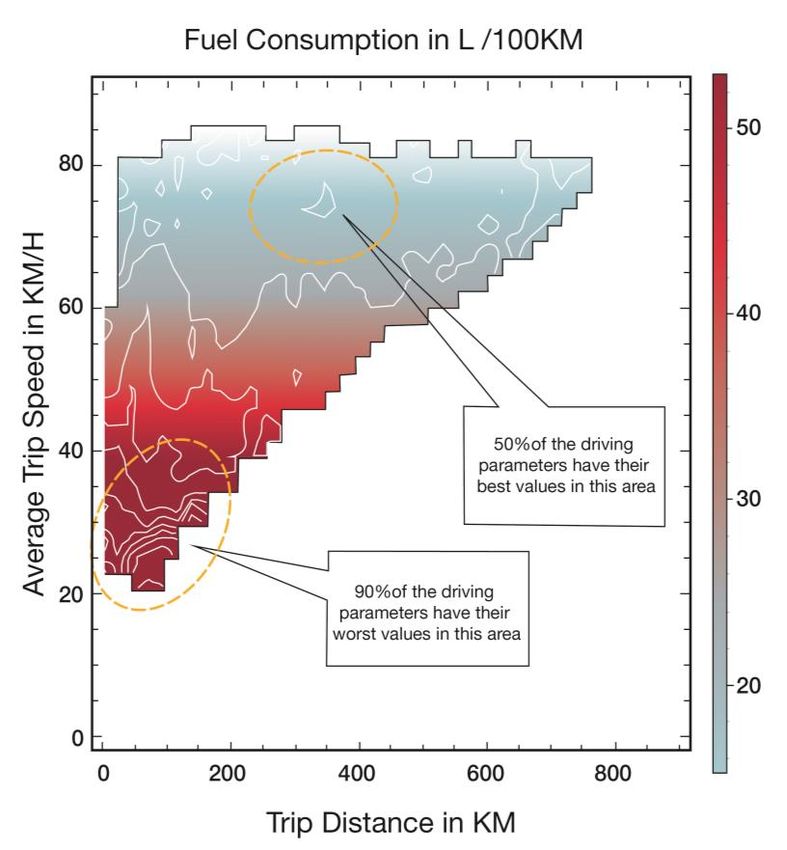
Scania’s eco-driving program
                                                                                                      Using statistical models
Scania implemented a driver-centric coaching program that uses a driving coach portal and
gamification to maintain the interest of drivers in reducing fuel usage over the long term,           and clustering
instead of just after initial training.                                                               techniques, CGI
The driving coach portal is integrated with fleet management systems operated by fleet                analyzed Scania’s rich
owners and used to train drivers in eco-driving.
                                                                                                      driver data to research
Trips are communicated and scored against benchmarks in the portal. Through a monitoring
function, coaches can see how their drivers are doing. Coaching is done by phone or other             the relation between fuel
means.                                                                                                consumption and driving
The drivers also participate in a game that gives them feedback on their driving behaviour on         behaviour.
a daily basis. The game is not focused directly on fuel economy. Rather, it focuses on helping
participants to become better drivers by gaining more control over their vehicles. It
challenges them with respect to six fuel-related driving tasks: more rollout, less hard braking,
less idling, less hard accelerations, less high RPM, and more use of cruise control. All of
these tasks have an assumed relation to fuel consumption.
The portal allows drives to see their results and challenge other drivers to perform better, all
in a friendly manner. Top ranking drivers are then rewarded by social peer recognition and by
allowing them to post their achievements on social media. Once every couple of months, the
top drivers also receive financial rewards, and the game is reset to allow new drivers to
participate.
The main purpose of the game is to reinforce newly learned eco-driving skills and to help
make those skills a part of regular driving behaviour.
The data from these trips was initially used only for benchmarking and scoring within the
portal. But, over time, this database became a valuable resource for assessing the relation
between driving behaviour and fuel consumption. Because the game is played by drivers in
several countries using different brands of trucks and different logistical trip patterns, the data
allows for a much deeper analysis.

                      Figure 1 – Eco-driving coaching service components

3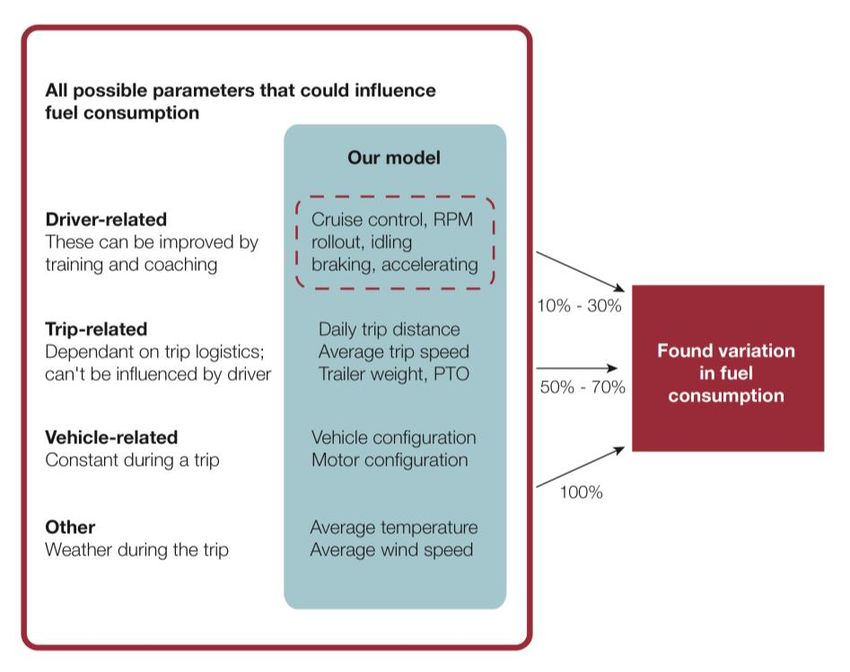
Leveraging Scania’s rich driver data
Using statistical models and clustering techniques, CGI analyzed Scania’s rich driver data to
research the relation between fuel consumption and driving behaviour.
We used an Agile approach to analyze trip data and conducted a number of iterations to
more sharply define the data definitions, data fields and resulting models. The purpose of the
analysis was to come up with a model that links driving behaviour, as measured via the
portal, to actual fuel consumption.
Figure 2 – Data analysis cycle and the results of the steps
A number of steps were taken as part of the approach:
Data: The first step was to filter the data and combine it with other sources. We
combined trip data with weather information such as average day temperature and
wind speed. Vehicle and motor information was linked to trips using chassis serial
numbers.
Cluster: To correctly model the relation between fuel consumption and driving
behaviour, we compared each trip to a benchmark group using several automatic
and manual clustering techniques. We finally decided upon a two-dimensional grid
approach based on daily trip distance versus average speed of the trip.
Model: Per cluster, a model was built relating fuel consumption to trip parameters.
1 2
Several modeling techniques were used, including neural networks , CHAID and
1 http://en.wikipedia.org/wiki/Competitive_learning
2
http://en.wikipedia.org/wiki/CHAID
4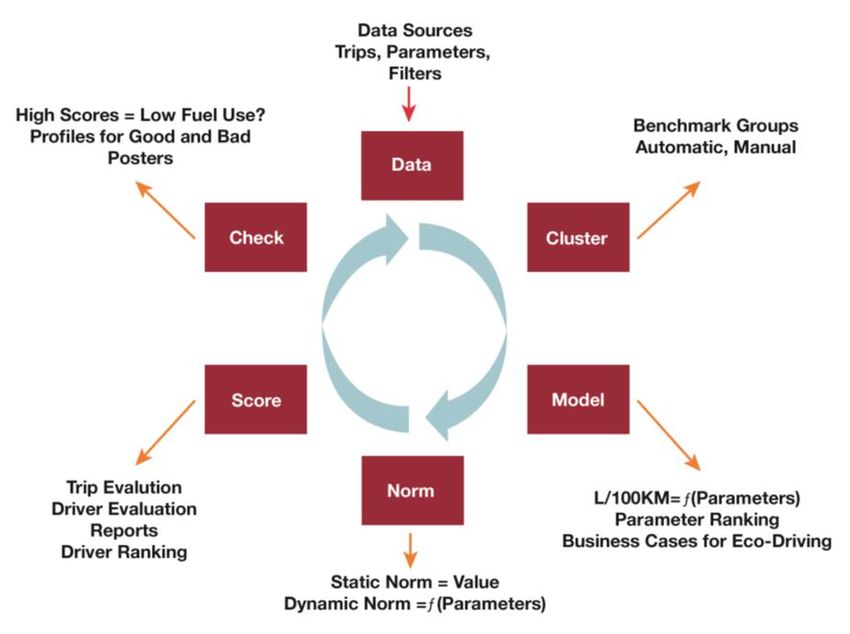
3
several types of linear regression models .
Using these models, we can rank the parameters based on their impact on fuel
consumption. Also, through driver coaching and the game, we can calculate
predicted changes in fuel consumption. This allows us to use the model as a In each model, we can
business case calculator where we can relate the effect of coaching to a possible see the different sets of
fuel saving benefit. Linear models turned out to be slightly less accurate then
neural networks, but much easier to use in practice.
parameters and their
Norm: Using the models and percentile rankings, we can establish norms for trip overall contribution to
parameters in a certain cluster. We can then rank driving behaviour not only in variation in fuel
relation to the norm but also in relation to the expected effect on fuel consumption. consumption.
We experimented with static norms and norms that are a function of, for example,
average speed.
Score: Using the norms, we can calculate a score per trip. These grades can be
used for driver evaluations because they reflect the performance of the individual
trip within the context of the cluster.
Check: The models and their ranking and scouring algorithms can be tested with
different data sets to see if higher scored trips indeed use less fuel. At this stage,
the whole process is reviewed and typically leads to new ideas on which data
sources and fields to use. The cycle is then started again with a list of items to
define more sharply or unexpected effects that require more in-depth study.
Feedback from model users is very important, and often changes have to be made
to make the results more practical.
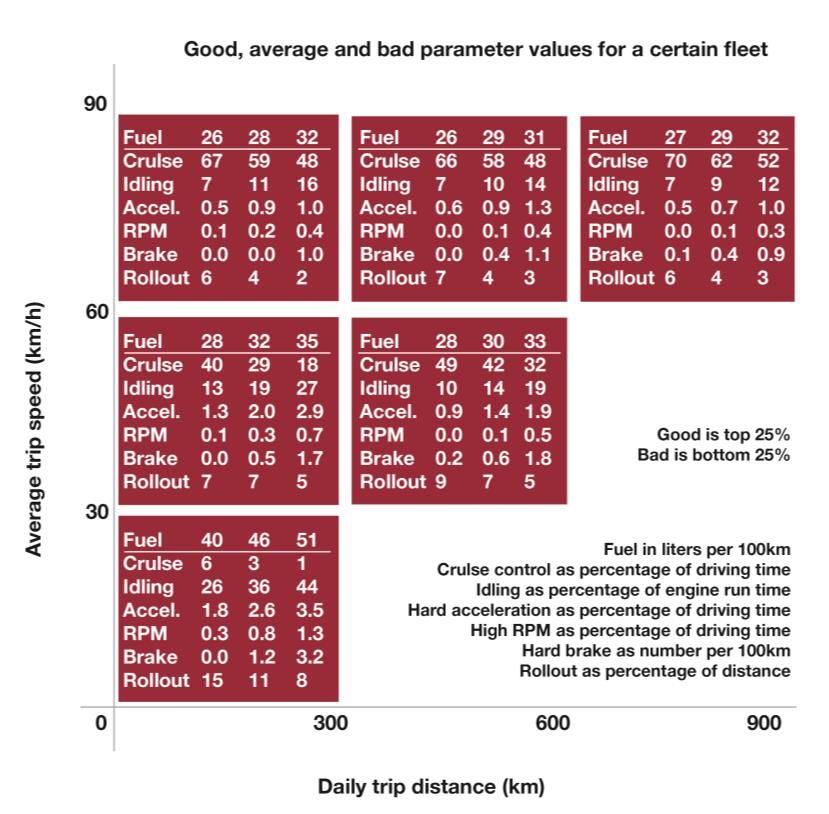
CLUSTERS
Using daily trip distance and average trip speed to partition the data in a grid like manner
delivers comparable results with other automatic clustering techniques. This format turned
out to be easily understood and still had a significant enough statistical basis (see figure 3).
With this grid, we can also indicate the relevant areas for a number of logistical patterns: long
haul (clusters top right), short haul (clusters top left) and distribution (clusters bottom left).
This grid also can be used to present analysis results. We have used it to provide a “good,
average, bad” score range for the different parameters and the resulting fuel consumption for
certain fleets, countries or brand/types.
Scoring a parameter as “good” means it will lead to less fuel consumption. This is based on
the linear model per cluster. A “good” driver is someone who ranks in the top 25 percent
based on fuel consumption.
3
http://en.wikipedia.org/wiki/Linear_regression
5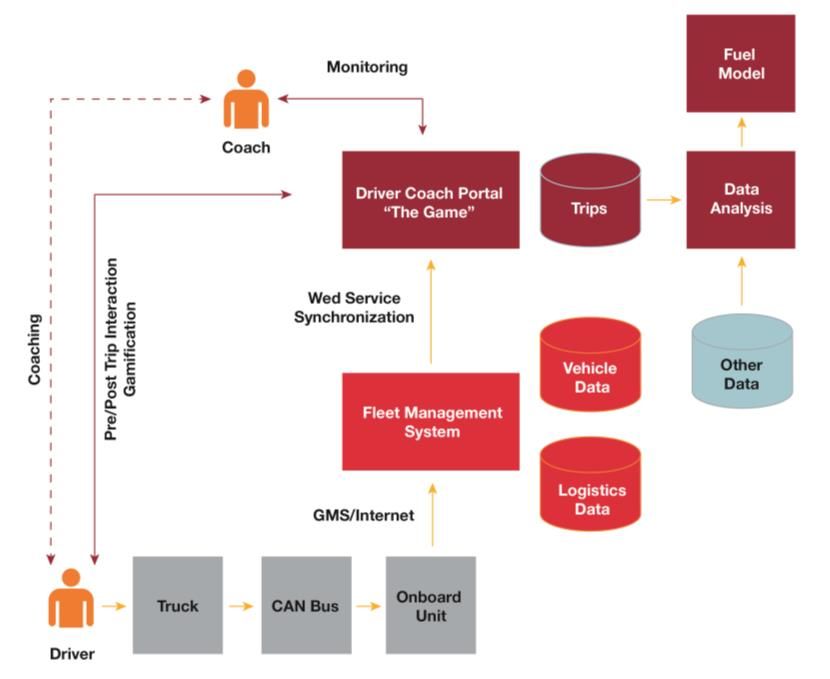
Figure 3 – A cluster norm table for a certain fleet used for evaluating trip performance

We have developed these tables for several European countries, and they are now being
used in actual coaching practice to determine realistic coaching targets. We have discovered
that these tables can differ greatly from country to country, reflecting the difference in road
conditions, terrain type and average age of the rolling stock.

FUEL CONSUMPTION MODEL
We can connect trip information to all types of vehicle and motor configuration data using
license plates or chassis serial numbers. We can also link trips to additional information from
logistics databases and use a time stamp to link it to general weather and road conditions
information. In this way, we can judge driving behaviour during the trip within a wider context
of parameters, which also influence fuel consumption but cannot be changed by the driver
himself.
The resulting model, based on the trips with added data, is a subset of all factors influencing
fuel consumption (see figure 4). The part that is actually trainable and coachable is only a
limited area of this model.
In each model, we can see the different sets of parameters and their overall contribution to
variation in fuel consumption. Overall, a 10-30 percent of variation in fuel consumption can be
attributed to driver-related factors. More interesting is the variance in this contribution. We
see models for long haul clusters in the Nordics go as high as 70 percent, indicating that the
driver has a great deal of influence on fuel consumption. But, we also see a comparable
model in the Low countries reach as low as 10 percent, indicating that coaching a driver
would have less effect because the contribution of driver-related factors is much lower.

6
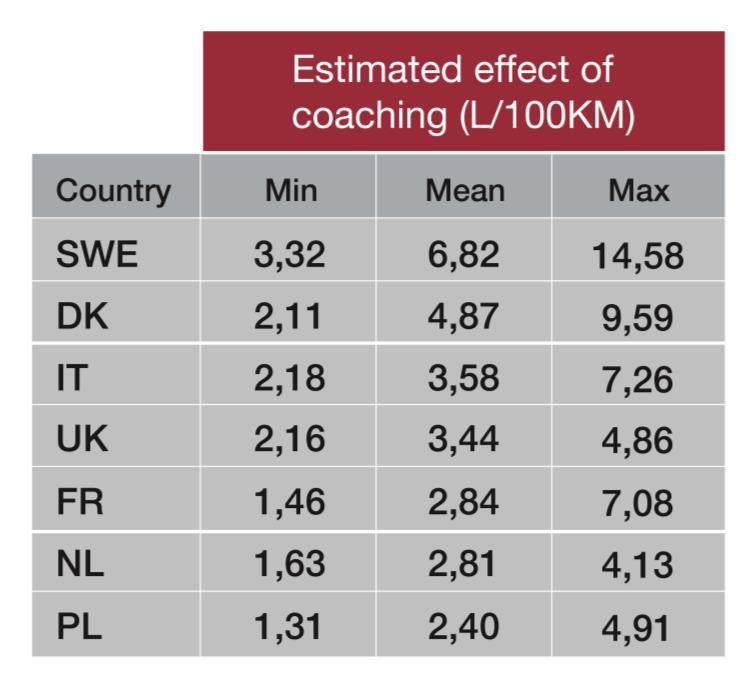
Figure 4 – Percentage of variation in fuel consumption contributed by different sets of
                                   parameters from the model

Studying this effect leads us to search for a way we could use the trip data to calculate the
expected effect of training and coaching for different countries based on the observed
difference in contribution of driver-related factors to fuel consumption.

                  Figure 5 – Expected fuel savings from training and coaching

7
For this, we formulated the estimated effect of coaching (EEOC). The EEOC value gives an
indication of the possible benefits of training and coaching for the purpose of turning drivers
who now rank for fuel consumption in the bottom 25 percent to drivers ranking in the top 25
percent. This average shift in the driver population can then be expressed in liters per 100km
saved per country. The table above shows that the same training and coaching could have a
potentially larger e effect in countries where the contributions of driver-related factors is much
higher.
Using the models for fuel management
consulting
For a number of driving parameters, it is interesting to get a more detailed picture of how they
change for different drivers and trips. Using available data, we can create heat maps. The
figure below is an overview of average fuel consumption for Scania drivers based on trip
distance versus average trip speed.
Figure 6 – Fuel consumption as a function of trip distance and average trip speed
This figure was developed to highlight, for a certain fleet owner, which types of trips had the
most efficient fuel consumption. The owner had considered focusing his training and
coaching efforts on long haul trips (top right). But the data analysis showed that his most
efficient trips were within the medium haul range and that greater fuel reduction could be
gained by focusing on distribution (bottom left) instead. Using the model, we could calculate
8how much this reduction would be to support the business case for the fleet owner to invest
in training and coaching. Although numeric
Using these clustering and modeling techniques, we can now answer a series of fuel results are easily
management related questions based on an analysis of fleet owner data or by using the
appropriate benchmark group.
communicated, the
Here are a number of business questions for which we now have standard analysis methods significance of these
to address: results and how they
How much do my driving parameters need to improve to get at least five percent impact the usability of
fuel reduction in the first year of training and coaching? Is this attainable?
the numerical data is
Would driver coaching have more effect in reducing fuel consumption on my short
haul distribution or on my long haul international trips? more difficult to assess.
What is the fuel consumption difference between my “good” drivers and my “bad”
drivers?
Which of the driving parameters has the largest impact on fuel consumption and is
that the one I should start with for coaching?
How much of variation in my fuel consumption is caused by weather?
Challenges during the process
We encountered a number of challenges within our analysis process. These might be of
interest to other researchers.
FILTERING
A large set of filters was used to extract data and format it for analysis. Simple filters like
rejecting trips with negative fuel consumption were used, as well as complex filters such as
making sure that an actual revenue-generating trip took place as opposed to, for example, a
trip to a garage for routine maintenance.
We discovered that up to 40 percent of the trips were rejected during filtering. This is higher
than anticipated, and we are studying how this could create artefacts in the remaining data. It
is clear that filtering is a very important step in this process. Filter setup has more impact on
the predictive strength and significance of the overall end result than the selection of a cluster
strategy or an analysis model format. The total amount of trips is not that important, however.
We often saw that 80 percent of the final predictive power of a model could already be
reached by using only a randomized 20 percent of the data.
SIMPSON PARADOX
We encountered several instances of the Simpson (1953) paradox in our studies. This
happens when a linear trend appears in different groups of data but suddenly reverses when
these groups are combined in one analysis. For a time, it seemed that doing more rollout
actually led to more fuel consumption instead of less. Closer examination revealed that the
data was split in several groups based on vehicle weight. For each group separately, more
rollout meant less fuel consumption. But, when the groups were combined into one analysis,
without the inclusion of the weight factor, the reverse trend appeared. This led to the practice
of doing a lot more visual inspection of cases, which makes spotting these effects possible.
USER FEEDBACK
Modern data analysis software packages have a large number of visualization options for
large data sets and predictive results. These are clearly usable for experts with statistical
backgrounds. But if the purpose is to disseminate insight gathered from big data to a wide
audience, most of these formats are too complex. In the iterative approach we used, we kept
9making models simpler to allow for practical usage, even if it meant using models with less
predictive power. ABOUT CGI
Founded in 1976, CGI is a global IT
Although numeric results are easily communicated, the significance of these results and how and business process services
they impact the usability of the numerical data is more difficult to assess. We would like to provider delivering high-quality
allow for broad usage and make the information as easy to understand as possible by not business consulting, systems
integration and outsourcing services.
giving too much attention on complex aspects like statistical significance. On the other hand,
With 68,000 professionals in 40
we do need to include aspects like significance to make sure the data is used correctly, countries, CGI has an industry-leading
although making this too important typically limits the accessibility of the information. track record of on-time, on-budget
projects, aligning our teams with
clients’ business strategies to achieve
Conclusion top-to-bottom line results.
For more information about the topics
It is clear that this kind of research into large trip data sets can yield valuable insight into the discussed in this paper or about CGI,
relation of driving behaviour and fuel consumption. Using data analysis techniques can also visit www.cgi.com or contact us at
info@cgi.com.
bring different data sets together to get insight into the context of driver-related factors. The
resulting models have given us a more clear understanding of this relation, which can be
directly translated into realistic coaching targets for drivers and realistic fuel savings
expectations for different fleet owners.
Acknowledgements
This research was carried out by CGI as part of the Scavia Performance Evaluation Method
project. The purpose of this project was to develop a method to evaluate driving behaviour
during trips to guide coaching on fuel reduction.
References
th
1. Lapré, L. (2013). “Scania eco-driving development,” Workshop SIS39, 9 ITS European
Congress, Dublin. ERTICO (ITS Europa).
2. Stam, M. (2012). “The use of gamification to drive behavioral change – lessons from the
th
Strategic Platform for ITS (SPITS) and Scania,” Workshop TS086, 19 ITS World
Congress, Vienna, ERTICO (ITS World).
3. Constantinescu, Z. (2010). “Driving style analysis using data mining techniques,” Int. J. of
Computers, Communications & Control, Vol. V (2010), No. 5, pp. 654-663.
4. Simpson, E.H. (1951). “The Interpretation of Interaction in Contingency Tables,” Journal
of the Royal Statistical Society, Ser. B, 13, 238-241.
cgi.com
© 2014 CGI GROUP INC.
10You can also read