SUBSURFACE VIEWS - Sensors & Software
←
→
Page content transcription
If your browser does not render page correctly, please read the page content below
SUBSURFACE
VIEWS
QUARTERLY NE WSLE T TER
PUBLISHED SINCE 1993
In this issue
IceMap monitors the “World’s Largest
Skating Rink”
Powerful, new visualizations in
EKKO_Project V6 - Coming soon
Sensors & Software + Radiodetection –
What does it mean for you?
Januar y 2 02 1 - Vol. 30, No. 6 4
Upcoming Events
IceMap Monitors the “World’s Largest Skating Rink”
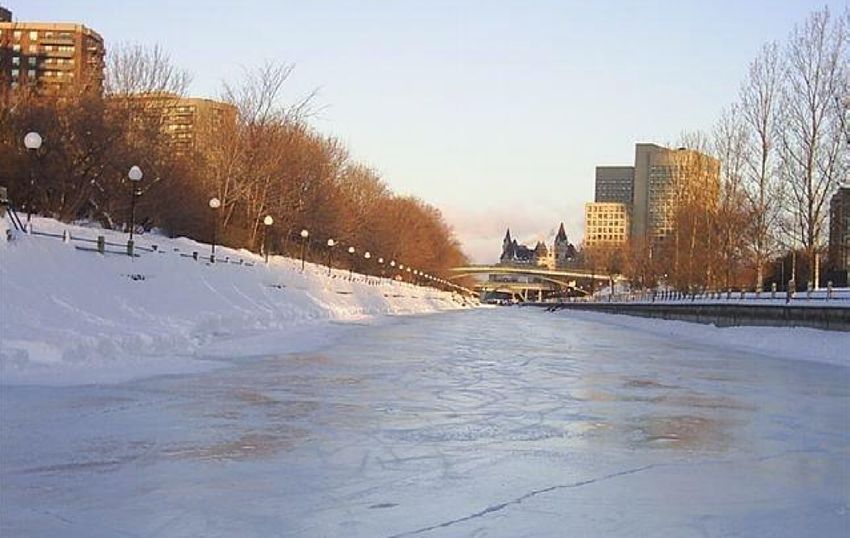
The capital city of Canada, Ottawa, is one of the coldest Early in the season, when the ice in the canal has started to
capital cities in the world. For decades, when the Rideau freeze and thicken, IceMap is deployed with a snowmobile to
Canal in Ottawa freezes over in the winter, it becomes the check the ice thickness (Figure 2).
world’s largest skating rink. At a length of over 7 km and
including Dow Lake, there is certainly plenty of ice for
everyone.
For almost 15 years, the ice on the Rideau Canal has been
built, monitored, and maintained by a company named
Capital Property Guardians. In 2018, they purchased an
IceMap SmartTow GPR system (Figure 1) for measuring the
ice thickness. IceMap uses ground penetrating radar (GPR)
technology and specialized software to automatically
display ice thickness in real-time to provide an easy-to-use
solution for ice safety management.
Figure 2: The Rideau Canal Skateway is more than 7 km long,
from near the Canadian Parliament Buildings to south of Dow’s
Lake. This map shows early season (December 19, 2019) ice
thickness data, plotted on Google Earth for a small section of the
Skateway, as the ice is still thickening . The ice is less than 25 cm
thick and not yet at the safe thickness of 30 cm for trucks, the
Figure 1: The Rideau Canal Skateway is constructed and
Zamboni machine, food vendors or skaters to use.
monitored using the IceMap system to ensure safety and
prioritize maintenance areas.
continued on page 2
SUBSURFACE VIEWS JANUARY 2021 2
The goal is for the ice to reach 30 cm thick; thick enough for trucks and an Ice Resurfacer machine to move safely on the ice
(Figure 3). The Ice Resurfacer machine melts the top layer of ice that has been chewed up by skates, adds a thin layer of water
and allows the ice to refreeze much smoother. The Zamboni brand Ice Resurfacer weighs almost 7 tons when full of water so,
for obvious safety reasons, the ice needs to be thick enough
to support it. Thirty centimeters of ice is also thick enough
to allow food and beverage trailers to be towed onto the ice
for the enjoyment of the skaters.
Says Robert Taillefer, owner of Capital Property Guardians:
“The IceMap system allows us to measure the ice thickness
and flood the thin areas with water to quickly increase the
thickness. This allows us to thicken all the ice to the point
where it can support the Zamboni. The earlier we can get the
Zamboni on the ice, the earlier we can work on making the ice
smooth for skaters and the longer the skating season will be
(Figure 4). Before we had IceMap, we needed to drill many
holes to confirm that the ice was thick enough to support the
Zamboni and there was always a concern that a thin spot
was missed that could result in a serious accident. IceMap
minimizes that uncertainty.” Figure 3: Zamboni ice resurfacing machines are used to smooth
the ice for skaters.
Figure 4: Photos of the ice surface early in the season (left) and shortly after opening day (right). IceMap allows the Zamboni machine to
get on the ice as early as is safely possible, so skaters have as long a season as possible with smooth ice.
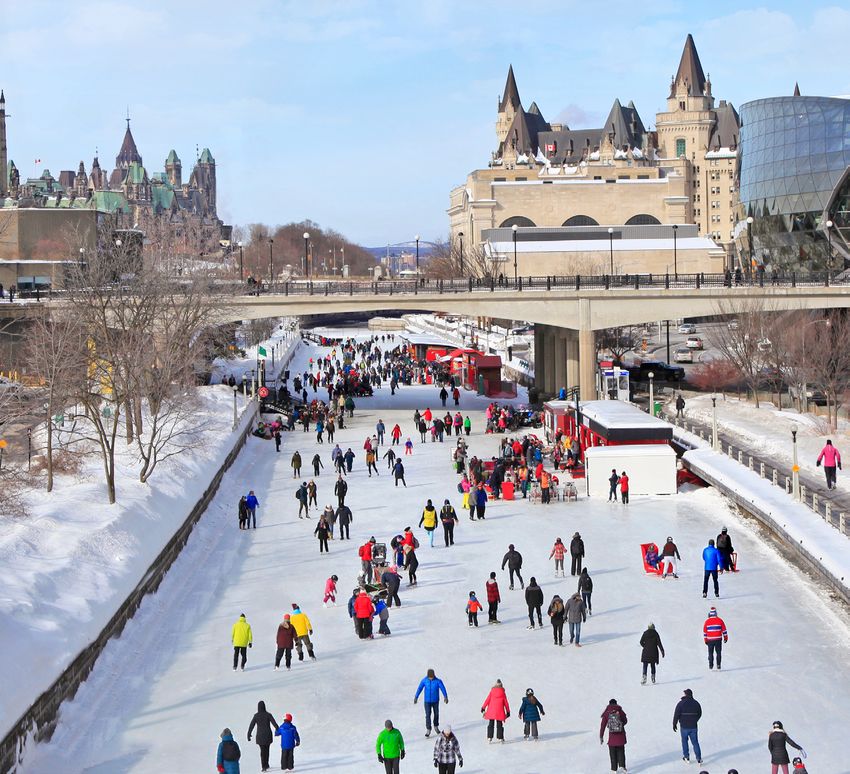
His customer, the National Capital Commission, loves the
simple report he gives them; a Google Earth image that
shows where the ice is greater than 30 cm thick in blue and,
the places where the ice is less than 30 cm thick in red (like
Figure 5). This allows them to quickly see where the work
must be done to flood the ice and make it thick enough for
safety.
IceMap is a unique technology and most people are not used
to seeing it or know what it is used for. What is the oddest
question that Robert has ever been asked while scanning the
ice with IceMap in the middle of the night? Someone once
stopped him and asked if he was the coroner removing a
body from the ice! The IceMap sled is about 6 feet long and
covered to protect the IceMap system electronics so it is not
surprising that this question arose!
Further Reading: https://www.macleans.ca/news/canada/
smooth-operator-2/
Figure 5: Map of ice thickness for the entire skateway on February
8, 2020, plotted on Google Earth. The ice averages more than 40 IceMap data courtesy of Robert Taillefer, Capital Property
cm thick with a few thinner spots are indicated in yellow and red. Guardians
continued on page 3
SUBSURFACE VIEWS JANUARY 2021 3
Powerful, new visualizations in EKKO_Project V6 - Coming Soon
Since 2012, EKKO_Project software has been the foundation Automatic 3D display in Voxler: Seeing a 3D image of
for organizing, viewing and analyzing GPR data and your GPR results is a great way to visualize data and adds a
generating impressive deliverables that suit your project professional flare to your results. You can now export, in a
requirements. The latest software update, version 6, single click from SliceView-Grid, the files needed to visualize
continues to improve EKKO_Project by adding powerful your data in the 3D tool, Voxler. Voxler is third-party software
visualization tools for data analysis and reporting. for 3D visualization. When SliceView-Grid users save a
Grid Scan to 3D, the Voxler program now launches and
What’s New in EKKO_Project V6? automatically generates 3D images with pre-set parameters
for the following types of 3D displays:
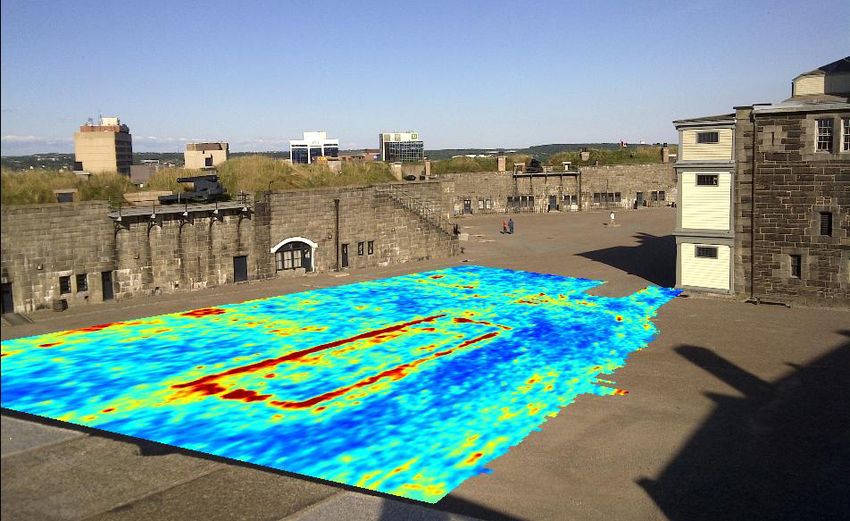
PhotoSlicer allows the user to easily overlay depth slice
images onto a photo. Depth slices generated on the display • Volume Render (Volrender) displays the whole cube of
unit in the field, or from EKKO_Project’s SliceView software data and allows the user to modify the transparency to
module, are stretched or squeezed to fit onto the photo highlight GPR reflections of certain signal strength. For
in the proper position and with the proper perspective. example, it is common to make weak GPR reflectors
Then, the user can scroll through the depth slices to create transparent and only display the strongest reflections in
stunning visualizations of the GPR data. PhotoSlicer is the data.
available in the base version of EKKO_Project.
• ClipPlanes slice through the cube of data, like depth slices
PhotoSlicer images are powerful additions to the GPR but with the advantage of slicing at any angle through the
Summary Report and presentations (Figure 1) to convey data cube.
the position of objects found with GPR, in the context of the
survey site. • Isosurfaces show all the points of a single, user-defined
GPR amplitude value in the cube with all other data
transparent; great for showing the strongest reflectors in
the data (Figure 2).
Figure 2: GPR grid data automatically displayed in 3D in Voxler as a
volume render (purple cube), a clip plane (top of purple cube) and
an isosurface (grey, linear objects).
The user can then easily edit the display properties and
optimize the 3D image.
This seamless new capability eliminates the need to generate
3D images in Voxler from scratch and gives users a head-
start on making impressive 3D displays of their GPR grid data.
Figure 1: PhotoSlicer places depth slices on photographs of
the survey site. Top – Random walk data processed into depth
slices using the SliceView-Lines module. A high amplitude (red)
utility line is shown on a photo of the site. Bottom – Grid data
processed into depth slices using the SliceView-Grid module.
The foundations of a rectangular buried structure are shown on a
photo of the site.
continued on page 4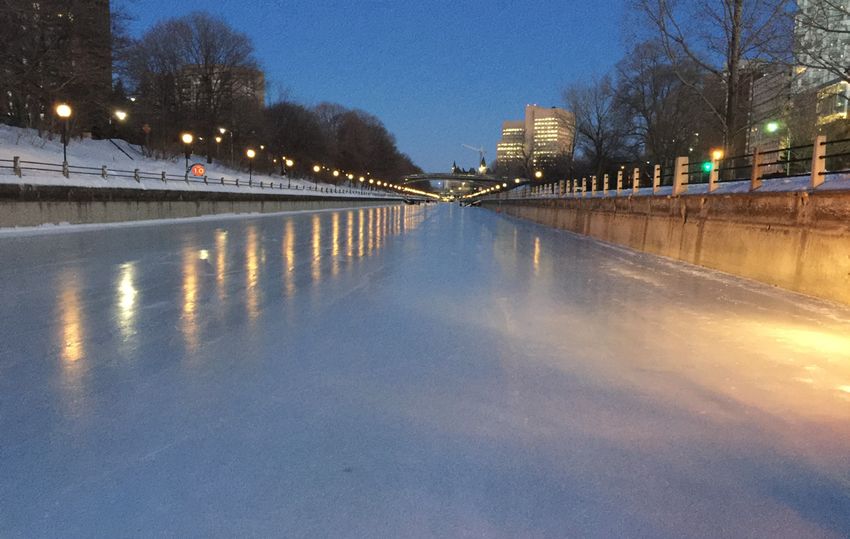
SUBSURFACE VIEWS JANUARY 2021 4
Generate Animation Files: EKKO_Project users can now Examples of the use of multi-media flags are attaching a
easily create GIF animations. These animations can be used photo or video to a flag to show a surface feature you passed
to help spot features in your GPR data as part of analysis, as a while collecting data or attaching a voice memo providing
marketing tool on your website, or as a value-add deliverable more information about the flag.
to send to your clients along with the PDF Summary Report
and Google Earth Files.
GIF animation files play on standard, pre-installed Windows
programs such as Windows 10 Photo Viewer making them
easy deliverables to share with others.
Animations can be created from 3D Preview, where the user
can select the X lines, Y lines or depth slices to animate
while the other two dimensions remain fixed on a user-
selected image (Figure 3). Animations can also be created Figure 4: Flag icon followed by the new multi-media flags
from MapView to animate one or more depth slices with indicating that a photo, audio, or video file is attached to the flag.
interpretations, background images, lines, GPS path, and flags
also visible (if desired).
Clicking on the flag automatically opens the file attached to it;
Figure 5 shows an example of a photo flag.
Figure 3: One frame of a 3D preview GIF animation showing utility
data.
Figure 5: Clicking on a flag with the photo icon on it, opens the
Multi-media Flags: Flags are added to GPR data in the
attached photo for viewing.
field and post-processing to mark the position of surface
features or objects in the GPR data to assist with the data
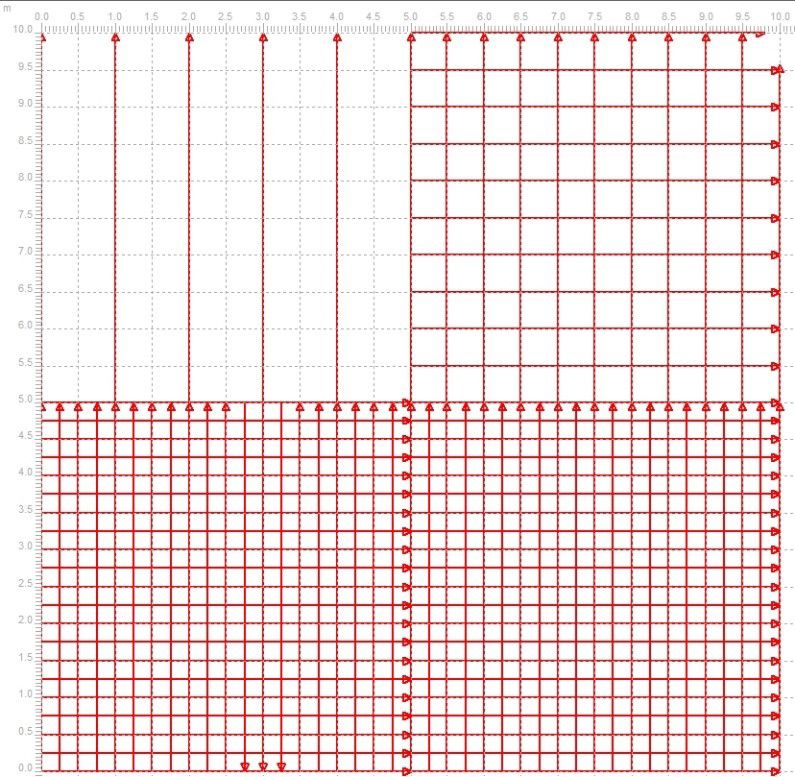
interpretation, positioning and data documentation. An Grid Editing: For various reasons, GPR grid data often
example is flagging the position when the GPR system moves needs to be edited; whether you want to merge multiple
from one type of surface material to a different type (for grids collected over a large area into one large grid for data
example, grass to pavement) because this change can affect processing or combine parallel Line Scans into a grid for
the GPR response and impact the interpretation of the data. SliceView-Grid processing, or perhaps you need to correct
a mistake made during field collection. You can now do so
EKKO_Project V6 adds a new feature to the Interpretation quickly in EKKO_Project. Grid editing (Figure 6), formerly the
module: multi-media flags, which combine flags and multi- GFP_Edit utility, is now part of EKKO_Project with the three
media file attachments. EKKO_Project already allows GPR most common types of edits available:
users to attach auxiliary data files such as photos, videos,
audio files and field notes to grids, individual GPR lines or to • Create a new grid from a series of lines
the project but associating them with a specific location in the • Edit an existing grid and
GPR data could not be done. With this new feature, users can • Add lines (including another grid) to a grid.
now attach photos, videos, and audio files to a flag, creating
a multi-media flag with the appropriate icon on it (Figure 4). By combining your data into grids, you can make use of
This provides an easy way to transfer field notes to a specific SliceView-Grid data visualization tools.
location in your data and provides a complete archive of your
results to be used when analysing your data.
continued on page 5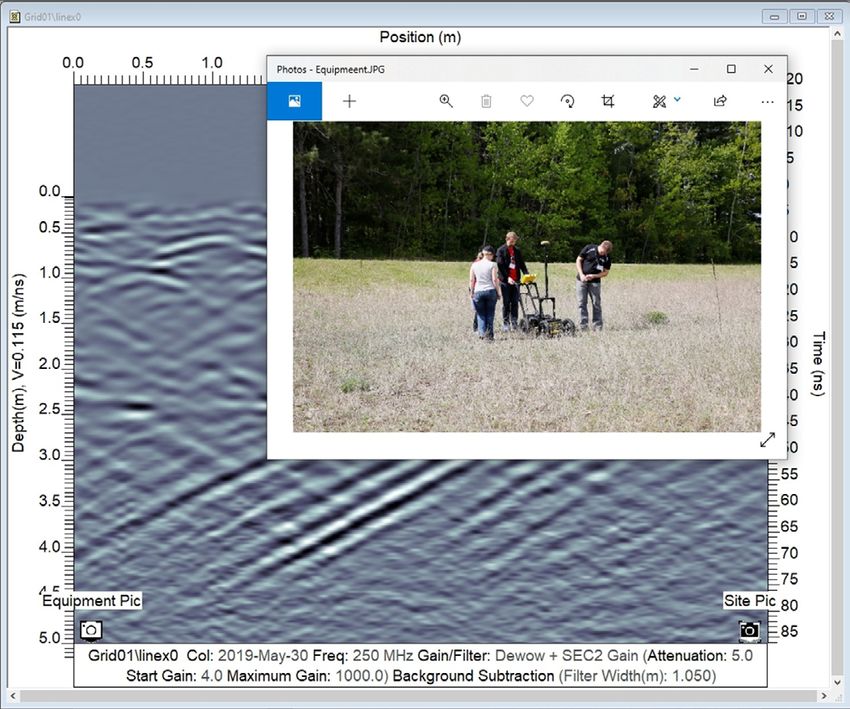
SUBSURFACE VIEWS JANUARY 2021                                                                                                             5
                                                                         Sensors & Software + Radiodetection –
                                                                         What does it mean for you?
                                                                         On November 12, 2020, Sensors & Software was acquired
                                                                         by SPX Corporation and is now part of the Radiodetection
                                                                         business unit. This acquisition builds on the ten-year
                                                                         partnership Sensors & Software and Radiodetection have
                                                                         had together and opens many new opportunities for both
                                                                         organizations.

                                                                         Radiodetection is a worldwide leader in damage prevention
                                                                         and is highly renowned for their Precision Locators & Cable
                                                                         Avoidance Tools for the utility, construction & infrastructure
                                                                         markets.

                                                                         Since the acquisition was announced, we have received
                                                                         several questions from our customers along the lines of
                                                                         “What does this mean for Sensors & Software’s non-utility
                                                                         GPR systems?” Let us assure you that there is no reason for
                                                                         concern. SPX Corporation & Radiodetection are focused on
                                                                         growth, and the purchase of Sensors & Software is a strategic
                                                                         move to build capability and open new markets for the
  Figure 6: Editing grids includes adding grids together, adding         company. One of the reasons that Sensors & Software was an
  lines to a grid, moving lines in a grid, changing the direction of a   attractive acquisition for Radiodetection is that we operate
  line, and changing the line spacing.                                   in areas beyond their current markets, and Radiodetection is
                                                                         committed to maintaining and growing the company’s overall
Data Export to point cloud: Third-party point cloud                      presence in these markets.
software can be used for plotting very large scientific data
sets. Originally developed for LiDAR, 3D Laser scans and                 Joining the larger SPX family of companies allows us
photogrammetry, point cloud visualization software can be a              to combine technical expertise in robotics engineering,
useful tool for visualizing GPR data collected with GPS.                 inspection camera capabilities, GPS mapping technologies,
EKKO_Project now includes a new point cloud CSV file                     software development, precision locating and ground
export option so GPR data can easily be imported into point              penetrating radar technology. All of which enable exciting
cloud software. For example, Figure 7 shows a GPR line                   opportunities for future product innovation across many
zigzagging over two utilities (indicated by hyperbolas) plotted          industries.
in CloudCompare, a free to use 3D point cloud processing
software.                                                                Although Sensors & Software has always been a global
                                                                         company, with customers and partners all over the world, this
                                                                         acquisition exponentially expands our presence and allows
                                                                         us to take advantage of new reach and resources provided
                                                                         by Radiodetection and SPX Corporation. Should you have
                                                                         any questions about our products, how to apply GPR to your
                                                                         specific application areas, or just want to share how you are
                                                                         using our GPR solutions, please contact us. The same team
                                                                         you have always worked with is here to provide you with the
                                                                         high level of customer service that you have come to expect
                                                                         from us over the years.

                                                                         We are all very excited about this relationship and the
                                                                         possibilities it provides for our employees, our business, our
                                                                         future product innovations, and most importantly, you, our
                                                                         valued customers.

                                                                         If you have questions or concerns, contact us!

  Figure 7: GPR line data plotted in third-party point cloud software
  called CloudCompare.

These are some of the new features in EKKO_Project Version
6. To learn more about EKKO_Project, including upgrading or
purchasing, contact us.

                                                                                                                  continued on page 6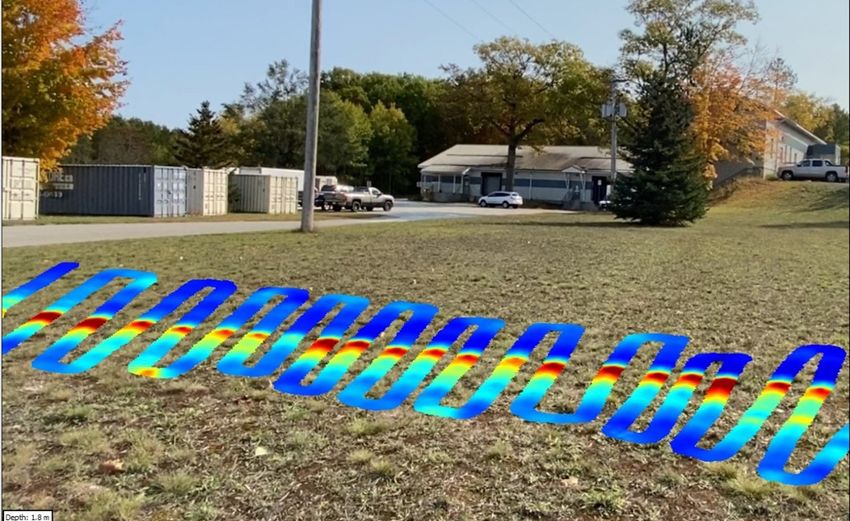
SUBSURFACE VIEWS JANUARY 2021                                                               6
SensoftU - Online Training
SensoftU is our new interactive online learning platform, which takes our
GPR training courses to a new level. Rather than just watching videos or
static presentations, SensoftU features true interactive courses where the
user is engaged, learning, interacting, and answering questions along the
way. Visit www.SensoftU.com for the course catalog.

***New*** IceMap Course
We are pleased to announce the addition of an online training course for
IceMap users!

Using slides, videos and interactions, participants will learn how to setup,
configure, and collect data using IceMap. There are questions throughout
the course to ensure quality learning and retention of key concepts.

This course is suited for anyone who is new to ice profiling, as well as those
who may need refresher training (especially after a
long break since the last ice season!).

Topics covered include:
•   Importance of continuous ice measurements
•   GPR reflections
•   Setting up the IceMap hardware and software
•   Collecting data
•   Doing an Ice Calibration
•   Data Interpretation
•   Case examples

Upon passing the final test, users will receive a certificate of course
completion.

Visit SensoftU and start learning.

Upcoming Courses
GPR: Principles, Practice & Processing
•   January 26, 2021 - Online 9:00am to 5:00pm EST

Webinar in association with Nulca - Interpreting GPR Utility Data: Tips & Tricks
•   February 10, 2021 - Online

GPR Course - SAGEEP 2021
•   March 19, 2021 - 1/2 Day Online, Registration details coming soon

Utility Locating with GPR course part of Damage Prevention Week
•   March 24, 2021 - Online, Full day, Instructor-led

Upcoming Events
                                                                                   subsurface

•   Transportation Research Board (TRB) Show - Online, January 25-29, 2021
                                                                                   solutions
                                                                                   imaging

Sensors & Software Inc.
1040 Stacey Court		                +1 905 624 8909
Mississauga, ON			                 +1 800 267 6013
Canada L4W 2X8			                  www.sensoft.ca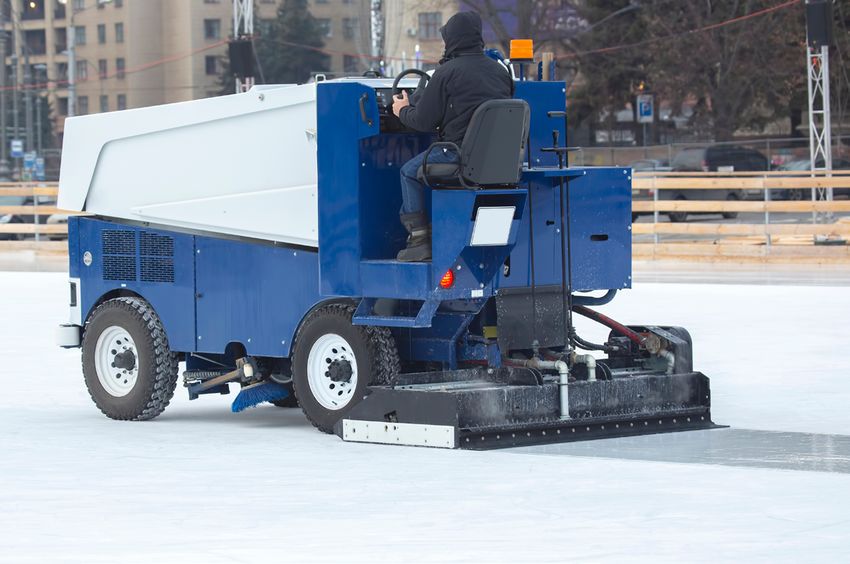
You can also read