The Effect of Inflation, Exchange Rate, BI Rate and Dow Jones Index to Indonesia Composite Index in Indonesia Stock Exchange on the Year 2013-2018
←
→
Page content transcription
If your browser does not render page correctly, please read the page content below
International Journal of Science and Society, Volume 3, Issue 3, 2021 The Effect of Inflation, Exchange Rate, BI Rate and Dow Jones Index to Indonesia Composite Index in Indonesia Stock Exchange on the Year 2013-2018 Hasanudin Universitas Nasional, Jakarta, Indonesia Email: hasanudinsadikin910@gmail.com Abstract The purpose of this study is to demonstrate the influence of inflation, currency exchange rates, SBI interest rates, and the Dow Jones index on the Jakarta Composite Index on the Indonesian Stock Exchange from 2013 to 2018. Methods of quantitative research utilizing Structural Equation Modeling (SEM) analytic techniques in conjunction with the use of SmartPLS 3. The findings of this study indicate that inflation has a substantial negative influence on the CSPI. This indicates that as inflation increases, the JCI decreases. The exchange rate has a substantial negative effect on the JCI. This demonstrates that the exchange rate variable has a direct effect on the direction of the high exchange rate, lowering the JCI in the process. The SBI interest rate has no effect on the JCI and is rather detrimental to it. This indicates that when the number of SBI interest rates increases, the CSPI remains same. The Dow Jones index has a sizable positive correlation with the CSPI. This indicates that the Dow Jones index's rise has an effect on the JCI. By a factor of 0.982, the Dow Jones Index has the greatest effect on work motivation, followed by inflation, exchange rates, and SBI interest rates on the IHSG on the 2013-2018 Stock Exchange. Keywords: Inflation, Exchange Rate, BI Rate, Dow Jones Index, Indonesia Composite Index. —————————— —————————— A. INTRODUCTION The Dow Jones Composite Stock Price Index (JCI) is a broad measure of capital market activity. JCI enumerates a series of data points pertaining to the combined stock's price movements up to a specified date (Astuti, 2016). Typically, daily stock price changes are provided based on the stock exchange's closing price for that day. The index is provided for a specified time period. JCI Is a number that serves as a barometer of a joint stock's performance on the stock exchange (Taufiq & Kefi, 2015). The objective of the combination is to account for the performance of multiple, if not all, shares listed on the stock exchange (Sunariyah, 2004). An increase in the JCI indicates that the capital market is bullish; on the other hand, if it decreases, it means that the capital market is bearish. So, an investor must understand the pattern of stock price behavior in the capital market (Sari, 2019). The Composite Stock Price Index is one index that investors frequently monitor while investing on the Indonesia Stock Exchange. This is because this index is a weighted average of all stocks traded on the Indonesian Stock Exchange. As a result, an investor may determine if the market is pleased or sluggish by monitoring the Composite Stock Price Index movement (Ilmi, 2017). Diverse market situations IJSOC © 2021 http://ijsoc.goacademica.com 50
International Journal of Science and Society, Volume 3, Issue 3, 2021

necessitate distinct investment methods from investors. Numerous variables can
influence the stock index, including changes in the benchmark interest rate,
worldwide economic circumstances, global energy costs, and a country's political
stability (Febriyanto, 2016). On April 1, 1983, the Composite Stock Price Index was
created as a measure of the price movement of all shares listed on the Indonesia
Stock Exchange, both ordinary and preferred stock. The Composite Stock Price (JCI)
is a stock price index number that has been computed and collated to create a trend,
where an index number is a numerical value that can be used to compare events in
the form of periodic changes in stock prices (Jogiyanto, 2000).
 The movement of the JCI is influenced by several factors, factors originating
from within the country (internal) and factors arising from abroad (external) (Wijaya
& Agustin, 2015). Factors originating from within the country can come from
fluctuations in currency exchange rates in a country against other countries, inflation
rates, inflation rates, and interest rates in that country, economic growth, social,
political, and security conditions. etc. While factors originating from abroad
(external) are the stock exchanges that have a strong influence on the stock
exchanges of other countries, namely stock exchanges belonging to developed
countries such as America, Japan, England, and so on. In addition, investor behavior
also affects the performance of the Jakarta Composite Index (Yanuar, 2012).
 The inflation rate has an effect on the IDX's Composite Stock Price Index.
Inflation is a term that refers to the depreciation of money's buying power. With
inflation, the cost of products will continue to rise, eroding people's buying power
(Kewal, 2012).
 Based on data from Bank Indonesia, the following is inflation data that
occurred in Indonesia from 2013 to 2018:
 Table 1 Inflation Data in Indonesia
 Year Inflation Rate (%)
 2013 8.38
 2014 8.36
 2015 3.35
 2016 3.02
 2017 3.61
 2018 3.13
 Source: Bank Indonesia Data
 Table 1 shows that in 2013 the inflation rate was 8.38%, caused by the increase
in fuel prices, which increased the cost of food. In 2013, inflation hit 11.06 percent,
the highest level since the 2008 financial crisis. And in 2014, the inflation rate only
decreased by 0.02% from the previous year. In 2015 inflation experienced a drastic
decline to 3.35%. Inflation in 2015 was the lowest in the last five years since 2010; this
was due to the weakening of people's purchasing power, resulting in a decrease in
demand for goods so that traders did not increase prices. And in 2016, it was at 3.02;
in 2017, it was at 3.61%, and in 2018 it was at 3.13%.

 IJSOC © 2021
 http://ijsoc.goacademica.com

 51
International Journal of Science and Society, Volume 3, Issue 3, 2021

 In 2013, inflation reached a record high of 11.06 percent, the highest level
since the financial crisis of 2008 (Santi & Hidayat, 2017).
 The following are the SBI interest rates for 2013-2018, namely:
 Table 2 SBI Interest Rates
 Year Interest Rate
 2013 6.479
 2014 7.542
 2015 7.521
 2016 6
 2017 4.562
 2018 5.104
 Source: www.bi.go.id
 Based on the data above, that throughout 2016, Bank Indonesia (BI) has
slashed the benchmark interest rate, dubbed the BI Rate, four times in the last year.
Since early 2016, the SBI interest rate has been lowered by 100 basis points (bps) to
6.5 percent. This position is the lowest since August 2013. The decline in the
benchmark interest rate is aimed at spurring growth in the sluggish domestic
economy.
 The exchange rate of a foreign currency is the price of the currency of one
country relative to the currencies of other countries (Thobarry, 2009). The rise of the
rupiah against major currencies is a favorable development for investors.
 The following is exchange rate data from 2013-2018, namely:

 Figure 1 Exchange
 Source: www.bi.go.id

 Based on the graph above, it is clear that in early 2013 Indonesia's economic
condition is targeted to grow by six percent, referring to last year's growth which
was above this figure. However, beyond expectations, the weakening of the rupiah
in 2013 the exchange rate on January 2 = Rp. 9,733 per US dollar, then December 30 =
Rp. 12,331 per US dollar (-26.69%) and December 31 = Rp. 12,250 per US dollar (-
25.89%).
 IJSOC © 2021
 http://ijsoc.goacademica.com

 52
International Journal of Science and Society, Volume 3, Issue 3, 2021

 Apart from the Dow Jones Transportation Index, the Dow Jones Index is the
oldest stock market index in America. The Wall Street Journal and Dow Jones &
Company editors jointly released the Dow Jones Index for the first time on May 26,
1896. The Dow Jones index is a weighted average of 12 companies from the United
States' most essential industries (Kurniawan, 2013).
 The following is the Dow Jones index data for 2013-2018 as follows:

 Figure 2 Graph of 2Dow Jones Industrial Average
 The impact of external variables that affect the JCI, namely the influence of
America (US), is tremendous for other countries; this also includes the power of
companies and their investors. Thus, the DJIA (Dow Jones Industrial Average),
which is one of the NYSE (New York Stock Exchange) indexes, will have an effect on
the movement of other nations' indexes.
 The framework of thinking in this study may be summarized as follows,
based on the theoretical foundation and the findings of prior research:

 Inflation (X1)

 Exchange (X2)
 JCI (Y)
 Rate (X3)

 Dow Jones Index (X4)

 IJSOC © 2021
 http://ijsoc.goacademica.com

 53
International Journal of Science and Society, Volume 3, Issue 3, 2021

 Based on the research framework, the hypotheses that can be formulated are
as follows:
 H1: Inflation affected the JCI on the IDX in 2013-2018
 H2: Exchange rate affected the JCI on the IDX in 2013-2018
 H3: Interest rates affected the JCI on the IDX in 2013-2018
 H4: The Dow Jones Index acted as the JCI on the IDX in 2013-2018.

B. METHOD
 The JCI index is constructed using all publicly traded firms as components in
order to accurately reflect market conditions. The Indonesian Stock Exchange has the
power to issue and/or omit from the JCI calculation one or more listed firms. The
foundation for consideration is, among other things, the public's ownership of the
listed company's shares (free float). Simultaneously, the market capitalization is
fairly substantial. So that changes in the stock price of the listed companies can affect
the fairness of the JCI movement. In this study, the JCI data used is the monthly
IHSG Closing Price data published on the IDX in 2013-2018. According to Samsul
(2006), the measuring tools used to determine the IHSG level are as follows:

 = 100%

Information:
NP: The weighted average market value (number of shares listed on the stock exchange multiplied by
 the market price per share) of common shares and preferred shares on day t.
ND: Base value, which is the cumulative number of shares on the base day times the base price on the
 base day.
 The independent variables are inflation (X1), exchange rates (X2), interest rates
(X3), and also the Dow Jones Index (X4).

Inflation (X1)
 According to Kuncoro (2013), the Consumer Price Index is used to monitor
inflation (CPI). The CPI has historically been used to assess monetary policy's
performance in containing inflation since it is more readily available than other
measures such as the Free Trade Price Index (IHPB) and the GDP deflator. The CPI is
a price index that is used to determine the general average change in the prices of a
variety of commodities during a certain period of inflation. In this study, the
inflation data used is the monthly closing price inflation data published in 2013-2018.
The following formula describes the calculation of inflation:
 − − 1
 =
 − 1
Exchange (X2)
 According to Sukarno (2010:400), the real exchange rate is the relative price of
goods between one country and another. Simply put, it can be analogized as follows,
the price of a car in Indonesia is 300,000,000 rupiah, and the cost of a vehicle in
America is $20,000. To compare the costs of the two cars, we change them using the

 IJSOC © 2021
 http://ijsoc.goacademica.com

 54
International Journal of Science and Society, Volume 3, Issue 3, 2021

nominal exchange rate first; if 1 US dollar is 13,500, then the price of a vehicle in
America is 30,000,000 rupiahs cheaper than in Indonesia. In this study, the exchange
rate data used is the average monthly exchange rate data published in BI in 2013-
2018. According to Sukirno (2010), to calculate the real exchange rate, the following
formula can be used:
 ℎ
 ℎ =

SBI Interest Rate (X3)
 Indonesian Bank SBI certificates are short-term debt (1-3 months) securities
issued by Bank Indonesia under a discount/interest scheme. SBI is one of the
measures employed by Bank Indonesia to maintain the Rupiah's stability. Bank
Indonesia can absorb surplus base money in circulation by selling SBIs.
 A market mechanism based on an auction system determines the interest rate
applied to each sale of SBI. Since early July 2005, BI has employed the "BI rate"
mechanism (SBI interest rate), in which BI stated the target SBI interest rate for
auctions for a specified time. This bid-ask spread is then utilized as a reference point
for market players when they participate in the auction.
 In this study, the SBI interest rate used is in the monthly period. Therefore,
SBI interest rate data obtained in the daily period will be converted into monthly
periods with the following formula:

 = Total Daily Interest Rate for One Month Divided by the Number of Periods

Note: Bank Indonesia (BI) has stopped issuing Bank Indonesia Certificates (SBIs) with a tenor of fewer
than nine months, as of February 2011.

Dow Jones Index (X4)
 As defined by Tamara (2013), the Dow Jones Industrial Average (DJIA) is a
price-weighted average of 30 stocks belonging to blue-chip firms that are typically
leaders in their respective industries in the United States of America. These 30 stock
markets concentrate on several sectors, especially automotive, steel, oil, and
chemical (Hartman et al., 2001). In this study, the DJIA data used is the monthly
DJIA Closing Price data published in 2013-2018. The Dow Jones index has the
following calculation (Syarofi, 2014):
 30
 ∑
 DJIA = =1

Population and Sample
 A sample of data from the Indonesia Stock Currency at the end of each month
was utilized in this study, including data on inflation, exchange rates, interest rates,
and the Dow Jones index at the end of each month (close price). At the same time,
the sample taken is the data for the period 2013-2018, which is calculated based on
the average market value every month.

 IJSOC © 2021
 http://ijsoc.goacademica.com

 55
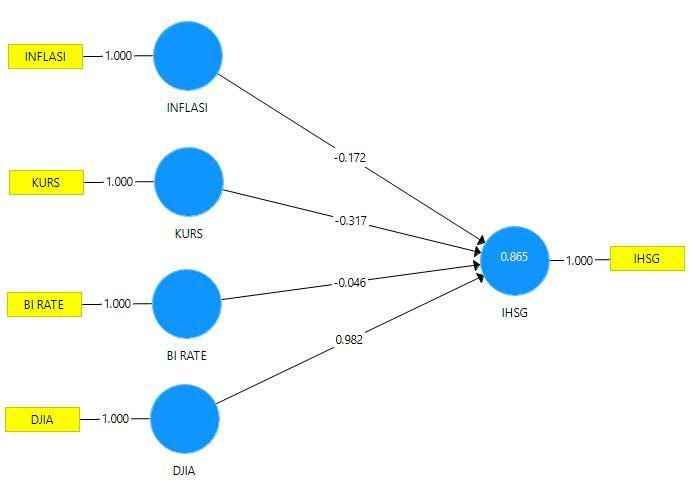
International Journal of Science and Society, Volume 3, Issue 3, 2021

Data Collection Techniques
 Data is collected through online data available on the Indonesia Stock
Exchange, which uses the JATS (JSX Trading System) system, which is transaction
information between exchange members. Data from JATS may only be filled in by
stock exchange members who are members of the Indonesian Clearing and
Guarantee Corporation (KPEI) to avoid errors in the data input process. The data
was taken from the official website of the Indonesia Stock Exchange
(www.IDX.co.id) and the official website of Bank Indonesia (www.bi.go.id).

Data Analysis Method
 The quantitative approach was used to analyze the data collected in this
study, i.e., the use of numbers formulas or mathematical models to determine
whether or not macroeconomic variables, in this case, the gross national product, SBI
interest rates, inflation, and exchange rates, have an impact on the data collected in
this study. The IHSG IDX incorporates foreign exchange and the Dow Jones index.
PLS was utilized as a data analysis approach (Partial Least Square).

C. RESULT AND DISCUSSION
 The results of data tabulation for the dependent and independent variables
are presented in Appendix 1. The descriptive statistics of each variable are shown in
Table 3 as follows:
 Table 3 Descriptive Statistics
 Variables Minimum Maximum Mean Std. Deviation
 Inflation 2.790 8.790 5.051 1.865
 Exchange 9,686.65 15,178.87 12,773.88 1,340.339
 SBI Interest Rate 4.250 7.750 6.201 1.261
 Dow Jones Index 13,860.58 26,458.31 19,065.88 3,478.374
 JCI 4,195.090 6,605.630 5,227.085 608.639
 Source: PLS Data Processing Results
 Based on the descriptive statistical test results in Table 3, the results can be
explained as follows.
 1. During 2013-2018, the lowest inflation was at 2.79% in August 2016, and the
 highest inflation was 8.79% in August 2013, with an average inflation rate of
 5.051% and a standard deviation of 1.865%. This means that inflation in 2013-
 2018 is centered at 5,051 with a standard deviation of 1.865%.
 2. During 2013-2018, the lowest exchange rate was IDR 9,686.65 in February
 2013, and the highest exchange rate was IDR 15,178.87 in October 2018 with
 an average value of 12,773.88 and a standard deviation of 1,340,339. This
 means that the exchange rate for 2013-2018 is concentrated at Rp. 12,773.88
 with a standard deviation of 1,340,339.
 3. During 2013-2018, the lowest SBI interest rate was 4.25% from September 2017
 to April 2018, and the highest was 7.75% from November 2014 to January

 IJSOC © 2021
 http://ijsoc.goacademica.com

 56
International Journal of Science and Society, Volume 3, Issue 3, 2021

 2015 with an average inflation rate of 6.201% and a standard deviation of
 1.261%. This means that the SBI interest rate for 2013-2018 is centered at
 6.201%, with a standard deviation of 1.261%.
 4. During 2013-2018, the lowest Dow Jones Index was 13,860.58 in January 2013,
 and the highest was 26,458.31 in September 2018 with an average inflation
 rate of 19,065.88 and a standard deviation of 3,478,374. This means that the
 Dow Jones Index in 2013-2018 converges at 19,065.88 with a standard
 deviation of 3,478,374.
 5. During the 2013-2018 period, the lowest JCI was IDR 4,195,090 in August
 2013, and the highest was IDR 6,605.630 in January 2018, with an average
 value of IDR 5,227,085 and a standard deviation of 608,639. This means that
 the exchange rate for 2013-2018 is concentrated at Rp. 5,227,085 with a
 standard deviation of 608,639.
 The results of data analysis using PLS are as follows:

 Figure 3 PLS Algorithm Output Results
 In Figure 4.2 above, it is explained that the round shape is reflected as a
variable, and the square shape is reflected as an indicator. In this study, each
variable is the same as the indicator, then also explained between direct and indirect
relationships. The direct connection is inflation with the JCI, the exchange rate, the
JCI, the SBI Interest Rate with the JCI, and the Dow Jones Index with the JCI.
 The results of the Structural Model Evaluation with R Square show the
following data:
 Table 4 Significance Test
 Original Sample Standard Deviation T Statistic P
 Mean (M)
 (O) (STDEV) (| O/STDEV |) Values
JCI 0.865 0.876 0.022 40.043 0.000
 Source: PLS Data Processing Results
 On the basis of the data in Table 4, the R2 value for the JCI variable is 0.865, or
86.5 percent, according to the test results. This may be interpreted as indicating that
the inflation, exchange rate, SBI interest rate, and Dow Jones index variables can
 IJSOC © 2021
 http://ijsoc.goacademica.com

 57
International Journal of Science and Society, Volume 3, Issue 3, 2021

explain 86.5 percent of the variability of the Composite Stock Price Index variable.
Other variables not included in this research model have an impact on the remaining
13.5 percent, according to the findings of this study.
 To evaluate the causality link created in the model, specifically, the
relationship between exogenous variables and the relationship between moderating
factors and endogenous variables, hypothesis testing is utilized. T statistics, as seen
in the accompanying table, provide information on hypothesis testing.
 Table 5 Hypothesis Test (t-test)
 Original Mean Standard Deviation T Statistic P
 Sample (O) (M) (STDEV) (| O/STDEV|) Values
BI RATE -> JCI -0.046 -0.053 0.069 0.666 0.507
DJIA -> JCI 0.982 0.983 0,059 16.543 0,000
INFLATION-> JCI -0.172 -0.162 0.079 2.189 0.032
EXCHANGE -> JCI -0.317 -0.310 0.062 5.112 0.000
 Source: PLS Data Processing Results
 For example, if the T-Statistic value is larger than the critical value (t-table), it
is suggested that an influence exists between the exogenous variables and their
effects on their effects on the endogenous variables on each of the pre-defined
hypotheses.
 According to the first hypothesis, inflation has a negative and statistically
significant impact on the JCI. Following the tests, the inflation variable has a T-
statistic value of 2.189 and a p-value of 0.032, while the crucial value (t table) is 1.66
and has a p-value less than 0.05 or 5 percent. The results of the tests reveal: This
results in a -0.172 on the original sample's results page. The results of the tests reveal
that the T-statistical value is more than the critical value (t-table) and that the p-
value is less than 0.05, indicating that the original model is negative.
 It is proposed in the second hypothesis that the exchange rate has a negative
and statistically significant impact on the JCI. The results of the tests reveal that the
exchange rate variable has a T-statistical value of 5.112 and a p-value of 0.000,
whereas the critical value (t table) is 1.66 and the p-value is less than 0.05 or 5
percent, and the critical value (t table) is less than 0.05 or 5 percent. The findings of
the original sample are -0.317, as is the result of the second sample. The results of the
test reveal that the T-statistical value is more than the critical value (t-table) and the
p-value is less than 0.05, indicating that the original sample is negative.
 Lastly, the third hypothesis asserts that the SBI interest rate has little or a
negative impact on the JCI. T-statistic values of 0.666 and 0.507 are obtained for the
SBI Interest Rate variable, while the critical value (t table) is 1.66 and the p-value is
less than 0.05, or 5 percent, is obtained for the SBI Interest Rate variable. This results
in a -0.046 in the original sample's results as well. The results of the test reveal that
the value of T-statistics is greater than the critical value (t-table) and the p-value is
greater than 0.05, and the original sample is positive.
 It is proposed in the fourth hypothesis that the Dow Jones Index has a
positive and statistically significant impact on the JCI. These tests reveal that the

 IJSOC © 2021
 http://ijsoc.goacademica.com

 58
International Journal of Science and Society, Volume 3, Issue 3, 2021

exchange rate variable has a T-statistical value of 16.543 and a p-value of 0.000,
whereas the critical value (t table) is 1.66 and a p-value of less than 0.05 or 5 percent
for the crucial variable (t table). In addition, the initial sample results are 0.982
percent. The results of the tests demonstrate that the T-statistical value is more than
the critical value (t-table) and that the p-value is less than 0.05, and therefore the
original sample is positive.

D. CONCLUSION
 According to the first hypothesis, inflation has a statistically significant
negative impact on the JCI. This indicates that the higher the rate of inflation, the
lower the value for the JCI. Specifically, the second hypothesis indicates that the
exchange rate has a statistically significant negative impact on the JCI. According to
this data, the direction of exchange rates is directly influenced by the variable. The
higher the exchange rate is, the lower the JCI figure. Third, it is hypothesized that the
SBI Interest Rate has no influence on the JCI and is even negative for the index. As a
result, the rising number of SBI interest rates has no effect on the JCI, as previously
stated. It is proposed in the fourth hypothesis that the Dow Jones Index has a
statistically significant beneficial influence on the JCI. According to this, the rising
Dow Jones index has an effect on the JCI.

REFERENCES
1. Astuti, R. (2016). Pengaruh Faktor Makro Ekonomi Terhadap Indeks Harga
 Saham Gabungan (IHSG) di Bursa Efek Indonesia (BEI) Periode 2006-2015. Jurnal
 Berkala Ilmiah Efisiensi, 16(2).
2. Bank Indonesia. (2012). Indonesia Financial Statistic. Jakarta: BI.
3. Bank Sentral Indonesia. (2019). Data BI Rate. Available at:
 http://www.bi.go.id/web/id/moneter/bi+rate/data+BI+rate.html, Retrieved on 15
 January 2019.
4. Dwi Santi, R., & Diena Hidayat, S. (2017). Pengaruh Rasio Pembayaran DPR dan
 Tingkat Suku Bunga BI Terhadap Harga Saham Perusahaan Manufaktur Sub
 Sektor Properti dan Real Estate pada Bursa Efek Indonesia BEI Periode 2005-
 2013. JIKA: Jurnal Ilmu Keuangan dan Perbankan, 3(2).
5. Febriyanto, F. (2016). Analisis Perubahan Nilai Indonesia Crude Price (ICP) Dan
 Pengaruhnya Terhadap Indeks Harga Saham Gabungan (IHSG) Periode
 Pengamatan Sebelum Pemberlakuan MEA. Derivatif: Jurnal Manajemen, 10(1).
6. Ilmi, M. F. (2017). Pengaruh Kurs/Nilai Tukar Rupiah, Inflasi dan Tingkat Suku
 Bunga SBI Terhadap Indeks Harga Saham Gabungan LQ-45 Periode Tahun 2009-
 2013. Nominal: Barometer Riset Akuntansi dan Manajemen, 6(1), 93-108.
7. Jogiyanto. (2000). Teori Portofolio dan Analisis Investasi Yogyakarta: BPFE.
8. Kewal, S. S. (2012). Pengaruh Inflasi, Suku Bunga, Kurs, dan Pertumbuhan PDB
 Terhadap Indeks Harga Saham Gabungan. Jurnal Economia, 8(1), 53-64.
9. Kuncoro, M. (2013). Metode Riset untukBisnis dan Ekonomi. Jakarta: Erlangga.

 IJSOC © 2021
 http://ijsoc.goacademica.com

 59
International Journal of Science and Society, Volume 3, Issue 3, 2021

10. Kurniawan, Y. J. (2013). Analisis Pengaruh Tingkat Suku Bunga SBI, Inflasi,
 Harga Minyak Dunia, Harga Emas Dunia, Kurs Rupiah terhadap Dollar
 Amerika, Indeks Nikkei 225, dan Indeks Dow Jones terhadap Indeks Harga
 Saham Gabungan. Jurnal Ilmiah.
11. Samsul, M. (2006). Pasar Modal dan Manajemen Portofolio. Jakarta: Erlangga.
12. Sari, W. I. (2019). Analisis Pengaruh Inflasi, Suku Bunga SBI, Nilai Tukar
 terhadap Return LQ 45 dan Dampaknya Terhadap Indeks Harga Saham
 Gabungan (IHSG) Di Bursa Efek Indonesia (BEI). Jurnal SEKURITAS (Saham,
 Ekonomi, Keuangan Dan Investasi), 3(1), 65-75.
13. Sukirno, S. (2010). Makroekonomi: Teori Pengantar. Volume III. Jakarta: Rajawali
 Pers
14. Sunariyah. (2003). Pengantar Pengetahuan Pasar Modal. Jakarta: Erlangga.
15. Syarofi, 2014. Analisis Pengaruh Suku Bunga SBI, Kurs Rupiah/US$, Harga
 Minyak Dunia, Harga Emas Dunia, DJIA, Nikkei 225, dan Hang Seng Index
 Terhadap IHSG Dengan Metode GARCH-M (Periode Januari 2003-Mei 2013).
 Skripsi Universitas Diponegoro.
16. Tamara, S. F. (2013). Pengaruh Dow Jones Industrial Average, Deutscher
 Aktienindex, Shanghai Stock Exchange Composite Index, dan Straits Times Index
 Terhadap Indeks Harga Saham Gabungan di Bursa Efek Indonesia (Periode 2010-
 2012). Jurnal Ilmiah Mahasiswa FEB.
17. Taufiq, M., & Kefi, B. S. (2015). Pengaruh Inflasi, BI Rate dan Kurs Terhadap
 Indeks Harga Saham Gabungan. Jurnal Ekonomi Manajemen Akuntansi, 22(38).
18. Thobarry, A. A. (2009). Analisis Pengaruh Nilai Tukar, Suku Bunga, Laju Inflasi dan
 Pertumbuhan GDP Terhadap Indeks Harga Saham Sektor Properti (Kajian Empiris pada
 Bursa Efek Indonesia Periode Pengamatan Tahun 2000-2008) (Doctoral Dissertation,
 Program Pasca Sarjana Universitas Diponegoro).
19. Wijaya, T. S. J., & Agustin, S. (2015). Faktor-Faktor Yang Mempengaruhi Nilai
 IHSG yang Terdaftar di Bursa Efek Indonesia. Jurnal Ilmu dan Riset Manajemen
 (JIRM), 4(6).
20. Yanuar, A. Y. (2012). Dampak Variabel Internal dan Eksternal Terhadap Indeks
 Harga Saham Gabungan (IHSG) di Indonesia. Jurnal Ilmiah Mahasiswa FEB, 1(2).

 IJSOC © 2021
 http://ijsoc.goacademica.com

 60
You can also read