The minimal COVID-19 vaccination coverage and efficacy to compensate for potential increase of transmission contacts, and increased transmission ...
←
→
Page content transcription
If your browser does not render page correctly, please read the page content below
The minimal COVID-19 vaccination coverage and efficacy to
 compensate for potential increase of transmission contacts, and
 increased transmission probability of the emerging strains
Biao Tang1,2,†, Xue Zhang3,†, Qian Li1, Nicola Luigi Bragazzi4, Dasantila

Golemi-Kotra5, Jianhong Wu4,6,*
1 School of Mathematics and Statistics, Xi'an Jiaotong University, Xi'an, China
2 The Interdisciplinary Research Center for Mathematics and Life Sciences, Xi'an Jiaotong
University, Xi'an, China
3 Department of Mathematics, Northeastern University, Shenyang, Liaoning, China
4 Laboratory for Industrial and Applied Mathematics, York University, Toronto, Ontario,
Canada
5 Department of Biology, York University, Toronto, Ontario, Canada
6 Laboratory of Mathematics for Public Health, Fields Institute, Ontario, Canada

* Correspondence to: wujh@yorku.ca
† The two authors contributed equally

Abstract:

Background: Mass immunization is a potentially effective approach to finally
control the local outbreak and global spread of COVID-19 pandemic.
However, it can also lead to undesirable outcomes if mass vaccination results
in increased transmission effective contacts and relaxation of other public
health interventions due to the perceived immunity from the vaccine.

Methods: We designed a mathematical model of COVID-19 transmission
dynamics that takes into consideration the epidemiological status, public
health intervention status (quarantined/isolated), immunity status of the
population, and the strain variations. Comparing the control reproduction
numbers and the final epidemic sizes (attack rate) in the cases with and without
vaccination, we quantified some key factors determining when vaccination in
the population is beneficial for preventing and controlling future outbreaks.

Results: Our analyses predicted that there is a critical (minimal) vaccine
efficacy rate (or a critical quarantine rate) below which the control reproduction
number with vaccination is higher than that without vaccination, and the final
attack rate in the population is also higher with the vaccination. We also
predicted the worst case scenario occurs when a high vaccine coverage is
achieved for a vaccine with lower efficacy rate and when the vaccines increase
the transmission efficient contacts.
Conclusions: The analyses show that an immunization program with a vaccine
efficacy rate below the predicted critical values will not be as effective as simply
investing in the contact tracing/quarantine/isolation implementation. We
reached similar conclusions by considering the final epidemic size (or attack
rates). This research then highlights the importance of monitoring the impact
on transmissibility and vaccine efficacy of emerging strains.

Key words: COVID-19; Vaccination; Compartment model; Reproduction
numbers; Final Size, Attach Rate, Strain variations.

Background: The severe acute respiratory syndrome coronavirus 2 (SARS-
CoV-2 has caused a global pandemic since it was first reported in the Wuhan
city of the Hubei Province of China, in December of 20191. As of December 26,
2020, there were 78,383,527 COVID-19 confirmed cases and 1,740,390 death
cases linked to COVID-19 globally2. It remains paramount to circumvent the
spread of COVID-19, especially considering the emerging of strain variation
and its impact on transmissibility
 Vaccination, as an important method, has substantially improved health
and reduced mortality for many infectious diseases3-4. There have been
significant COVID-19 vaccine developments that mass vaccination in the
population in the first half of 2021 becomes possible and this immunization
can be potentially the most effective method to successfully control the local
outbreaks and global spread of the COVID-19 pandemics.
 Several modelling studies have attempted to analyze the role of vaccine in
controlling COVID-19 epidemics5-7, especially with focus on optimal
vaccination programs8-12. There remain great challenges in using vaccination
to mitigate the COVID-19 epidemics as vaccination in the population could
potentially lead to an increase in the transmission contacts due to the
perceived vaccine-provided immunity. Specifically, when a vaccine is used in
a portion of the population to mitigate COVID-19 transmission, due to the
perceived vaccine-provided immunity, the population may 1) increase their
contact levels with increasing social-economic activities, and/or reduce their
personal protection (less physical distancing and mask wearing); 2) not
quarantine themselves even if their close contacts with infected individuals
have been identified through contact tracing; and 3) not isolate themselves
during the pre-symptomatic stage of the infectious period or during their
asymptomatic infection period when the vaccine fails to provide them with
protection against the infection.
The main purpose of this study is to use a mathematical model to
quantify the minimum vaccination coverage and vaccine efficacy to
compensate for potential increase in transmission contacts, and decrease in
personal protection and/or in compliance with quarantine and isolation
protocol when identified as close contacts of infections. The article is
organized as follows: the mathematical model is formulated in the Methods
section, and is used to examine the impact of vaccination on the control
reproduction numbers as well as the final epidemic size in the Results section.
We then draw conclusions and mark important points of our study in the
Discussion section.

Methods: We designed a mathematical model of COVID-19 transmission
dynamics in the population by assuming that a portion of the population was
vaccinated against COVID-19 to mitigate the COVID-19 transmission. The
transmission model is based on those published and tested against the real
data13-15.

We use for the vaccination coverage. Then the portion (1 − ) of the total
population is the population without vaccination, and this unvaccinated
population is divided into susceptible ( ), exposed ( ), pre-symptomatic ( ),
symptomatic infectious ( ), asymptomatic infectious ( ), and recovered ( )
compartments according to the epidemiological status of individuals. This
population is divided further into diagnosed and isolated ( ) and
quarantined ( + ) compartments according to the public health intervention
status of individuals (Figure 1). More precisely, we assume that a proportion,
 , of COVID-19 infected individuals can be traced and quarantined, while the
other proportion, 1 − , will either move to A class or I class depending on
whether they show symptoms. The ratio of asymptomatic infections is
assumed to be .

The rest of the population, with a ratio , will be vaccinated against COVID-
19. Further, we assume that the vaccine efficacy is . Therefore, the
proportion, , will have the immunity to COVID-19, while the other
proportion, (1 − ), will remain susceptible to COVID-19 even after they are
vaccinated (Table 1). Similarly, we divide this population (i.e. the portion of
population vaccinated but still susceptible to COVID-19) into susceptible ( ),
exposed ( 2 ), pre-symptomatic ( 2 ), symptomatic infectious ( 2 ),
asymptomatic infectious ( 2 ) compartments. We also denote the diagnosed
and recovered population with vaccination as and , respectively. As for
the vaccinated population, we assume that they will not be traced and
quarantined.

We note that most vaccine candidates approved require administration of
two-doses to achieve the maximal efficacy. Because of the supply constraint,
vaccines will also not be delivered and administrated in the entire population
at the same time. These logistic constraints and their implications for the
limitation of our study will be addressed in the final Discussion section.

The transmission diagram is shown in Figure 1, and the corresponding
compartmental model is as follows:
 9(:; ? ? >
 ⎧ ’ = − B
 ,
 ⎪ ’ = 9(:;; ;
The detailed definitions of all the other parameters are listed in Table 1.

Figure 1. An illustration of the COVID-19 transmission dynamics, when the population is
stratified by the epidemiological status, public health status (quarantined/isolated) and
immunization status.

 Table 1. Definitions and values of parameters.
 Parameter Definitions Value Source

 Transmission rate for non-vaccines Vary [13]

 2 Transmission rate for vaccines Vary [13]

 Vaccination coverage of COVID-19 Vary Assumed

 Efficacy rate of COVID-19 vaccine Vary Assumed

 R Modification factor of pre-symptomatic infectiousness 0.0275 Assumed

 Modification factor of asymptomatic infectiousness 0.0275 [13]

 Transition rate of exposed individuals without vaccination to 1/3 [17]
 pre-symptomatic class

 2 Transition rate of exposed individuals with vaccination to pre- 1/3 [17]
 symptomatic class

 1/ρ Pre-symptomatic period ½ [17]

 Quarantine fraction Vary [13]

 Probability of having no symptom among infected individuals 0.2964 [13]

 Transition rate of the symptomatic infected individual without 0.1344 [13]
 vaccination to the diagnosed and quarantined infected class
 + Transition rate of the quarantined infected individuals without 0.1237 [13]
 vaccination to the diagnosed and quarantined infected class

 = Transition rate of the asymptomatic infected individuals 0.1237 Assumed
 without vaccination to the diagnosed and quarantined class

 2 Transition rate of the symptomatic infected individuals with 0.1344 Assumed
 vaccination to the diagnosed and quarantined class

 Recover rate of the symptomatic infected individuals without 0.1957 [13]
vaccination

 2 Recover rate of the symptomatic infected individuals with 0.1957 Assumed
 vaccination

 =2 Recovery rate of asymptomatic infected individuals with 0.139 Assumed
 vaccination

 = Recovery rate of asymptomatic infected individuals without 0.139 [13]
 vaccination

 K Recovery rate of quarantined diagnosed individuals 0.2 [13]

 Disease-induced death rate 0.008 [13]

We will describe our results using the so-called control reproduction number.
This is the total number of new infections generated by an infective individual,
it is called control reproduction number since our model reflects the realty that
certain control interventions are already in place. It is well known that an
outbreak can be prevented if the control reproduction number is below the
threshold value 1. It is also known that if an outbreak cannot be prevented by
the control interventions, then the larger the control reproduction number, the
large the exponential growth rate of the outbreak. Therefore, in what follows,
we examine when the control reproduction number can be less than the
threshold value (with and/or without vaccination), and compare the value of
the control reproduction numbers with and without vaccination.

We first derive the formula for the control reproduction numbers: the control
reproduction number U2 when vaccination is used, and the control
reproduction number U when the vaccine is not used in the population.
Following the standard next generation approach16. These can be calculated
explicitly in terms of model parameters and initial conditions:

Control reproduction number with vaccination:

 U R (1 − )(1 − ) (1 − ) 2 U R (1 − )
 U2 = V + + W+ V + + W
 U + = + = U 2 + 2 =2
 < (RZ[)(RZ\) _>

where, U = (1 − ) U , U = (1 − ) U are the initial susceptible populations
without vaccination and with vaccination, respectively, U is initial total
population.
Control reproduction number without vaccination:

 R (1 − )(1 − ) (1 − )
 U = V + + W
 + = + =

We will also link the control reproduction number to the final size (the attack
rate) in the next section.
Results:

R1. Impact of mass vaccination on control reproduction numbers: We first
focus on comparing the two control reproduction numbers to evaluate when
vaccination in the population is beneficial for the control of a future COVID-19
outbreak.

 Let a = U2 − U . Then, we obtain:
 < (RZ[)
where
 < (RZ[)(RZ\) _>

Again, we note that it may happen that a = will never happen for a vaccine
with any efficacy if
 R (1 − )(1 − ) (1 − ) R (1 − )
 V + + W > 2 V + + W
 + = + = 2 + 2 =2

As we mentioned above, vaccination in the population can potentially lead to
the increase of transmission effective contacts. One the other hand, those
effectively vaccinated will acquire the immunity against the COVID-19
infection. Therefore, the outcome of the transmission in the population is a
nonlinear function of the increasing of the effective contacts as a result of
introducing a vaccine (or after vaccination), and the effective protection of the
vaccine.

We identified three major scenarios. In Scenario 1, there is a critical value of the
quarantine rate above which the vaccination results in higher control
reproduction number: U2 > U when 1 > > ∗ ; and U2 < U when 0 <
 < ∗ . This scenario occurs when the vaccine efficacy rate is moderate so that
a reduction of the quarantine rate to the critical value ∗ will offset the benefit
of vaccine. This is shown in Fig. 2 (A,B,D), so increasing the effort of contact
tracing/quarantine to above the threshold level is more efficient in controlling
the spread of COVID-19. In Scenario 2, U2 > U for any quarantine rate. This
scenario happens when the vaccine efficacy is so low that the control
reproduction number when the vaccine is used is always larger than that when
vaccine is not used, for any rate of quarantine. This is shown in Figure 2(C), so
an immunization program that leads to substantial increase of the disease
transmission effective contacts is counterproductive. In Scenario 3, U2 < U
for all level of quarantine rate, shown in Figure 2(E). This is the case with high
vaccine efficacy. So an immunization program with small disease transmission
effective contacts of vaccines is the most efficient approach to avoid a future
outbreak.

We can also view the interplay between the protection of infection through
vaccine and the relaxation of social distancing of vaccines by comparing the
difference of the control reproduction numbers with and without vaccine when
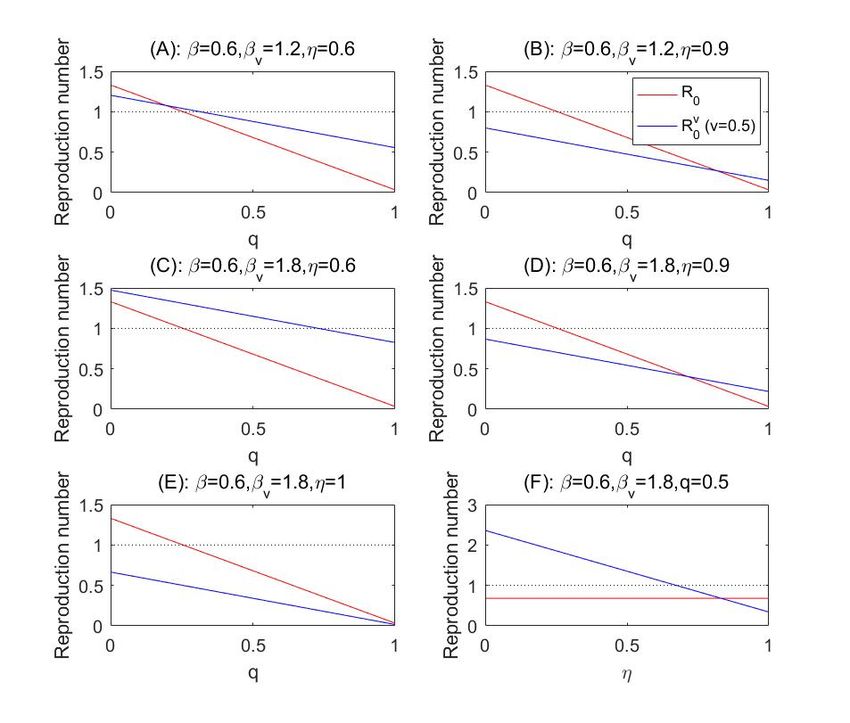
we vary the vaccine efficacy. In the case where 0 < Λl /Θl < 1 (this happens
when the transmission effective contact rate of vaccines is significantly larger
than that for non-vaccine), there is a critical vaccine efficacy ∗ such that U2 >
 U when 0 < < ∗ and U2 < U when 1 > > ∗ , as shown in Figure 2(F).
On the other hand, if Λl /Θl > 1 then U2 < U for all 0 < < 1.

Figure 2. Control reproduction numbers as functions of the quarantine rate or efficacy
rate of the vaccine changes, and the critical vaccine efficacy to compensate for the
increased transmission effective contacts of vaccines. The other parameters are fixed as
those in Table 1.

We report some numerical simulations conducted when we fixed the
vaccination rate = 0.5, and changed the effective contacts for vaccines 2
(Figure 2 (A-E)) or the efficacy of the vaccine. These numerical simulation
results are plotted as the variation of the control reproduction numbers versus
the quarantine rate or the vaccine efficacy rate. Recall that the disease spread
can be prevented when the control reproduction number is below the
threshold 1, marked in the dashed horizontal line. Note that the baseline
transmission rate = 0.6, in the reference case of the Province of Ontario,
Canada, corresponds to the situation that the social contacts return to the level
of 70% of the pre-pandemic normal contacts, while compliance to the personal
protection and social distancing measures is high to reduce the transmission
probability per contact 13-15. More precisely, accordingly to the data-driven
model-based parameter identification, this corresponds to 1). the level of
contacts (4 contacts per day) and transmission probability (0.146 per contact)
achieved in stage 3 of social distancing escalation when Ontario closed all
non-essential workplace; or 2). The level of contacts (8 contacts per day)—
achieved during stage2 of social distancing escalation (closure of public
events and recreational venues, state of emergency) and almost doubling the
social distance guideline compliance to reduce the transmission probability to
0.08 per contact.

 Moderate increase of effective contacts of vaccines: Figure 2(A-B) simulated the
situations when the vaccines have the disease transmission effective contacts
double those of the non-vaccines. Depending on the vaccine efficacy ( ), there
is always critical value of the quarantine rate below which the control
reproduction number with vaccine is higher than that without vaccine.
However, the control reproduction numbers, both with and without vaccines,
are below the threshold 1, and the outbreak can be prevented when the
quarantine rate is higher than 0.25, a level that has been shown to be achievable.

 Significant increase of effective contacts of vaccines: When the vaccines increase
their disease transmission effective contacts to a level so that 2 / = 3 in
Figure 2(C-D)), the mass vaccination by a vaccine with low efficacy ( =0.6) will
lead the reproduction number consistently higher that that without vaccine for
any level of quarantine rate, and the control reproduction number with this
vaccine will exceed the threshold value even for a large level of quarantine rate.
A combination of lower vaccine efficacy and significant increase of effective
contacts of vaccines due to the perceived immunity through vaccine is
counterproductive for the prevention and control of the COVID-19 outbreak.
We remark that the use of mass vaccination based on high efficacy vaccines, on
the other hand, do indeed permit the increase of effective contacts of vaccines
so monitoring the efficacy of vaccine against emerging strains is critical.

 Minimal efficacy to compensate for significant increase of contacts: To illustrate
the interplay between the vaccine efficacy and increase of effective contacts of
vaccines, we simulated a situation when 2 / = 3 and the quarantine rate
q=0.5. With this high level of quarantine rate and when the effective contact rate
for non-vaccine remains to be = 0.6 , we observed that the control
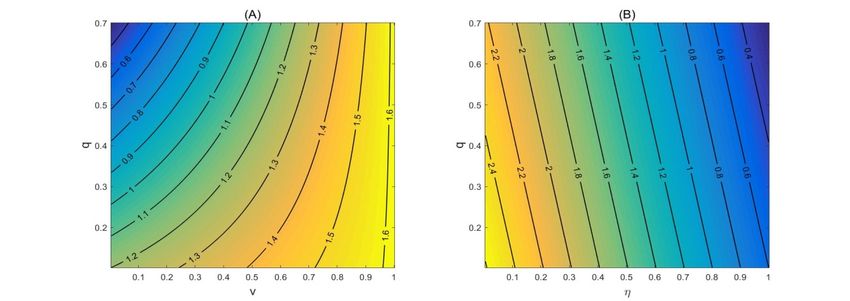
reproduction number without vaccine can be reduced to below the threshold 1.
However, with 50% of vaccine coverage and while the effective contact rate
reaches 1.8, the control reproduction number is above the threshold until the
vaccine efficacy reaches 70% (Figure 2(F)). Increasing the disease transmission
effective contacts of the vaccinated population, mass vaccination with low
efficacy vaccines will always increase the reproduction number even if the
quarantine rate for non-vaccines exposed to the infection is high.

Figure 3 gives the counter plots of the control reproduction number, for
different levels of transmission effective contacts of vaccines, as functions of the
transmission effective contacts of non-vaccines and the quarantine rate .
Comparing the results from four panels of Figure 3, we found that the control
reproduction number increases multiple folds as the transmission effective
contacts of vaccines increase. Similarly, we observed that the control
reproduction number can be higher when the vaccination coverage increases
while other parameter values remain fixed (Figure 4A); and that the vaccine
efficacy rate is critical for the value of the control reproduction number.

Figure 3. Counter plot of control reproduction number U2 with respect to transmission
rate and quarantine rate for different values of 2 . Here, the vaccination coverage is
set as = 0.5 while the efficacy rate of the vaccine is assumed to be 0.6 (i.e. = 0.6). The
other parameter values are given in Table 1.
Figure 4. Counter plots of control reproduction number U2 with respect to vaccination
coverage and quarantine rate (Panel A); and counter plot of control reproduction
number U2 with respect to vaccine efficacy and the quarantine rate (Panel B). The baseline
values are fixed as: = 0.6, 2 = 1.8, = 0.5, = 0.6 . The other parameter values are
given in Table 1.

R2. Impact of vaccination on the final epidemic size: We now focus on
quantifying the impact of COVID-19 vaccination on the number of the
accumulative infections by the end of an outbreak, i.e. the final epidemic size.
We start with the case when there is no vaccination, i.e. = 0. Then model (1)
becomes:
 9(:;
9 9
 R ( R ) ≜ B R R = B ( R + + ),

and define a new variable for the weighted sum of diseased components
 R 9 9 9 0. (4)
 Š Š

Here,
 9 0 , we
 ‘→“
conclude that (∞) exists. Assuming ( ∗ ) = / U , then ( ) < / U for all
 > ∗ . Then we observe R ’( ) < 0 for all > ∗ , hence lim R ( ) exists.
 ‘→“
Choosing a sequence ” → ∞ such that R ’( ” ) → 0 as → ∞, then we have
 ( ” ) → 0 , ( ” ) → 0 and ( ” ) → 0 as → ∞ using equation (3).
Therefore, “ = lim inf‘→“ ( ) = 0 , “ = lim inf‘→“ ( ) = 0 and “ =
lim inf‘→“ ( ) = 0. Based on these, we can choose a sequence ” → ∞ such
that ’( ” ) → 0 and ( ” ) → “ as → ∞. From the equation in (2) and
 “ = 0, we obtain ( ” ) → 0, and accordingly, “ = 0. It follows from (4)
 R“ = 0, R (∞) = 0. Taking the limit → ∞ in (4), we have:

 (∞) + R (∞) − ln (∞) = U + RU − ln U .
 U U
It follows from (∞) = U − R and R (∞) = 0 that the final epidemic size R
of system (2) is given by solving
 ‰ (˜ ;™ Š )
 Z Š ? ?
 R = U − U e B .
If we assume that the vaccination coverage is 100%, that is = 1, then model
(1) becomes
 > > 9 (: ; ? >
 ⎧ ’ = − B
 ,
 ⎪ ’ = 9> (:>;;
Then we show that the solution of system (5) satisfies the equation:
 B(RZš) B(RZš)
 ( ) + l ( ) − ‰>
 ln ( ) = U + lU − ‰>
 ln U for all > 0, (6)

with
 9> (RZš) (RZš)
 lU = 2U + 2U + ‰ 2U + 2U .
 > (]> ;^> ) ‰> ]_>

We then derive the equation for the final epidemic size of system (5) defined by
 l = U − (∞) with (∞) = lim ( ).
 ‘→“

Using the method similarly to what has been developed above, we can show
that l (∞) = lim l ( ) = 0. Correspondingly, we can take the limit → ∞ in
 ‘→“
(6) to obtain
 (1 − ) (1 − )
 (∞) + l (∞) − ln (∞) = U + lU − ln U .
 2 2
It follows from (∞) = U − l and l (∞) = 0 that the final epidemic size l
of system (5) is given by solving
 ‰ (˜ ;™ Š )
 Z > › ›
 l = U − U e B(RZš) .

Let U = U = U = 2U = 2U = 2U = 0. Then
 9 9>
 RU = ‰ , lU = ‰
 (^;]) U
 2U .
 Š > (^> ;]> )

Further, normalizing the final size by the total population, we obtain the final
disease proportions
 ˜ ˜
 R = B? , l = B› ,
 Š Š

and these are obtained by solving
 Ÿ
 Z‰Š ž? Z :Š
 R = 1 − Š(¡¢£) (7)
 ¤ ¥ Ÿ>
 Z > ›Z :Š
 l = (1 − ) f1 − (?¦§) Š (¡> ¢£> ) g (8)

If 2 = , 2 = , 2 = , 2 = =2 and = 0, we obtain U < 2 . Then, from
the above formulas, we have that R < l. This inequality remains true if is
small due to the continuity. This confirms, from the final epidemic size point of
view, that low vaccine efficacy can make the situation worse if we vaccinate
against COVID-19. On the other hand, if = 1, then the final epidemic size for
model (5) should be 0, i.e. l = 0. Therefore, R > l can happen with high
vaccine efficacy rate, so with a high vaccine efficacy, mass vaccination can
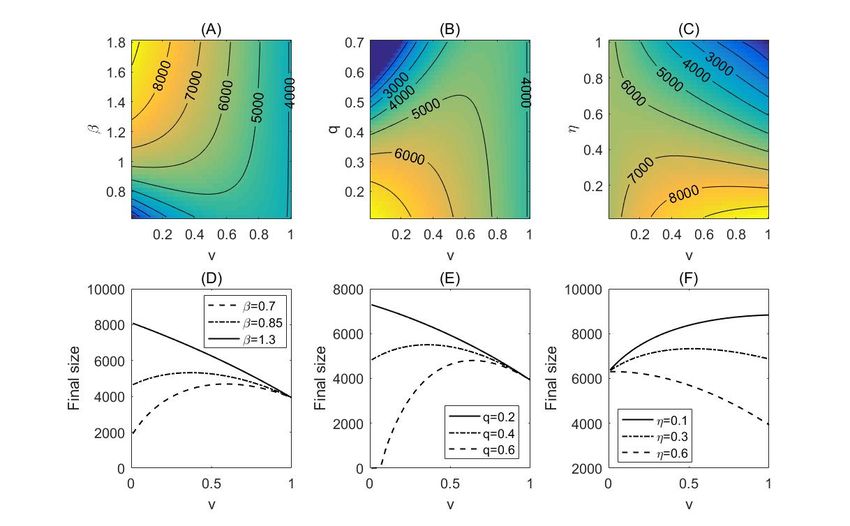
prevent an outbreak, or mitigate the outbreak (in terms of the final size) if it
does happen.

We numerically examined the impact of mass vaccination on the final epidemic
size. In our simulations, we fixed the initial total population as (0) = 10000,
and the initial population for all the classes of model (1) as:

 (0) = (1 − ) (0), (0) = 0, (0) = 0, + (0) = 0, (0) = 0.1, (0) = 0,
 (0) = (1 − ) (0), 2 (0) = 0, 2 (0) = 0, 2 (0) = 0, 2 (0) = 0, (0) = 0, (0) = 0.

In Figure 5, we demonstrate the change of the final epidemic size when we vary
the vaccination coverage, vaccine efficacy, quarantine rate and transmission
effective contact rate of the infected non-vaccines. A remarkable feature of these
plots is the non-monotonic change of the final size when these vaccine
characteristics and public health interventions vary. In more details, with a low
quarantine rate, the final epidemic size is always decreasing as the vaccination
coverage increases. However, the final size changes its monotonicity (from an
initial increase to a decrease) as the vaccination coverage increases, if the
quarantine rate is high (Figure 5(B, E)). Similar results can be obtained in terms
of the transmission effective contact rate of non-vaccines (Figures 5(A,D)). This
means that with a high level of non-compliance for non-pharmaceutical
intervention measures, vaccination against COVID-19 can increase the
outbreak final size instead of mitigating the epidemics. It also follows from
Figure 5(C, F) that if the vaccine efficacy is low, a higher vaccination coverage
can lead to a lager outbreak.
Figure 5. Counter plot of the accumulative cases for model (1) as a function of the
transmission effective contact rate and the vaccination coverage in (A); as a function of the
quarantine rate and vaccination coverage in (B); and as a function of the vaccine efficacy
rate and vaccination coverage in (C). We also plot the accumulative cases as a function of
the vaccination coverage, with different transmission efficient contacts (D); quarantine rate
(E) and vaccine efficacy. The baseline values are fixed as: = 0.3, = 1, 2 = 1.8, =
0.5, = 0.6, and the other parameter values are given in Table 1.

Discussion: In this study, we considered the scenario that mass vaccination can
potentially lead to an increase of transmission effective contact rate of vaccines
and a decrease of their compliance to quarantine/isolation regulation when the
vaccine fails to prevent them from acquiring the infection and when they do
not present symptoms.

To understand the impact of this non-compliance of vaccines to public health
interventions due to the perceived vaccine-provided immunity, we designed a
mathematical model to investigate when vaccination in the population is
beneficial to controlling of the COVID-19 spread. We addressed this issue,
using both the control reproduction number and the final size of epidemic
(attack rate).

Our analyses and simulations predict that vaccination in the population affects
the control reproduction numbers. Mass vaccination is undesirable if U2 > U
since the protection offered by the vaccine in the population is offset by the
relaxation of social distancing, personal protection and participation in
quarantine and isolation if exposed to the infection. Vaccination in the
population should also be avoided by all means if U2 > 1 > U since in this
case, the use of vaccine with low efficacy in conjunction with relaxation of the
non-pharmaceutical interventions will lead to an outbreak that can otherwise
be prevented through enhanced non-pharmaceutical interventions. We
identified two threshold parameters: the critical quarantine proportion ∗
(when vaccine efficacy and coverage are fixed) which indicates that a public
health contact tracing/quarantine/isolation package with the quarantine
proportion higher than ∗ (if feasible) is more effective than the mass
vaccination program; and the minimal vaccine efficacy rate ∗ (when the
quarantine proportion and vaccine coverage are fixed) which indicates that an
immunization program with a vaccine efficacy rate below the critical vale ∗
will not be as efficient as simply investing on the contact tracing, quarantine,
and isolation implementation. This conclusion holds under the assumption that
vaccines, in comparison with non-vaccines, will have more transmission
effective contacts, less personal protection, low compliance to quarantine
and/or isolation when individuals are effectively exposed to infection (vaccine
failure) and do not display COVID-19 symptoms (pre-symptomatic or
asymptomatic infection).

We also numerically and theoretically proved that with a high level of non-
pharmaceutical interventions, including the close contact tracing and
quarantine, self-isolation and social distancing, vaccination against COVID-19
may boost the outbreak with a bigger final size instead of mitigating the
epidemics. Therefore, the minimal efficacy of the vaccine is necessary to
compensate for potential increase of transmission contact. This highlights the
importance of rapidly evaluating the vaccine efficacy against emerging strains.

It is also important to consider emerging mutant strains and their impact on
the transmissibility18, 19. For illustration, we present here a simulation result that
is based on the vaccination rate = 0.5 or = 0.7 , and incorporates the
increased effective contacts due to a higher transmissibility of the mutant strain
(1.5 times of that of the original strain) or the efficacy of the vaccine. We
started with the case where the transmission effective contacts of the mutant
strain is 1.5 times of the baseline contacts, i.e., = 0.9, and the contacts of
vaccines are double (Figure 6(A-B)) or triple (Figure 6(C-D)) of those for non-
vaccines. Compared with Figure 2(A-B), we found that if the vaccine efficacy is
low ( = 0.6), the control reproduction number is an increasing function of the
vaccination coverage. In comparison with the case when 50% vaccination
coverage is reached, it is still possible to reduce the control reproduction
number to below the threshold with a high quarantine rate 0.8, we noted that a
vaccine coverage of 70% will result in the situation that the control
reproduction number is always above the threshold regardless of the
quarantine effort. Therefore, with a mutant strain leading to increase of the
transmissibility by 50%, and with a vaccine of low efficacy, the higher
vaccination coverage, the higher chance an outbreak will occur.

The situation changes significantly when the vaccine efficacy rate is higher.
Indeed, with the efficacy reaching 90%, the control reproduction number will
be below the threshold without quarantine (70% coverage) or with very low
quarantine rate (0.2), see Figure 6(B). This is also the case, with 2 / = 3 , as
shown in Figure 6(C-D).

Figure 6. Control reproduction numbers as functions of the quarantine rate , and the
critical vaccine efficacy to compensate for the increased transmission effective contacts
resulted from the high transmission ability of the mutant strain. The other parameters are
fixed as those in Table 1.

We further considered that the situation when the effective contacts become
higher, = 2.1 and 2 / = 2 for the mutant strain, as shown in Figure 6(E-
F). In this situation, we observed that the quarantine rate and the vaccine
efficacy must be significantly high to ensure the control reproduction number
below the threshold to avoid an outbreak of COVID-19.

We conclude that a mass vaccination can be successful only when its efficacy is
sufficient high. The use of mass vaccination based on a vaccine with relatively
low efficacy can be counterproductive if the transmission of effective contacts
of vaccines increases. The increase of transmissibility due to mutant strains
enforces the need of high efficacy of vaccine and calls for persistence of limiting
contacts, continuing personal protection, and contact tracing, quarantine and
isolation.

Acknowledgement: This project was supported by the Canadian Institute of
Health Research (CIHR) 2019 Novel Coronavirus (COVID-19) rapid research
program.

Competing interests: The authors declare no competing interests.

References

1. C Huang, Y Wang, X Li, et al. Clinical features of patients infected with 2019 novel
 coronavirus in Wuhan, China, Lancet, 395 (2020), 497-506.
2. WHO Coronavirus Disease (COVID-19) Dashboard,
 https://covid19.who.int/table.
3. FE Andre, R Booy, HL Bock, et al. Vaccination greatly reduces disease, disability,
 death and inequity worldwide. Bull World Health Organ, 86 (2008), 140-146.
4. S Ozawa, A Mirelman, ML Stack, DG Walker, OS Levine Cost-effectiveness and
 economic benefits of vaccines in low- and middle-income countries: a systematic
 review. Vaccine, 31 (2012), 96-108.
5. Kaja Abbas, et al., Routine childhood immunisation during the COVID-19
 pandemic in Africa: a benefit–risk analysis of health benefits versus excess risk of
 SARS-CoV-2 infection, Lancet Global Health, 8(10), e1264-e1272 (2020).
6. M Shen, J Zu, CK Fairley, et al., Projected COVID-19 epidemic in the United States
 in the context of the effectiveness of a potential vaccine and implications for social
 distancing and face mask use, medRxiv, 2020,
 doi: https://doi.org/10.1101/2020.10.28.20221234.
7. Kate M Bubar, et al., Model-informed COVID-19 vaccine prioritization strategies
 by age and serostatus, medRxiv, 2020,
 doi: https://doi.org/10.1101/2020.09.08.20190629.
8. M Piraveenan, et al., Optimal governance and implementation of vaccination
 programs to contain the COVID-19 pandemic, 2020, arXiv: 2011.06455.
9. JH Buckner, G Chowell, MR Springborn, Optimal dynamic prioritization of scarce
 COVID-19 vaccines, medRxiv, 2020,
 doi: https://doi.org/10.1101/2020.08.23.20179820
10. Wongyeong Choi, Eunha Shim, Optimal strategies for vaccination and social
 distancing in a game-theoretic epidemiologic model, Journal of Theoretical Biology,
505, 110422 (2020).
11. S Moore, EM Hill, L Dyson, M Tildesley, MJ Keeling, Modelling optimal
 vaccination strategy for SARS-CoV-2 in the UK. medRxiv, 2020,
 doi: https://doi.org/10.1101/2020.09.22.20194183.
12. Asgary, A. et al, A drive-through simulation tool for mass vaccination during
 COVID-19 pandemic, Healthcare, 2020, 8(4), 469.
13. Tang, B. et al. De-escalation by reversing the escalation with a stronger synergistic
 package of contact tracing, quarantine, isolation and personal protection:
 Feasibility of preventing a covid-19 rebound in Ontario, Canada, as a case study.
 Biology 9, (2020).
14. Tang, B. et al. Estimation of the transmission risk of the 2019-nCoV and its
 implication for public health interventions. Journal of clinical medicine 9, 462
 (2020).
15. Tang, B. et al., The effectiveness of quarantine and isolation determine the trend
 of the COVID-19 epidemics in the final phase of the current outbreak in China,
 International Journal of Infectious Diseases, 95, 288-293 (2020).
16. van den Driessche, P. Reproduction numbers of infectious disease models.
 Infectious Disease Modelling, 2 288–303 (2017).
17. Hao, X. et al, Reconstruction of the full transmission dynamics of COVID-19 in
 Wuhan, Nature, 584, 420–424 (2020).
18. Davies, N. et al, Estimated transmissibility and severity of novel SARS-CoV-2
 variant of concern 202012/01 in England, preprint, 2020.
19. Volz, E. et al. Transmission of SARS-CoV-2 lineage B.1.1.7 in England: Insights
 from linking epidemiological and genetic data, preprint, 2020.
You can also read