A Vaccination Strategy for Ontario COVID-19 Hotspots and Essential Workers
←
→
Page content transcription
If your browser does not render page correctly, please read the page content below

SCIENCE BRIEFS

                                                      A Vaccination Strategy for Ontario
                                                      COVID-19 Hotspots and Essential Workers
                                                      Sharmistha Mishra, Nathan M. Stall, Huiting Ma, Ayodele Odutayo, Jeffrey C. Kwong,
                                                      Upton Allen, Kevin A. Brown, Isaac I. Bogoch, Aysegul Erman, Tai Huynh, Sophia
                                                      Ikura, Antonina Maltsev, Allison McGeer, Gary Moloney, Andrew M. Morris, Michael
                                                      Schull, Arjumand Siddiqi, Janet Smylie, Tania Watts, Kristy Yiu, Beate Sander, Peter
                                                      Jüni on behalf of the Ontario COVID-19 Science Advisory Table

Version 1.0
                                                      Key Message
Published: April 23, 2021
Updated on April 26, 2021.
                                                      Ontario’s initial mass COVID-19 vaccination strategy in place until April 8, 2021 was
                                                      based on per-capita regional allocation of vaccines with subsequent distribution – in
Citation: Mishra S, Stall NM, Ma H, et al. A
vaccination strategy for Ontario COVID-19             order of relative priority – by age, chronic health conditions and high-risk
hotspots and essential workers. Science               congregate care settings, COVID-19 hotspots, and essential worker status.
Briefs of the Ontario COVID-19 Science
Advisory    Table.    2021;2(26).   https://          Early analysis of Ontario’s COVID-19 vaccine rollout reveals inequities in vaccine
doi.org/10.47326/ocsat.2021.02.26.1.0                 coverage across the province, with residents of higher risk neighbourhoods being
Author Affiliations: The affiliations of the          least likely to get vaccinated.
members of the Ontario COVID-19 Science
Advisory Table can be found at https://               Accelerating the vaccination of COVID-19 hotspots and essential workers will
covid19-sciencetable.ca/.
                                                      prevent considerably more SARS-CoV-2 infections and COVID-19 hospitalizations,
Declarations of Interest: The declarations of         ICU admissions and deaths as compared with Ontario’s initial mass vaccination
interest of the members of the Ontario
COVID-19 Science Advisory Table can be                strategy (Figure 1).
found at https://covid19-sciencetable.ca/. The
declarations of interest of external authors can
be found under additional resources at https://
doi.org/10.47326/ocsat.2021.02.26.1.0.
About Us: The Ontario COVID-19 Science
Advisory Table is a group of scientific experts
and health system leaders who evaluate and
report on emerging evidence relevant to the
COVID-19 pandemic, to inform Ontario’s
response. Our mandate is to provide weekly
summaries of relevant scientific evidence for
the COVID-19 Health Coordination Table of
the Province of Ontario, integrating
information from existing scientific tables,
Ontario’s universities and agencies, and the
best global evidence. The Science Table
summarizes its findings for the Health
Coordination Table and the public in Science
Briefs.
Correspondence to: Secretariat of the
Ontario COVID-19 Science Advisory Table
(info@covid19-sciencetable.ca)
Copyright: 2021 Ontario COVID-19 Science
Advisory Table. This is an open access                Figure 1. Percentage of COVID-19 Hospitalizations, ICU Admissions and Deaths Prevented by Vaccinating 3 Million
document distributed under the terms of the           Ontarians Comparing the Initial Vaccination Strategy with a Strategy Accelerating the Vaccination of Residents
Creative Commons Attribution License,                 and Essential Workers in Hotspots
which permits unrestricted use, distribution,         Bar chart showing the percentage of COVID-19 hospitalizations, ICU admissions and deaths that could be prevented
and reproduction in any medium, provided              by vaccinating 3 million Ontarians according to the initial mass vaccination strategy, which was in place until April 8,
that the original work is properly cited.             2021, and by accelerating vaccination of residents and essential workers in hotspots. We projected the cumulative
                                                      number of COVID-19 hospitalizations, ICU admissions and deaths prevented at 60 days after the start of a 30-day
The views and findings expressed in this              vaccination period with the two strategies relative to a scenario of no further vaccination from April 9, 2021,
Science Brief are those of the authors and do         onwards. The difference between strategies is expressed as an absolute difference in percentage of prevented event.
not necessarily reflect the views of all of the
members of the Ontario COVID-19 Science

Science Briefs | https://covid19-sciencetable.ca/science-briefs                                                                                              April 23, 2021 | 1
Ontario COVID-19 Science Advisory Table                                                A Vaccination Strategy for Ontario COVID-19 Hotspots and Essential Workers
Advisory Table, its Working Groups, and its
partners.                                             Summary
                                                      Background
                                                      Ontario’s initial mass COVID-19 vaccination strategy in place until April 8, 2021 was
                                                      based on per-capita regional allocation of vaccines with subsequent distribution – in
                                                      order of relative priority – by age, chronic health conditions and high-risk
                                                      congregate care settings, COVID-19 hotspots, and essential workers in non-
                                                      healthcare settings. As of April 5, 2021, 15% of Ontarians had received at least one
                                                      dose of a COVID-19 vaccine.
                                                      Recent evidence indicates that COVID-19 vaccines not only protect directly against
                                                      symptomatic COVID-19, but also against asymptomatic SARS-CoV-2 infection and
                                                      against transmission to others. The indirect impact (benefits accrued even by those
                                                      who are not yet vaccinated) can be captured by transmission models to estimate the
                                                      direct and indirect impact of vaccination strategies.

                                                      Questions
                                                      How has COVID-19 vaccination coverage varied between neighbourhoods with
                                                      different COVID-19 risks?
                                                      How have per-capita rates of SARS-CoV-2 cases differed between neighbourhoods
                                                      with high and low proportions of essential workers in non-healthcare settings?
                                                      Could accelerating the vaccination of essential workers, their families and other
                                                      residents living in COVID-19 hotspots prevent more SARS-CoV-2 infections and
                                                      COVID-19 hospitalizations, ICU admissions and deaths as compared with Ontario’s
                                                      initial mass vaccination strategy?

                                                      Findings
                                                      By April 5, 2021, residents of neighbourhoods with the lowest risk of SARS-CoV-2
                                                      infections were 1.5 times more likely to have received at least one COVID-19 vaccine
                                                      dose, as compared to residents of neighbourhoods with the highest risk of SARS-CoV-2
                                                      infections.
                                                      In Toronto, neighbourhoods with the highest proportion of essential workers in non-
                                                      healthcare settings continue to experience a 3-fold higher incidence of SARS-CoV-2
                                                      infections as compared to neighbourhoods with fewer essential workers.
                                                      Accelerating the vaccination of essential workers, their families and other residents
                                                      living in COVID-19 hotspots is projected to prevent considerably more infections in
                                                      those aged 16 to 59 years. Even though the hotspot-accelerated strategy results in
                                                      slower vaccination of individuals aged 60 years and above in non-hotspots, it
                                                      prevents more infections also in this age group as a result of faster vaccination in
                                                      hotspots (direct impact), and prevention of infections passed from younger to older
                                                      adults (indirect impact). A hotspot-accelerated vaccination strategy is also projected
                                                      to prevent a larger number of COVID-19 hospitalizations, ICU admissions and deaths
                                                      than Ontario’s initial vaccination strategy.

                                                      Interpretation
                                                      Early analysis of Ontario’s COVID-19 vaccine rollout reveals inequities in vaccine
                                                      coverage across the province, with residents of neighbourhoods with higher COVID-
                                                      19 risk being least likely to get vaccinated. At the same time, COVID-19 continues to
                                                      disproportionately impact neighbourhoods with the highest proportion of essential
                                                      workers.

Science Briefs | https://covid19-sciencetable.ca/science-briefs                                                                                 April 23, 2021 | 2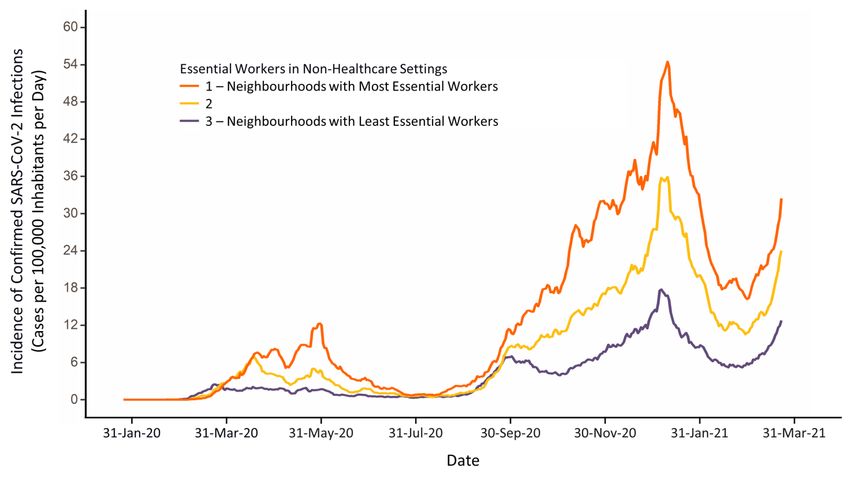
Ontario COVID-19 Science Advisory Table                                                  A Vaccination Strategy for Ontario COVID-19 Hotspots and Essential Workers

                                                      Accelerating the vaccination of residents and essential workers in COVID-19 hotspots
                                                      will substantially reduce the overall incidence of SARS-CoV-2 infections, COVID-19
                                                      hospitalizations, ICU admissions and deaths among both younger and older Ontarians.

                                                      Background
                                                      In Ontario, half of all SARS-CoV-2 infections are in 20% of neighbourhoods.1 These
                                                      neighbourhoods are referred to as COVID-19 hotspots. COVID-19 hotspots have the
                                                      highest incidence of infections, they are also the neighborhoods with the highest
                                                      proportion of essential workers who are unable to work from home and must travel
                                                      to their place of employment.2 Risk factors for heightened acquisition and
                                                      transmission in these neighborhoods include lower-income, multigenerational
                                                      households, high density housing, precarious working conditions, a lack of paid sick
                                                      leave, and difficulty in access to or uptake of interventions such as isolation,
                                                      quarantine and testing.3–5
                                                      Ontario’s initial mass COVID-19 vaccination strategy in place until April 8, 2021 was
                                                      based on per capita regional allocation of vaccines with subsequent distribution – in
                                                      order of relative priority – by age, chronic health conditions and high-risk
                                                      congregate care settings, COVID-19 hotspots, and essential workers in non-
                                                      healthcare settings.
                                                      As of April 5, 2021, 15% of Ontarians have received at least one dose of a COVID-19
                                                      vaccine. Residents of COVID-19 hotspots and essential workers experience barriers
                                                      to accessing COVID-19 vaccination. Essential workers cannot work from home, and
                                                      are employed in the trades, transport, equipment, manufacturing, utilities, sales,
                                                      services, agricultural, and health care sectors.6
                                                      Recent evidence indicates that COVID-19 vaccines not only protect against symptomatic
                                                      COVID-19,7,8 but also against asymptomatic SARS-CoV-2 infection and thus,
                                                      transmission.9–11 Accelerated vaccination of a large proportion of residents and essential
                                                      workers in COVID-19 hotspots has the potential to not only result in direct benefits for
                                                      vaccinated individuals (prevention of symptomatic disease), but also in indirect benefits
                                                      for unvaccinated individuals (prevention of transmission from vaccinated to
                                                      unvaccinated individuals). These indirect benefits can now be incorporated into models
                                                      to estimate the impact of different vaccination strategies. As an example, transmission
                                                      modeling from British Columbia and Spain suggests considerable population-level
                                                      benefit for all age-groups of vaccinating those who may be most at risk of acquisition
                                                      and transmission of SARS-CoV-2, such as essential workers.12,13

                                                      Questions
                                                      How has COVID-19 vaccination coverage varied between neighbourhoods with
                                                      different COVID-19 risks?
                                                      How have per-capita rates of SARS-CoV-2 cases differed between neighbourhoods
                                                      with high and low proportions of essential workers in non-healthcare settings?
                                                      Could accelerating the vaccination of essential workers, their families and other
                                                      residents living in COVID-19 hotspots prevent more SARS-CoV-2 infections and
                                                      COVID-19 hospitalizations, ICU admissions and deaths as compared with Ontario’s
                                                      initial mass vaccination strategy?

                                                      Findings
                                                      Across Ontario, neighbourhoods with the highest risk of SARS-CoV-2 infection had the
                                                      lowest rates of COVID-19 vaccination. Figure 2 presents the COVID-19 vaccination

Science Briefs | https://covid19-sciencetable.ca/science-briefs                                                                                   April 23, 2021 | 3
Ontario COVID-19 Science Advisory Table                                                             A Vaccination Strategy for Ontario COVID-19 Hotspots and Essential Workers

                                                      coverage of Ontarians aged 16 years and above by neighborhood COVID-19 risk.
                                                      Residents of neighbourhoods with the lowest risk of SARS-CoV-2 infections (COVID-19
                                                      neighbourhood risk group 10) were 1.5 times more likely to have received at least one
                                                      COVID-19 vaccine dose by April 5, 2021, as compared to residents of neighbourhoods
                                                      with the highest risk of SARS-CoV-2 infections (COVID-19 neighbourhood risk group 1,
                                                      Figure 2A).1 However, the average incidence of SARS-CoV-2 infections between March
                                                      7 and April 3, 2021 was 9 times lower in neighbourhoods with the lowest risk of SARS-
                                                      CoV-2 infections (Figure 2B).

                                                      Figure 2. COVID-19 Vaccine Coverage and Incidence of Confirmed SARS-CoV-2 Infections in Ontario as of early April 2021
                                                      Panel A presents COVID-19 vaccine coverage in Ontario for inhabitants aged 16 years and older, as of April 5, 2021,
                                                      by neighbourhood COVID-19 risk group. Panel B presents the average incidence of confirmed SARS-CoV-2 infections
                                                      per 100,000 inhabitants in Ontario per day, from March 7 to April 3, 2021, by neighbourhood COVID-19 risk group.
                                                      Neighbourhood risk groups are determined by ranking Ontario’s 509 neighbourhoods in 10% increments according
                                                      to the cumulative incidence of SARS-CoV-2 infections between Jan 23, 2020 and Jan 16, 2021.1 Each risk group
                                                      represents 10% of the Ontario population (~1.5 million inhabitants). Group 1 includes neighbourhoods with the
                                                      highest cumulative incidence of SARS-CoV-2 infection, whereas group 10 includes neighbourhoods with the lowest
                                                      cumulative incidence of SARS-CoV-2 infection. Data sourced from the Public Health Case and Contact Management
                                                      Solution and other case management systems (CCM plus) and the ICES COVID-19 Dashboard.14

                                                      Figure 3 presents the incidence of new SARS-CoV-2 infections based on the
                                                      proportion of essential workers in non-healthcare settings living in Toronto’s
                                                      neighbourhoods, separated into thirds based on the proportion of essential workers
                                                      in non-healthcare settings.2 Neighbourhoods with the highest proportion of
                                                      essential workers in non-healthcare settings continued to experience a 3-fold higher
                                                      incidence of SARS-CoV-2 infections as compared to Toronto neighbourhoods with
                                                      the lowest proportion of essential workers. These neighbourhoods also have the
                                                      highest proportion of multi-generational households.

                                                      Figure 3. Daily Incidence of Confirmed SARS-CoV-2 Infections by Proportion of Essential Workers in Non-
                                                      Healthcare Settings Living in Toronto’s Neighbourhoods, January 20, 2020 to March 23, 2021

Science Briefs | https://covid19-sciencetable.ca/science-briefs                                                                                              April 23, 2021 | 4
Ontario COVID-19 Science Advisory Table                                                             A Vaccination Strategy for Ontario COVID-19 Hotspots and Essential Workers

                                                      Line graph presenting the 7-day moving average of confirmed SARS-CoV-2 infections per 100,000 inhabitants in the
                                                      City of Toronto from January 20, 2020 to March 23, 2021 excluding long-term care (LTC) home residents.
                                                      Neighbourhoods are separated into thirds, based on the proportion of essential workers in non-healthcare settings
                                                      living in the neighbourhoods. The top third represents the 33% of neighbourhoods (by overall population size) with
                                                      the highest proportion of essential non-healthcare workers; the bottom third represents the 33% of neighbourhoods
                                                      (by overall population size) with the lowest proportion of essential non-healthcare workers. Neighbourhoods are
                                                      defined by dissemination areas of 400 to 700 residents.4,15 Data sourced from Case and Contact Management
                                                      Solutions (CCM)+ and the Statistics Canada 2016 Census.

                                                      Figure 4 compares the projected impact of two vaccination scenarios: Ontario’s
                                                      initial COVID-19 vaccination strategy versus a strategy that accelerates the
                                                      vaccination of essential workers, their families and other residents living in COVID-
                                                      19 hotspots. In both scenarios, 3 million doses of COVID-19 vaccine are administered
                                                      over 30 days (100,000 doses per day starting on April 9, 2021), and the number of
                                                      new SARS-CoV-2 infections over 60 days (April 9 to June 7, 2021) is determined.

                                                      Figure 4. Percentage of SARS-CoV-2 Infections Prevented by Vaccinating 3 Million Ontarians Comparing the Initial
                                                      Vaccination Strategy with a Strategy Accelerating the Vaccination of Residents and Essential Workers in Hotspots
                                                      Bar chart showing the percentage of SARS-CoV-2 infections prevented by vaccinating 3 million Ontarians according
                                                      to the initial vaccination strategy16,17 and according to a strategy accelerating the vaccination of essential workers,
                                                      their families and other residents living in COVID-19 hotspots. We projected the number of SARS-CoV-2 infections
                                                      prevented with the two vaccination strategies relative to a scenario of no further vaccination from April 9, 2021,
                                                      onwards. The difference between strategies is expressed as an absolute difference in percentage of prevented event.

                                                      Ontario’s initial mass COVID-19 vaccination strategy emphasized age-based
                                                      prioritization, with vaccines distributed equally across the ten COVID-19
                                                      neighbourhood risk groups, consistent with the province’s per capita allocation of
                                                      vaccines.18 For the initial strategy, we assumed that 80% of the population aged 60
                                                      years and above would be vaccinated by April 28, 2021, at which point the strategy
                                                      would proceed to vaccinating individuals aged 16 to 59 years of age. In the initial
                                                      strategy,16,17 an additional 900,000 doses were allocated to COVID-19 hotspots. We
                                                      assumed that these allocated doses would be distributed at a rate of 450,000 doses
                                                      per month, and would be administered to produce equal coverage across the
                                                      neighbourhood risk groups, mitigating the previously observed disparities in vaccine
                                                      coverage across the groups (see Figure 2).
                                                      In the hotspot-accelerated vaccination strategy, we assumed that 50% of COVID-19
                                                      vaccines (50,000 per day) would be distributed to the 74 COVID-19 hotspots in
                                                      neighbourhood risk groups 1 and 2 (the 20% of neighbourhoods with the highest
                                                      cumulative incidence of SARS-CoV-2).1 We further assumed that these vaccines
                                                      would be distributed to individuals aged 16 years and above with no age-based

Science Briefs | https://covid19-sciencetable.ca/science-briefs                                                                                              April 23, 2021 | 5
Ontario COVID-19 Science Advisory Table A Vaccination Strategy for Ontario COVID-19 Hotspots and Essential Workers
prioritization in these hotspots. For the remaining 50% of COVID-19 vaccines we
assumed equal distribution across all ten COVID-19 neighbourhood risk groups, and
that these vaccines would be used to vaccinate individuals aged 60 years and above
in all neighbourhoods, including hotspots, with an age-based prioritization
approach. With this strategy, the vaccination of the 74 hotspots would be
completed within 25 days, assuming vaccine coverage of 80% in those aged 60 years
and above, and 70% in those aged 16 to 59 years. All vaccine doses available after 25
days would then be distributed equally across the remaining neighbourhoods.
Figure 4 indicates that compared to Ontario’s initial COVID-19 vaccination strategy,
a strategy that accelerates vaccination of residents and essential workers in COVID-
19 hotspots would prevent a larger number of SARS-CoV-2 infections between April
9 and June 7, 2021. The hotspot-accelerated vaccination strategy is also projected to
prevent a larger number of infections in individuals aged 16 to 59 years and among
individuals aged 60 years and above even though the strategy results in slower
vaccination of individuals aged 60 years and above.
Continue Ontario’s initial
No vaccination beyond Hotspot-accelerated
COVID-19 vaccination
April 8, 2021 vaccination strategy
strategy
SARS-CoV-2 infections 313,124 231,531 174,738
COVID-19 hospitalizations 12,352 8,003 6,272
COVID-19 ICU admissions 1,833 1,191 933
COVID-19 deaths 4,740 2,745 2,228
Table 1. Cumulative Projected SARS-CoV-2 Cases, COVID-19 Hospitalizations, ICU Admissions and Deaths in Ontario
Cumulative projected SARS-CoV-2 cases, COVID-19 hospitalizations, ICU admissions and deaths in Ontario from April
9 to June 7, 2021, under three scenarios: 1) no additional vaccination beyond April 8, 2021, 2) continue Ontario’s
initial COVID-19 vaccination strategy, and 3) a hotspot-accelerated strategy that accelerates the vaccination of
essential workers in non-healthcare settings, their families and other residents living in COVID-19 hotspots.
Figure 1 and Table 1 present the projected impact of the two vaccination strategies
compared with no vaccinations beyond April 8, 2021. Projected outcomes include
the number of COVID-19 hospitalizations, ICU admissions, and deaths in Ontario
between April 9 and June 7, 2021. Compared with the initial strategy, the hotspot-
accelerated vaccination strategy is projected to prevent an additional 14% of COVID-
19 hospitalizations, 14% of COVID-19 ICU admissions and 11% of COVID-19 deaths in
Ontario’s population aged 16 years and older. With 3 million doses available over 30
days, the number of vaccinations needed to prevent 1 confirmed SARS-CoV-2
infection is 37 with the initial strategy and 22 with the hotspot-accelerated strategy.
Interpretation
Early analysis of Ontario’s COVID-19 vaccine rollout reveals inequities in vaccine
coverage across the province. The impact of COVID-19 is highest in Ontario
neighbourhoods with the largest proportion of essential workers.3 As of April 5,
2021, residents of neighbourhoods with the highest risk of SARS-CoV-2 infection had
the lowest rates of COVID-19 vaccination.
Recent evidence indicates that COVID-19 vaccines not only protect against
symptomatic COVID-19,7,8 but also against asymptomatic SARS-CoV-2 infection and
transmission.9–11 These indirect benefits were incorporated into models that compare
vaccination strategies that leverage both the direct and indirect benefits of vaccination.
Accelerating the vaccination of essential workers, their families and other residents
living in COVID-19 hotspots by immediately reallocating 50% of the next 3 million
vaccines to the 20% of neighbourhoods with the highest cumulative incidence of
SARS-CoV-2, and vaccinating all residents aged 16 years and above in these
Science Briefs | https://covid19-sciencetable.ca/science-briefs April 23, 2021 | 6Ontario COVID-19 Science Advisory Table A Vaccination Strategy for Ontario COVID-19 Hotspots and Essential Workers
neighbourhoods could substantially reduce the overall incidence of SARS-CoV-2
infections, COVID-19 hospitalizations, ICU admissions and deaths in both younger
and older Ontarians. This is because the hotspot-accelerated vaccination strategy
not only affords more direct protection to Ontario’s younger residents and essential
workers in COVID-19 hotspots, but it also affords substantially more indirect
protection to older adults in these hotspots.12 Essential workers experience a
disproportionately high burden of SARS-CoV-2 infection, especially in the absence of
paid sick leave and enhanced supports for workplace safety.2 Older adults, especially
those living in multigenerational households, will benefit from fewer infections
among younger adults, many of whom are essential workers.
On April 13, 2021, Ontario communicated an updated COVID-19 mass vaccination
strategy to accelerate the vaccination of COVID-19 hotspots. The updated strategy
involves vaccinating adults aged 18 years and older in the highest risk hotspots
identified in Toronto and Peel, and later vaccinating the remainder of 114 defined
hotspots across the province.19 Of note, the province defined hotspots
predominantly based on the top three COVID-19 neighbourhood risk groups
identified in the Science Brief entitled A Strategy for the Mass Distribution of COVID-
19 Vaccines in Ontario Based on Age and Neighbourhood,1 with neighbourhoods
ranked in the top 30% of cumulative SARS-CoV-2 incidence. In addition, they
based the selection of hotspots on outbreak data and a list of neighbourhoods with
low testing rates and sociodemographic barriers that may result in lower vaccine
uptake.20,21 Ontario’s updated vaccination strategy would distribute 25% of vaccines
to the identified 114 hotspots and the remaining 75% would be equally distributed
across the province (including hotspots).22 This means that 47.5% of Ontario’s COVID
-19 vaccine supply would be allocated to the 30% of Ontario’s population living in
114 hotspots identified by the province.
The hotspot-accelerated vaccination strategy suggested in this Science Brief would
allocate 50% of COVID-19 vaccines to the 74 COVID-19 hotspots ranked in the top
20% of cumulative SARS-CoV-2 incidence among all Ontario neighbourhoods, and
the remaining 50% of vaccines would be equally distributed across the province
(including hotspots).1 This means that 60% of Ontario’s COVID-19 vaccine supply
would be allocated to the 20% of Ontario’s population living in the hotspots
identified by the Ontario COVID-19 Science Advisory Table.1 Additional benefits
would be realized by further prioritizing warehouses, factories and other facilities
with large numbers of COVID-19 outbreaks.
There are important caveats to the results of our analyses. The highest COVID-19
risk neighbourhoods were modeled separately from remaining neighbourhoods. As
such, our estimates underestimate the potential benefit of the hotspot-accelerated
strategy on the overall population: we do not explicitly capture the indirect benefits
of the prevention of infection spillover from hotspots into low-risk neighbourhoods.
Our model also does not explicitly stratify the adult population into individuals who
are essential workers and those who are not. However, the model accounts for
higher rates of workplace-related contacts since COVID-19 hotspots have a higher
proportion of essential workers.
Realizing the potential impact of the hotspot-accelerated vaccination strategy will
require meaningful community engagement, investment in, and support for, the
implementation and logistics of community-level vaccine distribution. Examples of
community-level distribution include implementation through trusted and
established community programs, health-care providers (especially primary care
physicians, nurse practitioners, and community health centers), and employer-based
programs for essential workers.
Science Briefs | https://covid19-sciencetable.ca/science-briefs April 23, 2021 | 7Ontario COVID-19 Science Advisory Table A Vaccination Strategy for Ontario COVID-19 Hotspots and Essential Workers
Methods Used for This Science Brief
We developed an age-stratified mathematical model of SARS-CoV-2 transmission,
using a modified SEIR system of compartments (susceptible, exposed, infectious,
and recovered) with COVID-19 vaccination. The model simulated contacts within
and between two age-groups (age 16-59 years of age; and 60 years of age and
above) and separately modelled high SARS-CoV-2 incidence neighbourhoods or
“COVID-19 hotspots” (20% of the Ontario population over age 16) and lower-
incidence neighbourhoods (80% of the Ontario population over age 16).
The model used Ontario demographic and surveillance data on the hotspots (two
highest SARS-CoV-2 incidence neighbourhood groups as per Brown et al.1) and the
remaining forward sortation areas (FSAs, eight lowest SARS-CoV-2 incidence
neighbourhood groups as per Brown et al.1), to reflect the following summary
measures: estimated reproductive rates and relative rates of cumulative and weekly
SARS-CoV-2 infections (in March 2021) between COVID-19 hotspots and lower-
incidence FSAs; cumulative proportion of total provincial cases among over age 16
years that are in the hotspots (50-55%); relative rates of cumulative and weekly
diagnoses (in March 2021) between age-groups within and between hotspots and
lower-incidence FSAs.1
Inputs on contact rates and patterns by age-group were based on the CONNECT
study but calibrated to the effective reproduction number in the hotspots and lower
SARS-CoV-2 incidence neighbourhoods.23 As such, rates of contacts were higher in
the COVID-19 hotspots stemming from a larger proportion of the population who
are not able to work remotely (essential workers).
Vaccination was assumed to reduce acquisition of infection with an efficacy of 60%
after one dose.9–11 The model captured direct and indirect benefits of vaccinations
within the hotspots, and within the lower SARS-CoV-2 incidence FSAs. The model
included the current proportion of the age-stratified population in COVID-19
hotspots and lower SARS-CoV-2 incidence neighbourhoods estimated as immune
following infection (“recovered”), current proportion infectious (active SARS-CoV-2
cases diagnosed and undiagnosed), and current proportion who have received at
least one dose of a COVID-19 vaccine as of April 5, 2021 based on the ICES
Dashboard.14 With this approach the model will underestimate the impact of COVID-
19 vaccination in one region (COVID-19 hotspots) on lower-SARS-CoV-2 incidence
neighbourhoods, and vice-versa; as the previous model assumes independence of
COVID-19 hotspots and lower SARS-CoV-2 incidence neighbourhoods. Vaccination
was assumed to reduce acquisition of infection with an efficacy of 60%.9–11 The
model captured direct and indirect benefits of vaccinations within the hotspots, and
within the lower-incidence FSAs. The model included the current proportion of the
age-stratified population in COVID-19 hotspots and lower SARS-CoV-2 incidence
neighbourhoods estimated as immune following infection (“recovered”), current
proportion infectious (active SARS-CoV-2 cases diagnosed and undiagnosed), and
current proportion who have received at least one dose of a COVID-19 vaccine as of
April 5, 2021 based on the ICES Dashboard.14 With this approach the model will
underestimate the impact of COVID-19 vaccination in one region (COVID-19
hotspots) on lower-SARS-CoV-2 incidence neighbourhoods, and vice-versa; as the
previous model assumes independence of COVID-19 hotspots and lower SARS-CoV-2
incidence neighbourhoods.
The model was then used to simulate counterfactual scenarios wherein the base-
case (no further COVID-19 vaccination beyond April 8, 2021) was compared with a
fixed amount of daily vaccinations (100,000 per day) distributed using the initial
Science Briefs | https://covid19-sciencetable.ca/science-briefs April 23, 2021 | 8Ontario COVID-19 Science Advisory Table A Vaccination Strategy for Ontario COVID-19 Hotspots and Essential Workers
strategy. For this strategy, we assumed that 80% of the population aged 60 years
and above would be vaccinated by April 28, 2021, at which point the strategy would
proceed to vaccinating individuals aged 16 to 59 years of age. In the initial
strategy,16,17 an additional 900,000 doses were allocated to COVID-19 hotspots. We
assumed that these allocated doses would be distributed at a rate of 450,000 doses
per month, and would be administered to produce equal coverage across the
neighbourhood risk groups, mitigating the previously observed disparities in vaccine
coverage across the groups (see Figure 2).
The hotspot-accelerated vaccination strategy was assumed to allocate 50% of COVID
-19 vaccines to the 74 COVID-19 hotspots ranked in the top 20% of cumulative SARS-
CoV-2 incidence among all Ontario neighbourhoods, and the remaining 50% of
vaccines would be equally distributed across the province (including hotspots).1 This
means that 60% of Ontario’s COVID-19 vaccine supply would be allocated to the
20% of Ontario’s population living in the hotspots identified by the Ontario COVID-
19 Science Advisory Table.1
We then compared the difference in infections averted, and applied age-specific
COVID-19 hospitalization, need for ICU, and mortality based on Ontario data and
under the assumption that >80% of cases would be a variant of concern (specifically
B.1.1.7).1,24,25. We assumed that age-specific metrics for COVID-19 severity
(hospitalization, ICU, and mortality) were the same in COVID-19 hotspots and lower
SARS-CoV-2 incidence neighbourhoods although data suggest age-specific case-
fatality rates remain higher in lower-income neighbourhoods even after adjustment
for comorbidities.10 Thus, impact may reflect an underestimate of severity
prevented within COVID-19 hotpots.
Author Contributions
SM, BS and PJ conceived the Science Brief. SM, NMS, AO and PJ wrote the first draft
of the Science Brief. SM, KAB, BS, HM, GM, AE, and PJ performed the analyses. All
authors revised the Science Brief critically for important intellectual content and
approved the final version. BS and PJ contributed equally.
References
1. Brown KA, Stall NM, Joh E, et al. A strategy for the mass distribution of COVID-19
vaccines in Ontario based on age and neighbourhood. Sci Briefs Ont COVID-19
Sci Advis Table. 2021;2(10). https://doi.org/10.47326/ocsat.2021.02.10.1.0
2. Chagla Z, Ma H, Sander B, Baral SD, Mishra S. Characterizing the
disproportionate burden of SARS-CoV-2 variants of concern among essential
workers in the Greater Toronto Area, Canada. medRxiv. Published online March
26, 2021:2021.03.22.21254127. https://doi.org/10.1101/2021.03.22.21254127
3. Sundaram ME, Calzavara A, Mishra S, et al. The individual and social
determinants of COVID-19 in Ontario, Canada: a population-wide study.
medRxiv. Published online November 12, 2020:2020.11.09.20223792. https://
doi.org/10.1101/2020.11.09.20223792
4. Mishra S, Ma H, Moloney G, et al. Increasing concentration of COVID-19 by
socioeconomic determinants and geography in Toronto, Canada: an
observational study. medRxiv. Published online April 6,
2021:2021.04.01.21254585. https://doi.org/10.1101/2021.04.01.21254585
5. Paul LA, Daneman N, Brown KA, et al. Characteristics associated with household
transmission of SARS-CoV-2 in Ontario, Canada. medRxiv. Published online
Science Briefs | https://covid19-sciencetable.ca/science-briefs April 23, 2021 | 9Ontario COVID-19 Science Advisory Table A Vaccination Strategy for Ontario COVID-19 Hotspots and Essential Workers
October 26, 2020:2020.10.22.20217802. https://
doi.org/10.1101/2020.10.22.20217802
6. Government of Canada. Occupational classifications. Statistics Canada.
Published November 21, 2011. https://www.statcan.gc.ca/eng/concepts/
occupation
7. Baden LR, El Sahly HM, Essink B, et al. Efficacy and safety of the mRNA-1273
SARS-CoV-2 vaccine. N Engl J Med. Published online December 30, 2020. https://
doi.org/10.1056/NEJMoa2035389
8. Polack FP, Thomas SJ, Kitchin N, et al. Safety and efficacy of the BNT162b2
mRNA COVID-19 vaccine. N Engl J Med. Published online December 10, 2020.
https://doi.org/10.1056/NEJMoa2034577
9. Hall VJ, Foulkes S, Saei A, et al. Effectiveness of BNT162b2 mRNA vaccine against
Infection and COVID-19 vaccine voverage in healthcare workers in England,
multicentre prospective cohort study (the SIREN study). SSRN. Published online
February 22, 2021. https://doi.org/10.2139/ssrn.3790399
10. Thompson MG. Interim Estimates of Vaccine Effectiveness of BNT162b2 and
mRNA-1273 COVID-19 Vaccines in Preventing SARS-CoV-2 Infection Among
Health Care Personnel, First Responders, and Other Essential and Frontline
Workers — Eight U.S. Locations, December 2020–March 2021. MMWR Morb
Mortal Wkly Rep. 2021;70. https://doi.org/10.15585/mmwr.mm7013e3
11. Dagan N, Barda N, Kepten E, et al. BNT162b2 mRNA Covid-19 Vaccine in a
Nationwide Mass Vaccination Setting. N Engl J Med. Published online February
24, 2021. https://doi.org/10.1056/NEJMoa2101765
12. Mulberry N, Tupper P, Kirwin E, McCabe C, Colijn C. Vaccine Rollout Strategies:
The Case for Vaccinating Essential Workers Early.; 2021. https://github.com/
nmulberry/essential-workers-vaccine/blob/main/vaccine_rollout_preprint.pdf
13. Rodríguez J, Patón M, Acuña JM. COVID-19 vaccination rate and protection
attitudes can determine the best prioritisation strategy to reduce fatalities.
medRxiv. Published online February 10, 2021:2020.10.12.20211094. https://
doi.org/10.1101/2020.10.12.20211094
14. ICES. COVID-19 Dashboard. Published 2021. Accessed July 24, 2020. https://
www.ices.on.ca/DAS/AHRQ/COVID-19-Dashboard
15. Rao A, Ma H, Moloney G, et al. A disproportionate epidemic: COVID-19 cases
and deaths among essential workers in Toronto, Canada. medRxiv. Published
online February 18, 2021:2021.02.15.21251572. https://
doi.org/10.1101/2021.02.15.21251572
16. McGrath JM. Here’s what Ontario’s latest vaccine plan says. TVO.org. Published
March 5, 2021. https://www.tvo.org/article/heres-what-ontarios-latest-vaccine-
plan-says
17. Government of Ontario. Ontario moving to Phase Two of COVID-19 vaccine
distribution plan. Published April 6, 2021. https://news.ontario.ca/en/
release/61009/ontario-moving-to-phase-two-of-covid-19-vaccine-distribution-
plan
18. Government of Ontario. COVID-19: Guidance for Prioritization of Phase 2
Populations for COVID-19 Vaccination. Ministry of Health; 2021. Accessed April
7, 2021. https://www.health.gov.on.ca/en/pro/programs/publichealth/
coronavirus/docs/vaccine/COVID-19_Phase_2_vaccination_prioritization.pdf
Science Briefs | https://covid19-sciencetable.ca/science-briefs April 23, 2021 | 10Ontario COVID-19 Science Advisory Table A Vaccination Strategy for Ontario COVID-19 Hotspots and Essential Workers
19. McGrath JM. Here’s Ontario’s revised Phase 2 vaccination plan. TVO.org.
Published April 13, 2021. https://www.tvo.org/article/heres-ontarios-revised-
phase-2-vaccination-plan
20. Crawley M, April 13 2021 6:09 AM ET | Last Updated: These “hot spots” getting
vaccine priority are less hard-hit by COVID-19 than Ontario average. CBC.
Published April 12, 2021. https://www.cbc.ca/news/canada/toronto/ontario-
covid-19-vaccination-postal-code-hot-spots-1.5983155
21. Warren M, Wallace K, Tulk C. Ontario ignored its own Science Table’s advice on
several COVID-19 vaccine hotspot postal codes. thestar.com. Published April 20,
2021. https://www.thestar.com/news/gta/2021/04/20/ontario-ignored-its-own
-science-tables-advice-on-several-covid-19-vaccine-hotspot-postal-codes.html
22. Global News. Ontario increasing COVID-19 vaccine supply to ‘hot spots,’ Ford
says. Global News. Published April 16, 2021. https://globalnews.ca/
video/7764570/ontario-increasing-covid-19-vaccine-supply-to-hot-spots-ford-
says/
23. Research Group in Mathematical Modeling and Health Economics of Infectious
Disease. COVID-19 pandemic. Published 2021. https://marc-brisson.net/
24. Tuite AR, Fisman DN, Odutayo A, et al. COVID-19 hospitalizations, ICU
admissions and deaths associated with the new variants of concern. Sci Briefs
Ont COVID-19 Sci Advis Table. 2021;1(18). https://doi.org/10.47326/
ocsat.2021.02.18.1.0
25. Mac S, Barrett K, Khan YA, et al. COVID-19 demographics, acute care resource
use and mortality by age and sex in Ontario, Canada: population-based
retrospective cohort analysis. medRxiv. Published online November 6,
2020:2020.11.04.20225474. https://doi.org/10.1101/2020.11.04.20225474
26. Kwong J, Calzavara A, Sundaram M, Mishra S. Predictors of Case Fatality among
Individuals Who Have Tested Positive for COVID-19.; 2021:1. https://wellness-
hub.ca/wp-content/uploads/Predictors-of-Case-Fatality-COVID-19-Research-
Brief-2.pdf
Science Briefs | https://covid19-sciencetable.ca/science-briefs April 23, 2021 | 11You can also read