Research on variable parameter power differential charge-discharge strategy of energy storage system in isolated island operating microgrid
←
→
Page content transcription
If your browser does not render page correctly, please read the page content below
Research on variable parameter power
                  differential charge–discharge strategy of
                  energy storage system in isolated island
                  operating microgrid

                                                                                                                                                                                    Downloaded from https://academic.oup.com/ijlct/advance-article/doi/10.1093/ijlct/ctaa098/6066667 by guest on 03 February 2021
                  ..............................................................................................................................................................

                                   Tiezhou Wu*, Jin Wang, Yibo Qi and Fumei Rong
                                   Hubei Key Laboratory for High-efficiency Utilization of Solar Energy and Operation
                                   Control of Energy Storage System, Hubei University of Technology, Wuhan, Hubei 430068,
                                   China
                                   .............................................................................................................................................
                                   Abstract
                                   This paper proposed an improved particle swarm optimization (PSO) algorithm for the variable parameter
                                   power difference charging and discharging strategy of battery energy storage system (BESS). The charge and
                                   discharge power of the BESS under different load intervals and state of charge (SOC) intervals are distributed,
                                   and the objective functions of peak shaving and valley filling standard deviation and minimum SOC off-line
                                   rate are established. The simulation model of peak shaving and valley filling is built, and the results show
                                   that the standard deviation of peak shaving and valley filling reduced by 22.58% compared with PSO. The
                                   effectiveness and feasibility of the improved PSO are verified.

                                   Keywords: battery energy storage system; variable parameter power difference; charged state; peak shaving
                                   and valley filling; particle swarm optimization

*Corresponding author.             Received 13 November 2020; revised 1 December 2020; editorial decision 9 December 2020; accepted 9
a19931995@163.com                  December 2020
.................................................................................................................................................................................

1 INTRODUCTION                                                                               Currently, there are extensive studies on the problem of peak
                                                                                          shaving and valley filling in BESS. In [4, 5], a BESS operating with
Electricity cannot be stored on a large scale; supply and demand                          a constant power (CP) charge and discharge strategy is used and
must be balanced. As the difference between morning and evening                           a CP charging and discharging optimization model is proposed
power consumption gradually increases, the peak to valley value                           based on the sequential second algorithm. In [6, 7], a control
of the power load is gradually increasing [1]. Battery energy                             strategy of peak cutting and valley filling based on dynamic pro-
storage system (BESS) has the characteristics of storing electric                         gramming is proposed and, at the same time, the impact of charge
energy; it uses BESS to charge when the power load trough                                 and discharge depth on battery life is considered, but it limits the
discharges at the peak of power load, to achieve peak shaving and                         number of charge and discharge per day and the large changes due
valley filling of power load [2]. Therefore, the country vigorously                       to load in some scenarios; the energy storage system may need to
promotes the application of BESS in microgrids. Among them,                               change the charge and discharge state many times. The authors
there are many solving algorithms for BESS models. These meth-                            in [8–10] compare CP and variable parameter power difference
ods include decomposition techniques, dynamic programming,                                (VPPD) control strategies; they show that the control effect of
Lagrangian relaxation and nonlinear programming. Although                                 VPPD control strategy is better than the CP control strategy and
these traditional algorithms have different functions, they reduce                        that using the bat algorithm to solve the objective function, the
computing time and memory requirements. In recent years, intel-                           algorithm process is complicated. In [11, 12], the charging and
ligent algorithm technology, such as genetic algorithm, simulated                         discharging strategy are optimized based on the improved particle
annealing algorithm and bat algorithm, is also used to solve the                          swarm optimization (PSO) and the state interval of SOC is not
problem of BESS operating in microgrid [3].                                               considered. The authors in [13, 14] use PSO to solve the objective

International Journal of Low-Carbon Technologies 2021, 00, 1–8
© The Author(s) 2021. Published by Oxford University Press.
This is an Open Access article distributed under the terms of the Creative Commons Attribution Non-Commercial License (http://creativecommons.org/licenses/
by-nc/4.0/), which permits non-commercial re-use, distribution, and reproduction in any medium, provided the original work is properly cited. For commercial
re-use, please contact journals.permissions@oup.com
doi:10.1093/ijlct/ctaa098                                                                                                                                 1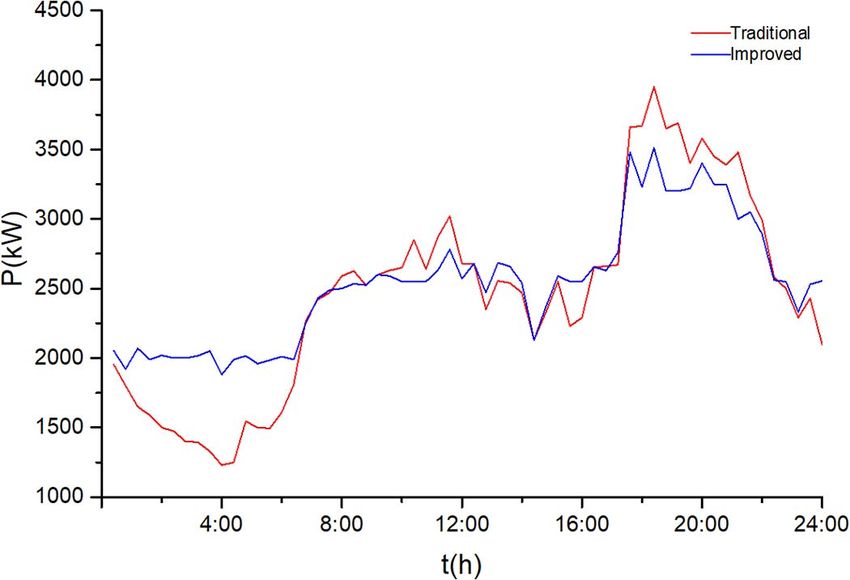
T. Wu et al.

                                                                                                                                              Downloaded from https://academic.oup.com/ijlct/advance-article/doi/10.1093/ijlct/ctaa098/6066667 by guest on 03 February 2021
Figure 1. Load interval.

                                                                      Figure 2. SOC interval.
function but made no improvements to the algorithm, making
the solution of the objective function easy to fall into the local
optimum and thereby affecting the effect of peak shaving and             (2) Initial value Pav , the step size is P to iterate until it is
valley filling. In Reference [15] divide the SOC into five sections   satisfied that the total amount of charge and the total amount of
by size, determine the current working range of SOC, real-time        discharge of the BESS are approximately equal.
adjustment of filter constant, established capacity optimization         (3) According to Step (2), determine the upper and lower charg-
configuration method for energy storage system.                       ing limits of the BESS, and determine the charge and discharge
   Aiming at the battery energy storage model of microgrid, an        power according to the actual situation.
improved PSO is proposed to study the VPPD control strategy              As can be seen from Figure 1, according to P1 and P2 , divide
of BESS. It is based on a constant parameter power difference         the load into three parts; they are load 1 interval, load 2 interval
(CPPD) control strategy, introduces the SOC state interval and        and load 3 interval.
takes the SOC evaluation index as one of the objective functions.
The improved PSO to solve the objective function, thus, optimizes
the VPPD control strategy.
                                                                      2.2 Division of SOC interval
                                                                      By introducing two parameters Sup and Sdown , divide the SOC
                                                                      state interval into five parts to avoid the problem of overcharge
                                                                      and overdischarge of the BESS and to prolong the service life of
2 VPPD CONTROL STRATEGY                                               the battery, as shown in Figure 2 [11].
                                                                         (1) Lower limit interval of SOC:
The BESS has a CP control strategy for charging and discharging,
a CPPD control strategy and a VPPD control strategy. Among
them, the VPPD control strategy [10] fully considers the state of                                 0 < S (t) < Smin                     (1)
SOC based on the CPPD control strategy, the proposed SOC state
adaptive VPPD control strategy, making the BESS avoid the high
                                                                        (2) Low range of SOC:
and low SOC ranges and thereby prolonging the service life of the
battery.
                                                                                                Smin ≤ S (t) < Sdown                   (2)

2.1 Division of load interval
                                                                        (3) Normal range of SOC:
Through the power difference control strategy, the lower P1 limit
power P1 of load discharge, the upper limit power P2 of BESS
charging during charging and discharging of the BESS are deter-                                 Sdown ≤ S (t) < Sup                    (3)
mined. Thus, the state of the load is divided into three states, as
shown in Figure 1.
                                                                        (4) High value range of SOC:
  The specific steps of the CPPD control strategy are as follows.
  (1) Through the predicted daily load curve, calculate its average
Pav , and determine P1 , P2 initial value.                                                       Sup ≤ S (t) < Smax                    (4)

2   International Journal of Low-Carbon Technologies 2021, 00, 1–8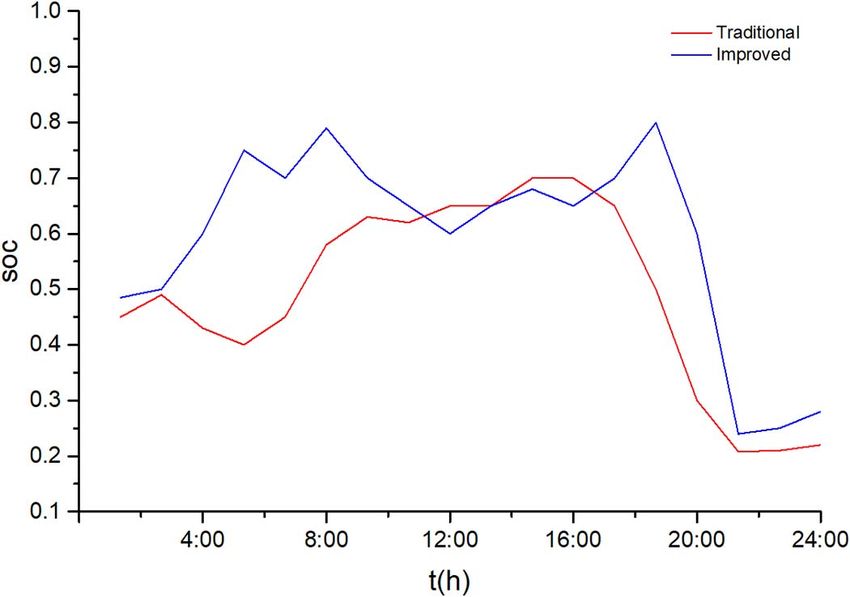
VPP differential charge–discharge strategy

  (5) Upper limit range of SOC:                                            where 0 < K3 < 1.
                                                                             In load 2 interval, the BESS stands still.
                          Smax ≤ S (t) < 1,                        (5)       In load 3 interval, the BESS discharges.

whereS(t) is the SOC value of the BESS at time.                                  Pd = K4 (Pt − P1 ) + (1 − K1 ) min (Pe Pt − P2 ) ,              (12)

                                                                           where 0 < K4 < 1.
2.3 Research and implementation of adaptive power                             (5) The upper limit range of SOC: contrary to the SOC lower
difference control                                                         limit interval.

                                                                                                                                                          Downloaded from https://academic.oup.com/ijlct/advance-article/doi/10.1093/ijlct/ctaa098/6066667 by guest on 03 February 2021
(1) The lower limit interval of SOC: the BESS only performs                   In load 1 interval, the BESS stands still.
charging operations.                                                          In load 2 and 3 intervals, the BESS discharges.
  Load intervals 1 and 2: the BESS is charged with the discharge
upper limit P1 as the target.                                                                       Pd = min (Pe, Pt − P2 )                       (13)

                      Pc = min (Pe , P1 − Pt ) ,                   (6)        The above is the charging and discharging situation of the BESS
                                                                           in different load intervals and SOC intervals.
where Pc is the charging power of the BESS, Pe is the rated power             ThroughSup , Sdown , K1 , K2 , K3 , K4 , the six parameters for
of the BESS and Pt is the load power at the moment.                        rolling optimization, realize the adaptive power difference control
   The BESS stands still in the load 3 interval.                           in different load intervals and SOC intervals; the flowchart is
   (2) The low range of SOC: according to different load intervals,        shown in Figure 3.
charge and discharge the BESS.
   In load 1 interval, the BESS is charging. At this time, the SOC
value is relatively low and it is easy to enter the lower limit of SOC,    3 RESEARCH ON OBJECTIVE FUNCTION
so increase the charging power.                                            AND IMPROVED PSO
        Pc = K1 (P2 − Pt ) + (1 − K1 ) min (Pe P1 − Pt ) ,        (7)     The main contents of this paper are the BESS charging and
                                                                           discharging optimization strategy and the establishment of load
where 0 < K1 < 1.                                                          shaving and valley filling, SOC cross-line rate objective function
   In load 2 interval, the BESS stands still.                              and grid power balance and BESS constraint conditions, using
   In load 3 interval, the BESS is charging, the SOC value is              improved PSO to model the model optimization. Therefore, the
relatively low at this time and the excessive discharge power makes        BESS achieves a good effect of peak shaving and valley filling.
it easy to enter the lower limit of SOC.
                                                                           3.1 Objective function
                        Pd = K2 (P2 − Pt ) ,                       (8)     The purpose of the BESS participating in load shaving and valley
                                                                           filling is to increase the load of the wave valley, reduce the load of
where 0 < K2 < 1.                                                          the wave peak and ensure the stability of the load.
  (3) The normal range of SOC.                                            (1) The effect of load peak shaving and valley filling is evaluated
  In load 1 interval, the BESS is charging.                                   and the evaluation index is F1 .

                            Pc = P2 − Pt                           (9)
                                                                                                    T+t
                                                                                                      t=T     pout(t)− pout−avg(T) 2
  In load 2 interval, the BESS stands still.                                             F1 =                                        ,            (14)
                                                                                                                   t
  In load 3 interval, the BESS discharges.
                                                                           where Pout(t) is the power on the load side at time and Pout-avg(T)
                                                                           is the time period [T,T +T] average power on the load side.
                            Pd = Pt − P1                          (10)
                                                                          (2) SOC evaluation index.
  (4) The high value range of SOC: contrary to the low SOC                 To consider the SOC state of the BESS, lead into [T,T + T] the
range.                                                                     SOC over-line rate during time period F2 .,
  In load 1 interval, the BESS is charging.
                                                                                                      ts>smax ts
T. Wu et al.
Downloaded from https://academic.oup.com/ijlct/advance-article/doi/10.1093/ijlct/ctaa098/6066667 by guest on 03 February 2021
Figure 3. Flow chart of adaptive control strategy.
where: ts>smax is the time for SOC value to enter the upper limit Since F1, F2 represents different sub-objective functions, there-
interval in this period and fore, the weight coefficient of the sub-objective function λi (1, 2)
tsVPP differential charge–discharge strategy
(1) Assuming there are n sub-objective functions, calculate the
optimal solution of the sub-objective function separatelymin Fx (x),
marked as Xi (i = 1, 2, . . . , n);
(2) Iterate on the optimal solution of the sub-objective function,
and calculate the corresponding sub-objective function value
Fj (xi );
(3) Calculate the coefficient of variation of the sub-objective
function under different solutions li .
n j=i
Downloaded from https://academic.oup.com/ijlct/advance-article/doi/10.1093/ijlct/ctaa098/6066667 by guest on 03 February 2021
( )
1 j Fi xj − Fi (xi )
li (19)
Fi (xi ) n−1
Coefficient of variation: the deviation of the objective function
value from the optimal solution of the sub-objective function.
(4) Calculate the weight coefficient of the sub-objective func-
tion c(λi ).
li
c (λi ) = n , (i = 1, 2, . . . n) (20)
j=1 li
(5) Sort the aforementioned coefficient of variation from small
to large, and sort the weight coefficient from large to small. The
sub-objective function with the smaller coefficient of variation is
multiplied by the larger weight coefficient and vice versa, and it is
multiplied by the smaller weight coefficient. Better determine the
weight coefficient of the objective function.
3.3 Constraints
In this model, only the physical model related to the BESS and
the constraint conditions generated by the grid power balance are
considered [14].
(1) Grid power balance constraints:
Pout = Pload − Pess , (21)
where Pout is the output power of the grid; Pload is the load power
of the user; Pess is the output of energy storage batteries, when the Figure 4. Algorithm flow chart.
energy storage battery is discharged; and Pess > 0 and vice versa
Pess ≤ 0.
(2) Constraints of BESS 3.4 Improved PSO
1 Constraints of SOC: PSO is a swarm intelligence optimization algorithm, which has
the characteristics of fast running speed and simple algorithm.
SOCmin ≤ SOC(t) ≤ SOCmax , (22) However, PSO still has the problem of easily falling into local
optimization and the ergodicity of chaos theory is used to solve
the local optimization problem of PSO. Update the velocity and
where SOCmin = 20% and SOCmax = 80%. position of the particles according to the following formula, as
2 Constraints on the charging and discharging power of shown in Equations (25) and (26) [15–17].
energy storage batteries:
0 ≤ Pc ≤ Pe (23) Vij(t+1) = ωVij(t) + c1 r1 pbest ij(t) − xij(t)
+ c2 r2 pbest j(t) − xij(t) (25)
0 ≤ Pd ≤ Pe (24)
International Journal of Low-Carbon Technologies 2021, 00, 1–8 5T. Wu et al.
xij(t+1) = xij(t) + vij(t+1) , (26)
where i is the number of particles; j is the first dimension of the
particle; w is the inertia factor; c1 c2 is the learning factor; vij(t+1) is
the velocity component of the particle i in the j dimension when it
evolves to generation t + 1; Vij(t) is the velocity component of par-
ticle iin the jdimension when it evolves to generation T; pbesst ij(t)
Downloaded from https://academic.oup.com/ijlct/advance-article/doi/10.1093/ijlct/ctaa098/6066667 by guest on 03 February 2021
is the particle ievolves to the optimal position component of the j
dimension individual in the T generation; gbesst ij(t) is the particlei
to evolve to the j dimension of the T generation, the optimal
position component of the entire particle swarm; xij(t+1) is the
component of the particle iin the j dimension when it evolves to
the T + 1 generation; and xij(t) is the component of particle iin the
j dimension when it evolves to generation T.
Because chaos theory is ergodic and can effectively change the
distribution of particles, it improves the global search capability of Figure 5. Daily load forecasting curve.
the algorithm. The classic chaotic system is Logistic, as Equation
(2) shows:
Table 1. Parameters of BESS.
Parameter name Date
Zn+1 = μZn (1 − Zn ) , 0 < Zn < 1, μ = 4, (27)
Maximum charging power (kW) 1000
Maximum discharge power (kW) 800
Minimum SOC (%) 20
where Zn+1 is the next state of the chaotic system, Zn is the current Maximum SOC (%) 80
state of the chaotic system and u = 4 is a state of complete chaos. Rated capacity (kWh) 1000
The specific steps of the algorithm are as follows and the
algorithm flowchart is shown in Figure 4.
(1) Initialization: set the number of particles (num = 60), the
dimension of the particle (D = 3), the learning factor (c1 = c2 = 4 SIMULATION
2) and the inertia factor (ω = 0.9). The speed of the particle, the
maximum number of iterations, the accuracy of the particle and In this paper, a typical day load data in a commercial area is
initialization of chaotic variables, excluding the five fixed points used as an example to analyze the effectiveness of the improved
in the chaos iterative equation (0, 0.25, 0.5, 0.75). PSO.
(2) Order t = 0, and generate D chaotic variable factors
chaosi(i), 1 ≤ i ≤ D; t is the number of iterations.
(3) Calculate the fitness value of the particle, according to 4.1 Improved PSO control strategy simulation
Equations (25) and (26), and update the speed and position of the The energy storage batteries in this commercial area are lithium
particles. batteries; the typical daily load forecast curve is shown in Figure 5.
(4) Determine whether the particle falls into a local optimum Low electricity consumption in the commercial area is about 4:00,
(according to the position of multiple particles are close or coin- and there are two peaks in electricity consumption, which are
cide): if it is not locally optimal, perform Step (6); otherwise, around 11:30 and 20:00; it is basically in line with the actual
perform the next step. situation.
(5) Use chaotic variables to assign values to particle positions According to the typical daily load forecast curve and power
chaotically, and substitute Logistic, among Equation (26) iterative difference control strategy, calculate the typical daily load forecast
attention; to distinguish chaotic variable intervals [0,1], map the curve discharge lower limit power P1 = 3255.08kW, the max-
value range of the corresponding variable. imum charging power P2 = 2129.17kW and the daily average
(6) Determine the solution of particle multi-object fitness gbest load power Pav = 2469.08kW. Assuming that the upper limit of
and pbest. the SOC of the BESS is 0.8, the lower limit of SOC is 0.2 and the
(7) Determine whether the particle meets the termination con- charge and discharge efficiency is 100%. The relevant parameters
dition: if not satisfied, perform Step (3); otherwise, perform the of the BESS are shown in Table 1. Among them, an improved PSO
next step. is used to optimize the adaptive power difference control strategy.
(8) The result is output and the program ends. The simulation results are shown in Figures 6–8.
6 International Journal of Low-Carbon Technologies 2021, 00, 1–8VPP differential charge–discharge strategy
Table 2. Comparison parameters of peak shaving and valley filling.
Traditional Improved Absolute value Improved rate (%)
Peak valley (kW) 3850 3400 450 11.68
Valley (kW) 1495 1895 400 26.75
Standard deviation of load 802.31 621.14 181.17 22.58
Mean value of load 2485.18 2520.20 35.02 1.40
Load rate (%) 60.96 74.12 13.16 21.60
Downloaded from https://academic.oup.com/ijlct/advance-article/doi/10.1093/ijlct/ctaa098/6066667 by guest on 03 February 2021
Figure 8. Different control strategies interval diagram.
Figure 6. Different control strategies SOC diagram.
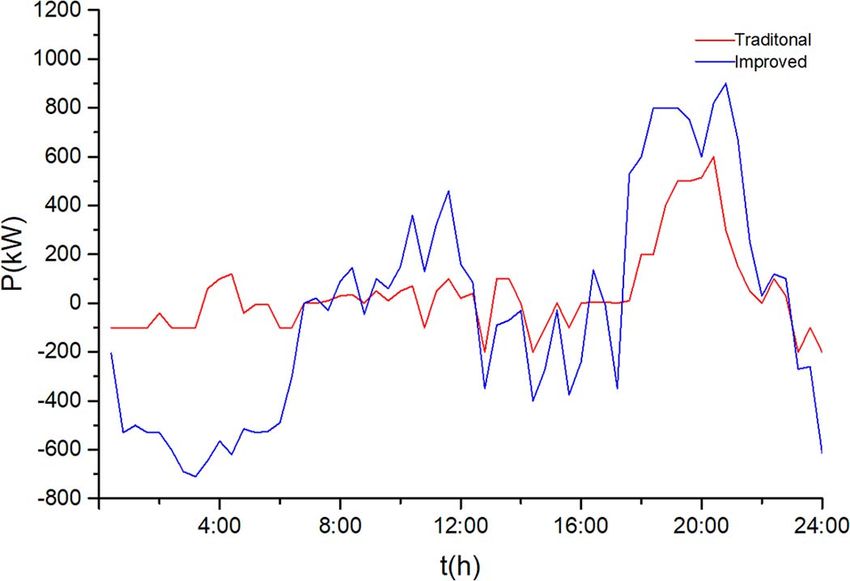
As shown in Figure 7, the output state of the energy storage
battery changes with the change of the load power. The output
of the BESS under the power difference control strategy and the
traditional VPPD control strategy is relatively flat, the BESS under
the improved VPPD control strategy and the output fluctuates
greatly, so the effect of load peak shaving and valley filling is
ensured, the output of the generator set is reduced and economy
of the power grid is improved.
As shown in Figure 8, the load peak-shaving and valley-filling
effect under the traditional VPPD control strategy is poor and
the improved VPPD control strategy significantly improves the
load curve and is smoother, thereby reducing the load peak-
valley difference and improving the smoothness of the load curve
to achieve the purpose of cutting peaks and filling valleys. The
specific parameters before and after the VPPD optimization are
Figure 7. Output status of BESS. shown in Table 2. Compared with the traditional VPPD control
strategy, the load peak value under the improved VPPD con-
trol strategy is reduced from 3850 kW before optimization to
4.2 Comparative analysis of the effects of different 3400 kW after optimization, the trough value was increased from
control strategies 1495 kW before optimization to 1895 kW after optimization and
As shown in Figure 6, the SOC range of the BESS floats in the standard deviation of the objective function is reduced by
[0.2, 0.8], under the action of the VPPD control strategy, realizes 181.17; in addition, the increase in load rate improves equipment
the self-adaptive adjustment of SOC, which is conducive to utilization, reduces network loss and improves the power quality.
load peak shaving and valley filling and prolonging the service The calculation formula of load factor is shown in (2).
life of BESS. Among them, the SOC curve fluctuation range of
Pav
the improved VPPD control strategy is larger, which effectively g= , (28)
expands the SOC variation range, thereby optimizing the VPPD Pmax
control strategy. where Pmax is the maximum power of the load.
International Journal of Low-Carbon Technologies 2021, 00, 1–8 7T. Wu et al.
5 CONCLUSION [4] Ren Z, Junyong L, Guangsen W et al. 2016. The charging and discharging
balance control strategy of power batteries for hybrid energy storage.
In 2016 International Symposium on Power Electronics, Electrical Drives,
In this paper, the VPPD control strategy is studied theoretically Automation and Motion (SPEEDAM). Anacapri: Elsevier. 265–9.
and the influence of SOC interval on the VPPD control strategy [5] Osorio GJ, Rodrigues EMG, Lujano-Rojas JM et al. New control strategy
is analyzed. On this basis, the VPPD charging and discharging for the weekly scheduling of insular power systems with a battery energy
strategy of the energy storage system in isolated island operating storage system. Appl Energy 2015;154:459–70.
microgrid is designed. According to the ergodicity of chaotic vari- [6] Hou T, Cui Y, Zhou X et al. 2016. Charge-discharge strategy for battery
energy storage to smooth power fluctuations from wind farms. In 2016
ables, the local optimal problem of PSO is solved; thus, the VPPD China International Conference on Electricity Distribution (CICED). Xi’an:
control strategy is optimized. The main results are as follows. Springer. 1–5.
Downloaded from https://academic.oup.com/ijlct/advance-article/doi/10.1093/ijlct/ctaa098/6066667 by guest on 03 February 2021
(1) By analyzing the VPPD control strategy, determine the [7] Zhang D, Zhang S, Teng L et al. 2018. Research on a peak-cutting and
charging and discharging power of the BESS in different load valley-filling Optimal Algorithm Based on Communication Power Sup-
intervals and SOC intervals. ply. In 2018 IEEE International Telecommunications Energy Conference
(INTELEC). Turin: IEEE. 1–5.
Improved PSO optimizes SOC interval, thus, the VPPD control [8] Chen C, Liu B, Duan S et al. 2013. Centralized control of parallel con-
strategy is optimized, to achieve a good peak load clipping effect. nected power conditioning system for battery energy storage system in
(2) By comparing the optimization ability of PSO and the charge-discharge-storage power station. In Energy Conversion Congress
improved PSO with MATLAB, the results show that the PSO and Exposition (ECCE). IEEE. 2013.
improved by chaotic perturbation improves the particle search [9] Wang H, Jiancheng Z. 2016. Research on charging/discharging control
strategy of battery-super capacitor hybrid energy storage system in pho-
ability, the VPPD control strategy is optimized and the standard tovoltaic system. In 2016 IEEE 8th International Power Electronics and
deviation of the load was reduced by 22.58%. Motion Control Conference (IPEMC-ECCE Asia). IEEE.
[10] Yong W, Haihong B, Chunning W. Research on charging and discharg-
ing dispatching strategy for Electric Vehicles. Open Fuels Energy Sci J
CONFLICT OF INTEREST 2015;8:176–82.
[11] Liang H, Liu Y, Li F, Shen Y. Dynamic economic/emission dispatch
The authors declare that they have no known competing financial including PEVs for peak shaving and valley filling. IEEE Trans Ind Electron
interests or personal relationships that could have appeared to 2019;66:2880–90.
influence the work reported in this paper. [12] Yang J, Jin X, Wu X et al. A wireless power sharing control strategy for
hybrid energy storage systems in DC microgrids. Trans China Electrotech
Soc 2017;32:135–44.
[13] Shi C, Wei T, Tang X et al. Charging–discharging control strategy for
ACKNOWLEDGMENT a flywheel array energy storage system based on the equal incremental
principle. Energies 2019;12:16–27.
This work is supported by the Natural Science Foundation of [14] Ramadan H, Ali A, Nour M, Farkas C. 2018. Smart charging and discharg-
Hubei Province (2016CFB397). ing of plug-in electric vehicles for peak shaving and valley filling of the
grid power. In 2018 Twentieth International Middle East Power Systems
Conference (MEPCON). Cairo, Egypt: Elsevier. 735–9.
REFERENCES [15] Wang H, Wu Z, Shi G, Liu Z. 2019. SOC balancing method for hybrid
energy storage system in microgrid. In 2019 IEEE 3rd International Con-
[1] Lawder MT, Suthar B, Northrop PWC et al. Battery energy storage system ference on Green Energy and Applications (ICGEA). Taiyuan, China: IEEE.
(BESS) and battery management system (BMS) for grid-scale applications. 141–5.
Proc IEEE 2014;102:1014–30. [16] Munlin M, Anantathanavit M. 2017. New social-based radius particle
[2] Ji F, Liao L, Wu T et al. Self-reconfiguration batteries with stable voltage swarm optimization. In 2017 12th IEEE Conference on Industrial Electron-
during the full cycle without the DC-DC converter. J Energy Storage ics and Applications (ICIEA). Siem Reap: IEEE. 838–43.
2020;28:101213. [17] Licui W. 2018. Research on optimal scheduling of energy storage sys-
[3] Litchy AJ, Nehrir MH. 2013. Real-time energy management of an islanded tem based on particle swarm optimization. In 2018 IEEE 3rd Advanced
microgrid using multi-objective particle swarm optimization. In Pes Gen- Information Technology, Electronic and Automation Control Conference
eral Meeting Conference & Exposition. IEEE. (IAEAC). Chongqing: IEEE. 1604–7.
8 International Journal of Low-Carbon Technologies 2021, 00, 1–8You can also read