A Quality Control Application in a Furniture Company - IEOM
←
→
Page content transcription
If your browser does not render page correctly, please read the page content below
Proceedings of the International Conference on Industrial Engineering and Operations Management
Dubai, UAE, March 10-12, 2020

     A Quality Control Application in a Furniture Company
                                             Mehmet Savsar
                                            Kuwait University
                               Industrial Engineering Department, Kuwait
                                                   and
                                           Üsküdar University
                           Industrial Engineering Department, Istanbul, Turkey
                                           msavsar@gmail.com

                                               Hazza Alotaibi
                                              Kuwait University
                                 Industrial Engineering Department, Kuwait
                                       hazza.alotaibi@eng.ku.edu.kw

                                                      Abstract

This study deals with a quality control application in a furniture manufacturing company. Furniture
manufacturing involves several wood cutting operations in specified dimensions. Based on our
investigation in a selected sofa-manufacturing factory, we have observed that cutting operations are not
done in accurate procedures and usually result in wood slabs, which deviate from standard dimensions. One
of the reasons that wood cutting operations are not done as accurate as the metal cutting operations is
because it is easy to recut the excessive part on the longer wood slabs, and to add a small piece to the wood
slabs which is cut shorter. These types of simple remedies are not possible in metal cuts. While these extra
processes do not appear to be significant, when they are added up in a mass manufacturing system, the
waste in workers time, as well as in material usage, becomes substantial.

We have investigated a specific sofa manufacturing system and developed some hypothesis testing
procedures to prove to the management the significance of the cutting deviations from the standard
requirements. Amount of waste in labor time and material usage are quantified for a selected manufacturing
period. Furthermore, some quality control procedures, including control charts, are developed and
implemented in the factory to control the cutting operations. The procedures and the results presented in
this study can be used by managers as guidelines in furniture manufacturing industry to improve their
cutting operations and minimize the waste.

Keywords:
Wood cutting, furniture manufacturing, quality control, cutting specifications, material waste

1. Introduction

Dimensions of assembled products in furniture industry play an important role to decide how well the products have
been manufactured. One of the important quality dimensions is quality of conformance. As indicated by Montgomery
(2008), the quality of conformance is an indicator of how well the product conforms to the specifications required by
the designer. The difficulty level of manufacturing processes rapidly increases with the level of complexity and
aesthetic in furniture design, which essentially increases the cost of production. In order for a company to meet
customers satisfaction, it should establish very high standards for each process within limitation of variability, which
is inversely proportional to quality. To improve the quality, one must reduce the variation in quality characteristics.

                                          © IEOM Society International                                              252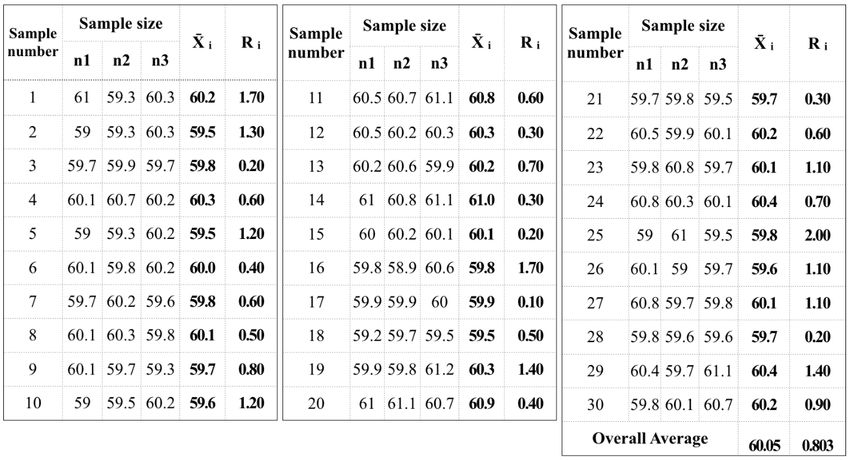
Proceedings of the International Conference on Industrial Engineering and Operations Management
Dubai, UAE, March 10-12, 2020

Quality characteristics are assessed based on how well they meet specifications. Length is one of the physical quality
characteristics in manufacturing specific parts to be used in assembly operations. In furniture manufacturing, length,
width, thickness, and height are typical measures that need to meet specifications. Sabra Junior, et al. (2017) presented
a study that deals with assessment of quality in the furniture production process of a small furniture industry. The goal
was to find potential improvements to the production process. Data are collected over a period and statistically
analyzed. Their results suggest that prior to sanding of parts, extensive reworking was needed in many cases. Simanová
and Gejdoš (2015) presented a procedure to prevent a decrease in quality during production process in furniture
manufacturing. They indicated that there are many tools for achieving operative quality management targets and the
most frequent method is probably measurement and evaluation of the capability of processes through capability
indexes. Simanová et al. (2019) presented a study dealing with improving the performance and quality of processes
by applying and implementing six sigma methodology in furniture manufacturing process,

In this paper, we have considered wood cutting operations in the frame preparation section of a sofa manufacturing
facility. There are 2 cutting benches that cut wood strips into required lengths for all sofa models based on order. In
this study, length of wood strips is considered as a quality characteristic. There are 23 types of sofa models in the
production line. Sofa model II has 15% share of overall production. Each unit of this model requires 6 pieces of 60
cm wood strips in order to assemble wood frame of the sofa. The positions of the wood strip pieces are critical for
fitting and thus, they must be accurate in dimensions, since a small inaccuracy in measurements will cause the pieces
not to fit in the frame. This in turn will impact negatively on dimensions of quality of the sofa units. Management of
the Factory claims that the average length of wood strips produced from cutting benches (1) and (2) are equal and
meet the standard requirements set by the model designer as 60 cm long with a tolerance of ±2%. The main problem
at this stage of production is that when the wood strips are cut beyond tolerance, they do not fit well and need rework.
Reworking process must be applied on these units separately. Due to the wooden raw material, this reworking process
appears to be simple and does not cost much when considering each piece. However, with mass production and without
any quality control assurance, this cost will add up and become excessive overhead burden on the company. There are
several causes that affect the deviations in wood length cut. Unqualified manpower, old machines, bad material used,
wrong methods applied, and poor measuring tools result in dimension inaccuracy. As ındicated by Obucina and
Hasanic (2018) Cause and Effect Diagram is a tool which assists in association, categorization and illustration of
possible causes and problems in quality characteristics. It visually presents the relation of input factors that have
impact on the output. These diagrams are also called “fish-bone diagrams” due to their appearance. The fish bone
diagram illustrated in Figure 1 shows causes of variations in wood strips obtained in wood cutting operations.

                 Manpower                                         Method

             Unskilled workers
                                                             Poor measuring tools
                  Fatigue
                                                       Appearance of dimension inaccuracy
    Low level of the familiarity with machine
                                                                                                      High deviation
                                                                                                         in wood
                                                                                                        length cut
             Appearance of woods cracks                          Inadequate maintenance

                Poor warehousing
                                                       Low number of cutting machine
    Inadequate type of wood material

                  Material                                       Machine

                        Figure 1. Cause-effect diagram of deviation in wood length cut

                                                © IEOM Society International                                         253
Proceedings of the International Conference on Industrial Engineering and Operations Management
Dubai, UAE, March 10-12, 2020

The management has no implementation of quality assurance in the sofa manufacturing line, except physical
inspection at the end of the production. Furthermore, management claims that two wood cutting benches produce
wood pieces, which have the same dimension, and that these dimensions do not deviate from the standard. In order to
check the validity of management’s claim, we developed a hypothesis testing procedure for testing the difference in
mean between the two cutting benches. The objective of the study is to ensure that products meet requirements and
are improved on a continuous basis by reducing the variation in the outputs. The aim of this study is to prevent any
decrease in quality during production and operational processes. As it is explained in detail by Montgomery (2008)
and other countless authors, statistical process control techniques are proven to be very important tools of quality
control and improvement. One of the most widely used tools is the Shewhart control chart, which will also be
developed and implemented in section 3 for the wood cutting process.

In the existing processes at sofa manufacturing line, neither data are collected nor a statistical process control (SPC)
has been implemented. In order to implement such a procedure, some assumptions had to be made. First, data were
collected randomly and independently. Second, frequency of sampling was assumed as equal so that process shifts
could be detected. These assumptions help the implantation of the SPC charts. In the next section, we present the
hypothesis testing for the SPC implementation.

2. Hypothesis Testing for Equality of Means for Wood Cutting Benches

First, we tested the management’s claim that two cutting processes of wood strips have equal average cutting
dimensions. This was a necessary step in order to decide whether control charts should be established for each bench
separately or both benches combined. We proposed a hypothesis testing on equality of mean cutting lengths of wood
strips from two different benches of concern. T-test was needed for such a testing procedure, with unknown variances.
However, in order to use the T-test, we needed to know if the unknown variances were equal or unequal. To test for
the equality of variances of the wood lengths cut in two different benches, F-test for equality of variances had to be
used. The goal was to see if management’s claim of equal means was true. If the claim was true, it would be enough
to construct one quality control chart for the parts coming out of both benches. However, if the claim was not true, it
would be necessary to construct control charts separately for each bench to ensure the equality of the outputs. Length
of wood strips in cm were collected from cutting benches (1) & (2). Ten samples were measured by measuring tape
provided by the company. Table 1 below shows the data recorded in cm. Data were checked by Minitab software to
ensure that normality assumption was valid.

                            Table 1. Length measurements from cutting benches (1) & (2)

                    Sample number                    Bench 1 (cm)                    Bench 2 (cm)
                           1                              60.2                            60.7
                           2                              60.6                            58.7
                           3                               61                             60.3
                           4                              60.7                            58.9
                           5                              60.4                            59.4
                           6                              61.2                            60.9
                           7                              60.3                            59.4
                           8                              59.8                            60.1
                           9                              60.4                            60.5
                           10                             60.9                            59.1

First, two tail F-test was performed to check equality of variances between cutting processes (1) & (2). Test statistic
of the F-test is F0 = S12 / S22, where S1 is a standard deviation of cutting process 1, and S2 is a standard deviation of

                                          © IEOM Society International                                               254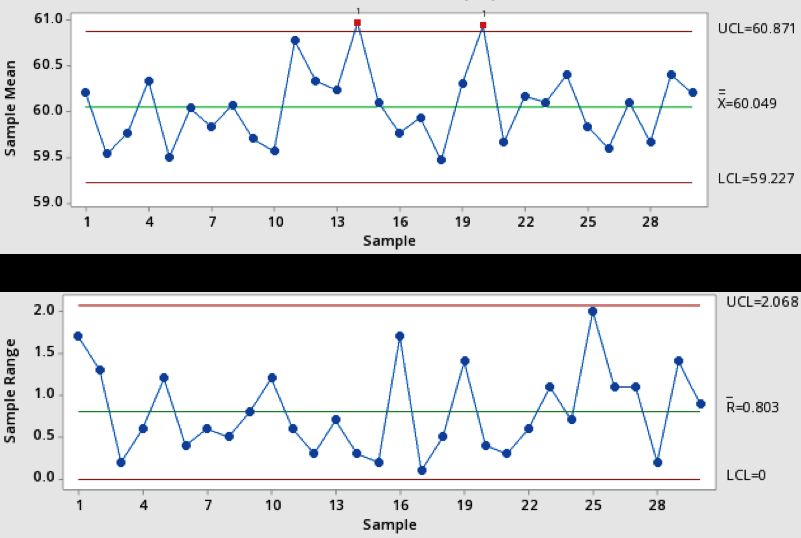
Proceedings of the International Conference on Industrial Engineering and Operations Management
Dubai, UAE, March 10-12, 2020

cutting process 2. The null and alternative hypothesis, level of significance, and rejection are shown in table 2 below.
By using Minitab, we conducted the equality testing of variances between cutting processes (1) & (2). Form the
descriptive statistics we found that the variance in cutting bench (1) is 0.174 and for cutting bench (2) is 0.631. The
confidence limits for 95% level of significant are equal to 1.269 and 4.209. The test statistic was equal to 9.43. As
indicated by Dyckman and Zeff (2019), P-value is the probability of observing a value of the test statistic that is as
extreme as, or more extreme, than the value resulting from the sample, if the null hypothesis is true. The P-value=0.007
< ⍺ = 0.05; therefore, we reject the null hypothesis Ho and conclude that there is strong evidence that wood strips
produced from cutting processes (1) & (2) have unequal variances.

                                         Table 2. Hypothesis Testing for F-test

                         Null hypothesis:                            H0: σ12 / σ22 = 1

                         Alternative hypothesis:                     H1: σ12 / σ22 ≠ 1

                         Significance level:                         ⍺ = 0.05

                         Rejection criterion                         F0 > F ⍺ /2 , n1 −1 , n2 −1

T-test is a one of statistical tests that is heavily used to differentiate between the means of two groups and it’s one of
the statistical hypothesis tests in many studies. Samples are extracted from a cutting bench (1) & (2) and population
variance is unknown, so we use the sample variance to examine the sampling distribution of the mean, which will
resemble a t-distribution (Kim 2015). Based on F-test result, we executed the two tail T-test on difference between
two means, variances unknown and unequal variances (σ12 ≠ σ22). The Test statistic and the degrees of freedom are
shown in the equations below.

The null hypothesis and the alternative with the level of significance are shown in the table 3 below. Where (μ1) is a
mean of wood strips from cutting process 1, and (μ2) is a mean of wood strips from cutting process 2.

                                            Table 3. Null Hypothesis for T-test

                                 Null hypothesis:                     H0 : μ 1 = μ 2
                                 Alternative hypothesis:              H1 : μ 1 ≠ μ 2
                                 Significance level:                      ⍺ = 0.05

The confidence interval with 95% level of significance is (-1.363, -0.137). The P-value = 0.02 < ⍺= 0.05. Therefore,
we reject the Null Hypothesis Ho and conclude that there is strong evidence that the two cutting processes produce
different wood strip lengths. Consequently, we have to establish statistical process control charts for each bench
separately.

3. SPC Charts and Implementation for Wood Cutting Benches
In order to capture the variation from the output of cutting benches (1) & (2) and control the process, we established
control charts for X̄ & R to monitor the process because our measurements were continuous. Data were recorded by
measuring tape. 30 samples (m = 30) of wood strips, each of sample size 3 (n = 3) have been collected from cutting
process (1). Table 4 shows the collected length measurements (cm) for wood strips form cutting bench (1). Normality
assumption has been checked by probability plot from Minitab software and was valid.

                                          © IEOM Society International                                                255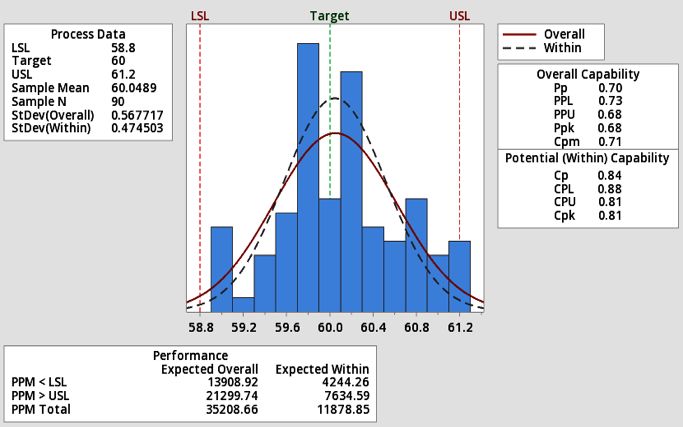
Proceedings of the International Conference on Industrial Engineering and Operations Management
Dubai, UAE, March 10-12, 2020

By using Minitab software, we constructed trial control charts for X̄ and R for wood strips from cutting bench (1) as
shown in Figure 2. As it can be seen from Figure 2, averages of samples 14 and 20 have exceeded the UCL of X̄
control chart. Therefore, the process is out-of-control and this control chart could not be adopted for monitoring the
process. Furthermore, capability analysis for cutting bench (1) has been conducted by Minitab software as shown in
Figure 3. As suggested by Simanová and Gejdoš (2015), capability indexes are used for valuation of capability and
are based on normality assumption of data fitting to monitor quality features. Capability index (Cp) is the rate of the
hypothetical capability of the process to confirm that the quality feature falls within tolerated quality limits. In practice,
Cp= 1.33 can be considered as the minimum benchmark value, because there is always a certain variation, and the
measurement process will never be a perfectly matched state as stated by Simanová et al. (2019). The result from
Minitab shows that CPU
Proceedings of the International Conference on Industrial Engineering and Operations Management
Dubai, UAE, March 10-12, 2020

The Cpk, Ppk, and Cpm are all smaller than 1.33, which does not reach the minimum value for a capable process
benchmark industry. Ppk
Proceedings of the International Conference on Industrial Engineering and Operations Management
Dubai, UAE, March 10-12, 2020
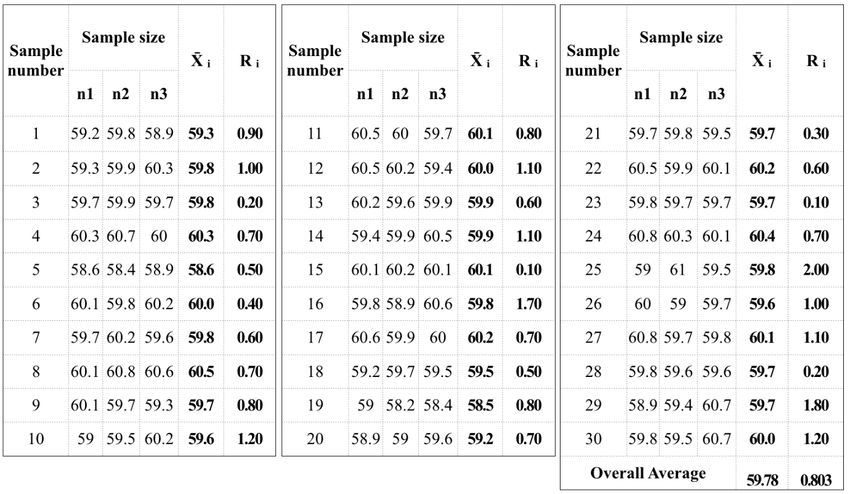
Table 5. Length measurements (cm) for wood strips from cutting bench (2)
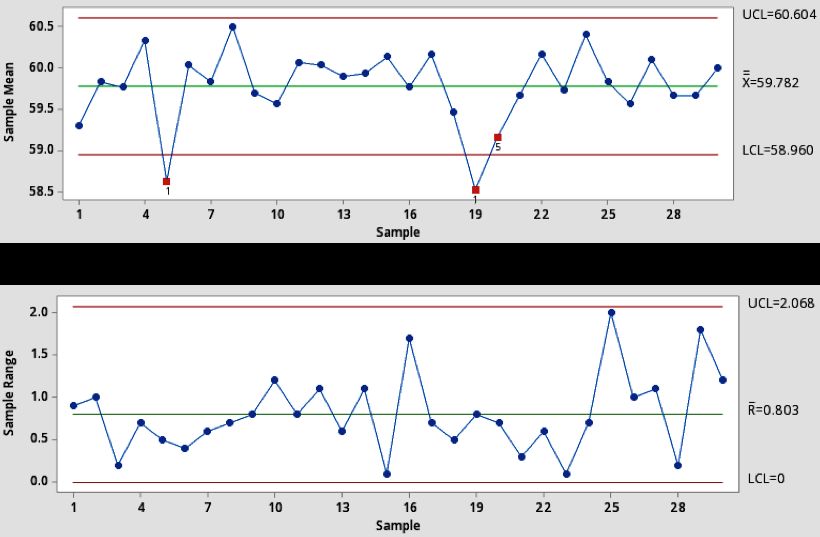
X̄ - chart
R - chart
Figure 4. Control chart for cutting bench (2)
© IEOM Society International 258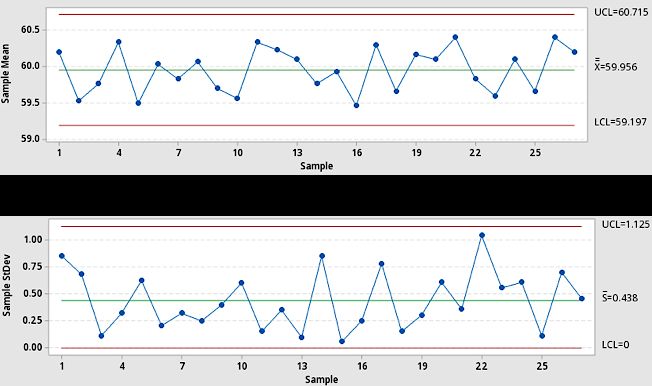
Proceedings of the International Conference on Industrial Engineering and Operations Management
Dubai, UAE, March 10-12, 2020
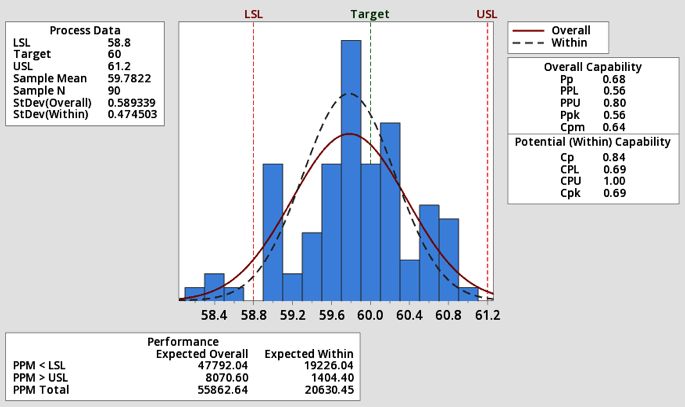
Figure 5: Process capability analysis for cutting bench (2)
4. Revised Control Charts for Bench (1) and Bench (2)
In order to monitor the process in the future, control charts must be established based on the capability of the process.
Therefore, previously constructed control charts for both cutting benches will be revised by removing out of control
points. The out of control points 14 and 20, as shown in Figure 2, had exceeded the UCL of X̄ control chart of cutting
bench (1). After removing these points, we conduct the new control chart as shown in Figure 6 below. The center line
(CL) has been decreased from 60.049 cm to 59.956 cm with no out-of-control points. These SPC carts can now be
used for the cutting bench 1 to control the process in the future.
X̄ - chart
R - chart
Figure 6 Revised control chart for cutting bench (1)
© IEOM Society International 259Proceedings of the International Conference on Industrial Engineering and Operations Management
Dubai, UAE, March 10-12, 2020
The same procedure is repeated for the cutting bench (2). First, excluding out-of-control points and then conducting
the new control charts by Minitab, the SPC charts shown in Figure 7 could be used for monitoring the bench 2 process
in the future. The CL become closer to nominal value of 60 cm in this case. By using these charts, operator can respond
when an out of control or special cause is detected by plotting the outcome of the process. SPC requires immediate
response to a special cause signal.
X̄ - chart
R - chart
Figure 7 Revised control chart for cutting bench (2)
5. Discussion and Evaluation
From our observations of the cutting processes in the factory, we noticed that the operators were taking measurements
with bended measuring tape, which is one of the main reasons or the assignable cause for the sample to be out-of-
control in the process at cutting bench (1). This also resulted in the process being not capable to produce wood strips
within control limits. Also, the absence of a locking template to secure the wood strips properly before cutting is
another reason for the out of specification cuts. The cutting table as well as the locking template are made of wood
and thus the sawdust generated around them play major role in sliding the template couple of mm and causing out of
specification cuts. Furthermore, the lock itself has no safety device to protect the template from getting loose by time;
it pushes the wooden bars into the template. Lastly, the operator uses his hand to tight the template which probably
vary from operator to operator. The consequence is a shifting in the process. We recommended to add a rigid tape
which can be fixed in the edge of the table and on top of the template, so no wrong measurement is taken. For the lock
in the template, secured double sided lock could significantly reduce number of parts produced out of the specification
limits. Normally, automated machines with accurate cutting measures are heavily used in furniture manufacturing
industry. This will increase productivity and reduce number of parts falling out of tolerance limits.
The economic evaluation of the proposal was that estimated number of units exceeding the tolerance limit is more
than 10% in total. Any wood strips fallout of the tolerance limit by 2% would have to be fixed by sending the wood
strips back to reworking station. On average, Reworking process takes 4 minutes. The expected overall estimation
shows that 43,714 parts per year falls outs of the specification limit. Without any improvements in these processes
and no out-of-control-action plan (OCAP) will result in (4 min.)x(43714 fallouts)/60=2915 hours of wasted time as
reworking process per year. The result is factory loss opportunity of producing 114 sofa units, or average company
monetary loss in total of 7,030 KWD (or about 22,200 US Dollars) per year. This loss is also ignoring the material
lost as a result of these fallouts. Based on these analysis, the management was asked to take the necessary actions in
order to improve the quality of cutting wood strips in order to avoid the losses calculated.
© IEOM Society International 260Proceedings of the International Conference on Industrial Engineering and Operations Management
Dubai, UAE, March 10-12, 2020
6. Conclusion
This project aims to improve the quality of sofa furniture production by implementing engineering statistics & quality
control techniques to reduce process variability. This results in reducing excess material waste and opportunity loss,
as well as increasing the level of perfection in order to meet customer requirements. Based on the study, we were able
to address a significant analysis which could result in improvement of furniture manufacturing processes by applying
statistical process control tools. Based on capability analysis, the company has huge opportunity to reduce financial
burden by increasing the capability of production processes up to (1.25). Also, by applying quality control charts,
company could be able to assure accurate monitoring of the process stability and eliminate erroneous results.
As a further research, it is helpful to establish quantitative indicators to easily capture any sort of shifting of a certain
process which can be used to cut off overhead cost significantly. Other quality attributes, in addition to length of strip
wood cuts, should be monitored by control charts, which would play important roles in process monitoring in furniture
industry. One of important measure that should be stringently controlled is the fabrics cut and sewn to fit the sofa
units. A lot of wasted material and quality control problems can be seen in these processes and need detailed study
and analysis. Such studies can minimize wasted fabric material, contribute to company profits and also economy of
the country in general. Because of time limitations, this issue could not be included in this study.
References
Dyckman, T.R., and Zeff, S.A., Important Issues in Statistical Testing and Recommended Improvements in
Research, Econometrics, vol. 7, no. 2, 2019.
Kim, T., T-test as a parametric statistic, Korean Journal of Anesthesiology g, vol. 68, no. 6, pp. 540-546, 2015.
Koa, L., and Green, C., Analysis of Variance: Is There a Difference in Means and What Does It Mean, Journal of
Surgical Research, vol. 144, no. 1, pp. 158-170, 2008.
Montgomery, D. C. , Introduction to Statistical Quality Control, 6th Edition, John Wiley & Sons, Inc 2008.
Obučina, M. and Hasanić, S. (2018) "Defining Causes of Defects and Quality Control Points in the Industry of
Furniture," Proceedings of the 29th DAAAM International Symposium, pp.0388-0393, B. Katalinic (Ed.),
Published by DAAAM International, ISBN 978-3-902734-20-4, ISSN 1726-9679, Vienna, Austria.
Seabra Junior, E., Armin, F., Santos, R. F., Siqueira, J, Schmidt, C., and Proenca, G. (2017) "Statistical and quality
control tools applied to the process of wooden furniture production," Intern. Wood Products Journal, 8:3, 161-
165.
Simanová, L., and Gejdoš, P. (2015) "The use of statistical quality control tools to quality improving in the furniture
business," Procedia Economics and Finance, vol. 34, no. 7-8, pp. 276 – 283.
Simanová, Ľ., Sujová, A. and Gejdoš, P. (2019) "Improving the Performance and Quality of Processes by Applying
and Implementing Six Sigma Methodology in Furniture Manufacturing Process," Drvna industrija, vol. 70, no. 2,
pp. 193-202.
Biographies
Dr. Mehmet Savsar is a professor of Industrial Engineering at Kuwait University. He is also affiliated with Üsküdar
University in Istanbul, Turkey. He holds MSc and PhD degrees from the Pennsylvania State University, USA, in the
areas of Industrial Engineering and Operations research. He has been teaching Industrial Engineering in various
countries over the past 38 years. His research interests include quality, reliability, and maintenance management, JIT
production, flexible manufacturing, and production control. He has over 90 journal publications and over 100
conference papers. He is on editorial boards of several international journals and conferences.
Eng. Hazza Alotaibi is a senior student in Industrial Engineer Department at Kuwait University. He is currently
serving in the Kuwait Ministry of Defense as an officer. He is working in the simulation and quality department. He
has been involved with several military projects.
© IEOM Society International 261You can also read