Quantifying the real-life impacts of vaccination on critical COVID-19 - OSF
←
→
Page content transcription
If your browser does not render page correctly, please read the page content below
Quantifying the real-life impacts of vaccination on critical COVID-19

Mircea T. Sofonea1,*, Corentin Boennec1, Anne Fontalirant2, Marjolaine
Regnat2, Jean-Yves Lefrant2, Samuel Alizon1, Marc Olivier Fischer3

1. MIVEGEC, Univ. Montpellier, CNRS, IRD -- Montpellier, France.
2. UR-UM103 IMAGINE, Université de Montpellier, Pôle Anesthésie Réanimation
Douleur Urgence, CHU Nîmes -- Nîmes, France
3. Normandie Univ., UNICAEN, CHU de Caen Normandie, Service d’Anesthésie
Réanimation -- Caen, France
* corresponding author: mircea.sofonea@umontpellier.fr

ORCID
MTS 0000-0002-4499-0435
CB 0000-0001-9183-282X
SA 0000-0002-0779-9543
JYL 0000-0002-7774-2497
MOF 0000-0002-8887-2377

Abstract

SARS-CoV-2 vaccines have individual prophylaxis effects. However, quantifying the
overall vaccine impact on critical COVID-19 forms is difficult because it requires
accounting for the reduction in community spread. Using a transmission model
validated with hospital data, we investigated counterfactual scenarios with variable
vaccine effects. We estimate a transmissibility reduction from vaccine breakthrough
infections of 43% ([32 -- 55]% 95%-likelihood interval) and that 39,100 critical care
stays ([26,100 -- 57,100] 95% confidence interval) and 47,400 ([36,200-62,800])
hospital deaths were prevented by the French vaccination campaign by August 20
2021, i.e. a 46% and 57% relative prevention of these outcomes. Despite the greater
effectiveness of individual prophylaxis, the largest prevention of critical COVID-19
forms originated from the collective component of vaccine protection. These results
are consistent with trends we identify in worldwide data and point towards a
community benefit of achieving high vaccine coverages.

Keywords
SARS-CoV-2, critical care, hospital mortality, quantitative epidemiology, modelling,
public health.
Introduction

The rapid discovery and deployment of the SARS-CoV-2 vaccines, along with their
high efficiency in preventing symptomatic COVID-19, which ranges 66.9 and 95%
[1]–[5], has put vaccination at the centre of the fight against the ongoing deadly
pandemic[6]. To date, we still lack a quantification of how these vaccines prevent the
most severe cases of COVID-19, especially in terms of critical care admissions and
deaths. This is particularly important because in many countries the occupancy of
critical care units (CCU) is the main criteria used to implement or alleviate
lockdowns, which have huge medical, economical, and social consequences.

One possibility to assess the impact of vaccination on severe forms of COVID-19 is
to harness the worldwide heterogeneity in vaccine coverage and investigate how
mortality is impacted by vaccination. However, this approach is limited because
mortality may vary for other reasons than vaccination and in order to quantify the
effect of vaccination on critical care stays and death, it is necessary to develop a
mathematical model capturing transmission dynamics. This is because anti-SARS-
CoV-2 vaccines partially prevent infection [7] and secondary transmission [8],
thereby reducing viral community spread.

With more than 70% first-dose vaccine coverage by late August, France is one of the
top 10 most vaccinated large countries [6]. It is therefore an ideal case study for
assessing the hospital deaths and critical care stays the vaccination program had
averted so far and is to prevent by the end of the year. Furthermore, its national
hospital admission dynamics are well captured by existing models [9].

Using epidemiological modelling we quantify the direct (purely individual and critical-
form related prevention) and indirect (purely collective and exposure-related
prevention) impacts of vaccination in France.
Methods

We first assessed vaccine-induced reduction in COVID-19 mortality burden by
confronting the current worldwide heterogeneity in vaccine coverage to the relative
case fatality ratio (rCFR). The rCFR captures the change in fatality among cases
over the past 12 months (thus avoiding seasonality bias) and allows comparing
countries with different demography, health and surveillance systems. The function
linking vaccine coverage to real-life mortality was then inferred by a generalized
additive model (Figure 1). For weighting purposes, we focused on large countries
with substantial viral circulation, the data of which are compiled in [6].

Using a published modelling framework tailored for the French COVID-19 epidemic
[9] (Supplementary Figure 1), we reconstructed the temporal variations in the
infectious contact rate. This contact rate aggregates the effect of non pharmaceutical
interventions (NPI), variant-related transmissibility increase, as well as behavioural
and weather changes, while controlling for post-infection immunity [10] and the age-
stratified vaccine rollout (Supplementary Figure 2).

Vaccination was assumed to have three distinct prophylactic components (Figure
2A):
i) an anti-infection effect, set to 40%[7], [11] and defined as the reduction in the
probability of being infected by the SARS-CoV-2 upon exposure, compared to a non-
vaccinated non-immunized individual.
ii) an anti-critical disease effect, defined as the reduction in probability of developing
complications which may lead to critical care and/or hospital death if infected by the
SARS-CoV-2, compared to a non-vaccinated individual. Its value was set to reach a
88% reduction of the probability of developing a critical COVID-19 upon exposure in
vaccinated people [12].
iii) an anti-secondary transmission effect, defined as the reduction in contagiousness
of vaccine breakthrough infections, as supported by recent results [8]. Given the
limited data, this parameter was directly inferred by our framework.

Using the inferred baseline infectious contact rate, we simulated the course of the
epidemic according to four vaccination scenarios (Figure 2B): the actual vaccines,
purely collective vaccines, purely individual vaccines and without vaccination. We
then compared the counterfactual dynamics to data and actual vaccine projections to
estimate the prevented number of critical care stays and hospital deaths prevented
(see the Supplementary Methods for more details).
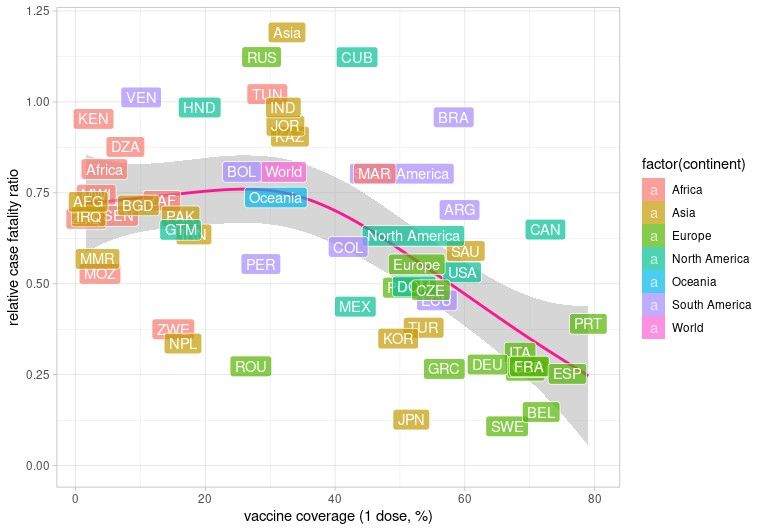
Results

Figure 1 exhibits a non-linear trend between relative case fatality ratio (rCFR) and
vaccine coverage. While rCFR values below 1 may be explained by testing
capacities and hospital care improvements, no vaccine-related fatality reduction is
evidenced for low coverage (
Discussion

Several clinical studies and few field studies estimated the efficiency of vaccines to
prevent SARS-CoV-2 infections, severe COVID-19, or secondary transmission.
However, quantifying the vaccination impact on critical COVID-19 forms, while
accounting for both collective and individual vaccine benefits, is challenging. Using a
mechanistic mathematical model capturing the hospital dynamics of the COVID-19
epidemic in France, we first estimated that breakthrough infection transmissibility is
reduced by >40% compared to infections in non-immunized hosts. Furthermore, by
performing counterfactual simulations, we estimated that on August 20, 2021 the
vaccination campaign had prevented almost 40,000 critical care stays and more than
47,000 deaths, respectively representing reductions by 46% and 57% of these
outcomes. This beneficial effect of vaccination is expected to increase by the end of
the year.

Despite the lower effectiveness of vaccines in preventing re-infection and secondary
transmission compared to critical illness, the collective component of the prophylaxis
accounted for the majority of spared critical care admissions and deaths in the
model. This finding is consistent with the non-linear decrease in national fatality ratio
with vaccine coverage observed worldwide, which is about 5 times greater if half of
the population is vaccinated.

Although the model used was shown to accurately capture critical COVID-19
dynamics [13], several limitations must be noted. First, the hospital-related
probabilities rely on the SARS-CoV-2 strains circulating in 2020 [14], but studies
indicate a potential increased virulence of lineages circulating in 2021 [15].
Furthermore, vaccination is modelled in a simplified way assuming maximum
efficiency 14 days after the first dose. Similarly, in all of the scenarios, the
extrapolations until the end of the year rely on the assumption that the infectious
contact rate estimated in mid August 2020 will not vary, which is unlikely with, for
instance, the beginning of the school term.

Performing similar analysis in other countries would help improve public health
policies and vaccination campaigns. This is particularly important given the potential
non-linear positive effect of vaccination coverage on reducing critical COVID-19
burden.
.

Figure 1. Relative case fatality ratio as a function of first-dose vaccine
coverage.
Each point corresponds to a country (indicated by its 3-letter ISO code) or the
aggregated continent or worldwide point (indicated by background color), the
coordinates of which is based on the last data available from [6] on August 20, 2021.
For weighting purposes, only countries with more than 10 million inhabitants and
more than 1,000 COVID-19 deaths over the last 12 months are considered. The
case fatality ratio (CFR) is calculated as the weekly-averaged fraction of COVID-19
confirmed deaths among confirmed cases 14 days earlier (as to account for the test-
to-death delay). In order to circumvent testing effort, death reporting and age
pyramid heterogeneities for comparison purposes, we here show the relative case
fatality ratio (rCFR) on the y-axis, defined as the CFR divided by its average value
over the last year time period (Aug 21 2020 - Aug 20 2021). The pink curve and grey
shaded area corresponds to mean and 95% confidence interval of a generalized
additive model (GAM) regression.
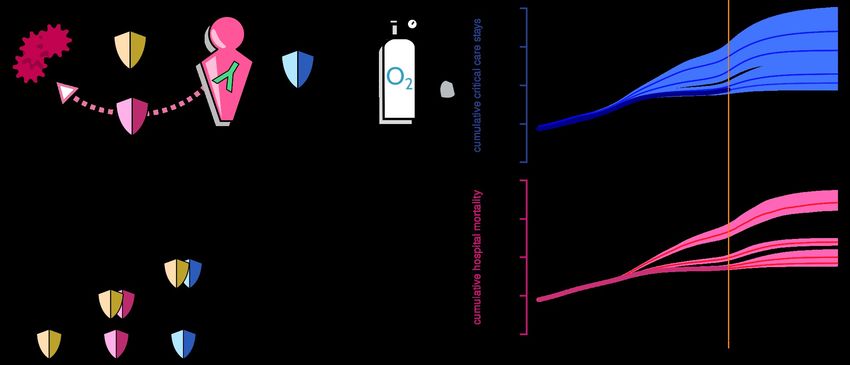
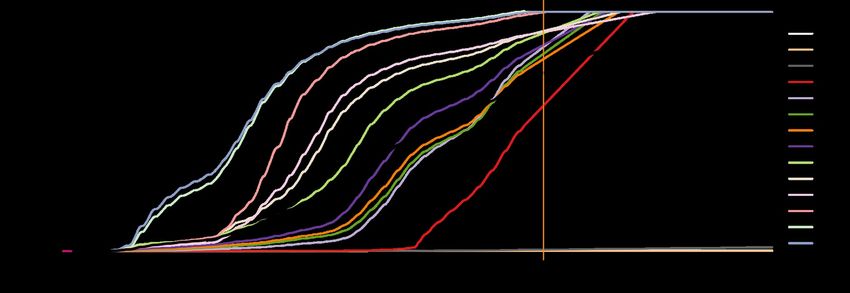
Figure 2. Critical care stays and hospital mortality in counterfactual scenarios
with variable vaccine effects .
A. Schematic view of vaccine effect modelling. Each shield represents a quantitative
reduction in the probability of event occurrence. The three prophylactic components
are: prevention against infection (yellow shield), prevention against secondary
transmission (red shield) and prevention against critical COVID-19 (blue shield).
B. The counterfactual scenarios include all (1), none (4) or some, either purely
collective (2) or purely individual (3), prophylactic components of the vaccine. he
anti-infection component has both individual and collective impacts so its reduction
has to be transferred to the other components in scenarios 2 and 3 to decipher
between direct and indirect vaccine benefits. Note that because scenarios 3 and 4
induce a major increase in critical care stays, NPI (or any equivalent behavioural
change) have to be applied to cap CCU overload.
C. Critical care stays and hospital mortality in France in 2021 (including projections).
The time window spans over 2021 (the vaccination campaign started on Dec 27,
2020 in France). Dots show the actual cumulative counts, which are initialized on
the first day of the French COVID-19-related hospital database SI-VIC [16], on Mar
18 2020. Scenario labels are those of panel B. The projected trends are based on
the Aug 14 - Aug 20 2021 reproduction number assuming no other change in the
epidemiological dynamics apart from the increase in vaccine and post-infection
population immunity. The solid curves represent the median output of the simulated
models while the shaded area represents the 95% range spanned by the
simulations.
Up to Aug 20 2021                         Up to Dec 31 2021
                    (data compared to no-vaccine       (actual vaccine projection compared to no-
                              scenario)                             vaccine scenario)

Prevented       n [95% CI]           RP (%) [95% CI]   n [95% CI]             RP (%) [95% CI]
outcomes

Critical care
stays           39,100               46 [36 -- 55]     67,000                 57 [47 -- 64]
                [26,100 -- 57,100]                     [51,800 -- 86,100]

Hospital
deaths          47,400               57 [50 -- 64]     78,700                 65 [58 -- 71]
                [36,200 -- 62,800]                     [65,800 -- 97,300]

Table 1. Critical care stays and hospital deaths prevented by the anti-SARS-
CoV-2 vaccination in France according to the no-vaccine counterfactual
model.
n: median absolute number, CI: compatibility interval, RP: median relative
prevention.
Conflict of interest None. Funding None. Ethics The Institutional Review Board of the Nîmes university hospital approved this study (see https://doi.org/10.1016/j.accpm.2020.10.012). Acknowledgments The authors thank the Nîmes and Caen university hospitals, the universities of Caen and Montpellier, the CNRS and the IRD for their logistical support.
References

  [1] F. P. Polack et al., ‘Safety and Efficacy of the BNT162b2 mRNA Covid-19 Vaccine’,
  N. Engl. J. Med., vol. 383, no. 27, pp. 2603–2615, Dec. 2020, doi:
  10.1056/NEJMoa2034577.
  [2] L. R. Baden et al., ‘Efficacy and Safety of the mRNA-1273 SARS-CoV-2 Vaccine’, N.
  Engl. J. Med., vol. 0, no. 0, p. null, Dec. 2020, doi: 10.1056/NEJMoa2035389.
  [3] M. Voysey et al., ‘Safety and efficacy of the ChAdOx1 nCoV-19 vaccine (AZD1222)
  against SARS-CoV-2: an interim analysis of four randomised controlled trials in Brazil,
  South Africa, and the UK’, The Lancet, vol. 397, no. 10269, pp. 99–111, Jan. 2021, doi:
  10.1016/S0140-6736(20)32661-1.
  [4] P. T. Heath et al., ‘Safety and Efficacy of NVX-CoV2373 Covid-19 Vaccine’, N. Engl.
  J. Med., Jun. 2021, doi: 10.1056/NEJMoa2107659.
  [5] J. Sadoff et al., ‘Safety and Efficacy of Single-Dose Ad26.COV2.S Vaccine against
  Covid-19’, N. Engl. J. Med., vol. 384, no. 23, pp. 2187–2201, Jun. 2021, doi:
  10.1056/NEJMoa2101544.
  [6] M. Roser, H. Ritchie, E. Ortiz-Ospina, and J. Hasell, ‘Coronavirus pandemic (COVID-
  19)’, Our World Data, 2020, [Online]. Available: https://ourworldindata.org/coronavirus
  [7] A. Puranik et al., ‘Comparison of two highly-effective mRNA vaccines for COVID-19
  during periods of Alpha and Delta variant prevalence’, Public and Global Health,
  preprint, Aug. 2021. doi: 10.1101/2021.08.06.21261707.
  [8] M. C. Shamier et al., ‘Virological characteristics of SARS-CoV-2 vaccine
  breakthrough infections in health care workers’, Aug. 2021. doi:
  10.1101/2021.08.20.21262158.
  [9] M. T. Sofonea et al., ‘Memory is key in capturing COVID-19 epidemiological
  dynamics’, Epidemics, vol. 35, p. 100459, Jun. 2021, doi:
  10.1016/j.epidem.2021.100459.
  [10]        V. J. Hall et al., ‘SARS-CoV-2 infection rates of antibody-positive compared
  with antibody-negative health-care workers in England: a large, multicentre, prospective
  cohort study (SIREN)’, The Lancet, vol. 397, no. 10283, pp. 1459–1469, Apr. 2021, doi:
  10.1016/S0140-6736(21)00675-9.
  [11]        Health Ministry of Israel, ‘Epidemiological report’, Jul. 2021. Accessed: Aug.
  12, 2021. [Online]. Available: https://www.gov.il/BlobFolder/reports/vaccine-efficacy-
  safety-follow-up-committee/he/files_publications_corona_two-dose-vaccination-data.pdf
  [12]        Public Health England, ‘SARS-CoV-2 variants of concern and variants under
  investigation’, 17, Jun. 2021. [Online]. Available:
  https://assets.publishing.service.gov.uk/government/uploads/system/uploads/
  attachment_data/file/1001354/Variants_of_Concern_VOC_Technical_Briefing_17.pdf
  [13]        M. T. Sofonea and S. Alizon, ‘Anticipating COVID-19 intensive care unit
  capacity strain: A look back at epidemiological projections in France’, Anaesth. Crit. Care
  Pain Med., (in press), doi: 10.1016/j.accpm.2021.100943.
  [14]        M. O’Driscoll, C. Harry, C. A. Donnelly, A. Cori, and I. Dorigatti, ‘A
  comparative analysis of statistical methods to estimate the reproduction number in
  emerging epidemics with implications for the current COVID-19 pandemic’,
  Epidemiology, preprint, May 2020. doi: 10.1101/2020.05.13.20101121.
  [15]        K. A. Twohig et al., ‘Hospitalisation risk for SARS-CoV-2 Delta (B.1.617.2)
  compared with Alpha (B.1.1.7) variants of concern: a cohort study’, Jul. 2021, doi:
  10.17863/CAM.72862.
Supplementary Material
Supplementary Methods

Worldwide overview

The case fatality ratio (CFR), i.e. the frequency of COVID-19 deaths among reported
cases, was calculated by dividing the 7-day-averaged daily mortality by the 7-day-
averaged daily incidence 14 days earlier. For weighting purposes, we focused on
large countries with substantial viral circulation (>10 million inhabitants and >1,000
COVID-19 deaths). For each country, we considered the
average CFR calculated on the most recent days of available data in [6].
CFRs are difficult to compare because of strong differences between countries in
terms of spatial and temporal testing, death reporting, demography, and epidemic
waves. To minimise these effects and reduce the sources of heterogeneity specific
to a country, we computed a relative case fatality ratio (rCFR) by scaling each
country’s CFR with its mean value computed between 21 August 2020 and 20
August, 2021. The 12 months duration was chosen for the normalisation because
vaccination was deployed from 0 to almost 80% first-dose vaccine coverage and
because a shorter interval could introduce biases related to seasonality. Intuitively, if
the rCFR is greater than 1, it means that the countries’ CFRdecreased in the last 12
months. We then studied the link between the rCFR and the vaccination coverage in
the 68 countries analysed using a generalized additive model (GAM) regression to
capture non-linear trends.
Epidemiological modelling

The inference proceeded as described in [9], based on the French COVID-19-related
hospital database SI-VIC [16] up to Aug 20 2021. The reference model/actual
vaccine scenario (#1 in Figure 2B) consisted in a pool of 101 equivalent parameter
sets in the sense of hospital mortality likelihood over the whole course of the
epidemic. The median relative error on the the cumulative hospital deaths and critical
care stays (summed from Mar 19 2020) of the inferred model compared to Santé
Publique France data was respectively of -2.7% ([-6.2 -- 1.1]% 95% range) and -
0.6% ([-5.8 -- 5.3]%). The epidemic simulated with the reference model after the last
datapoint was based on the trend observed on the last documented week (Aug 14 -
20 2021), with no further change in parameters after that time point, thus
optimistically assuming a slow decay in epidemic during fall, which is not guaranteed
as the schools reopens and the weather cools down.

Based on the aforementioned conservative settings and the underlying inferred
baseline contact ratio of the reference model, we investigated three counterfactual
scenarios (#2, #3 and #4 in Figure 2B). Because in the counterfactual scenarios #3
(purely individual vaccines) and #4 (no vaccination) the vaccine contribution to the
reduction in SARS-CoV-2 community spread is absent, the incidence grows faster
than in the reference model once the third metropolitan French lockdown has been
lifted. To account for the fact that the epidemic wave would not fully unfolded for
various reasons (e.g. local and national implementations non pharmaceutical
interventions, spontaneous behavioural change, spatial saturation [18]), we imposed
a uniform correction factor on the baseline transmission rate from June 9 2021
(when major national restrictions were lifted) so that the median daily ICU admission
would not exceeds 700 patients nationwide, which was the order of magnitude at the
peak of the first wave [16]. This translated respectively in a 23% and 30% reduction
of the contact rate for the direct-benefit-only model and no-vaccine model
respectively. Finally, we estimate the number of ICU admissions and hospital deaths
prevented by the vaccine by comparing the simulated outputs of the two
counterfactuals models to the actual data and projected reference model
respectively for the Aug 20 and Dec 31 2021 time points. Note that the compatibility
intervals associated to the latter time point are based on the quantile of pairwise
comparisons between runs of each model.
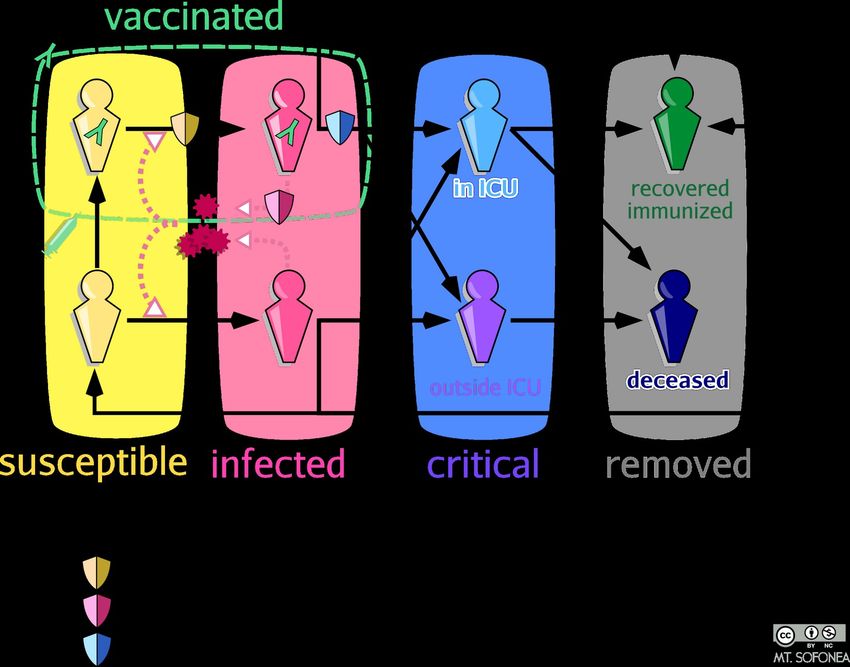
Supplementary Figures & Table

Supplementary Figure 1. Epidemiological model (COVIDSIM) structure with
vaccination (for a given age class).
In the model, each age class is split into compartments (here depicted by the
figurines) according to their infectious, clinical and immunological statuses.
Susceptible individuals (in yellow) can be infected if exposed to the SARS-CoV-2
particles emitted by infected individuals in the community (in pink). A fraction of
infected individuals develop a critical COVID-19 form, defined as requiring critical
care and/or leading to hospital death. Vaccination is implemented following the VAC-
SI time series [17] and assumed to reduce the probability of three events, namely
being infected if exposed, transmitting the virus if infected and developing critical
complications if infected. Additionally, we assume that all individuals having
recovered from a post-vaccine infection are immunized, contrary to unvaccinated
individuals a fraction of which can become infected again [10]. Formal and
parametrization details are provided in [9], the system of which was updated
according to this flow chart.
Supplementary Figure 2. Nationwide vaccine rollout in France (actual and
projected). The colored curves represent the relative proportion of first-dose
vaccinated people in each age class according to the French VAC-SI database [17],
while the black line corresponds to the populationwide vaccine coverage. The
vaccine rollout extrapolation is based on the Aug 14 - Aug 20 2021 figures and
capped at 99% for each age class. The vertical orange bar represents the day of the
last datapoint.
purely individual vaccines                            purely collective vaccines
                        (scenario 3 compared to scenario 4)                   (scenario 2 compared to scenario 4)

                 Up to Aug 20 2021            Up to Dec 31 2021         Up to Aug 20 2021          Up to Dec 31 2021

Prevented       n            RP (%)        n            RP (%)        n            RP (%)       n             RP (%)
outcomes        [95% CI]     [95% CI]      [95% CI]     [95% CI]      [95% CI]     [95% CI]     [95% CI]      [95% CI]

Critical care   18,700       22            24,700       21
stays           [6,900 --    [8.7 -- 34]   [9,900 --    [9.1 -- 33]   38,700       45           55,300        47
                32,300]                    43,900]                    [29,300 --   [38 -- 53]   [35,500 --    [32 -- 58]
                                                                      51,300]                   76,100]

Hospital        34,000       41            51,600       43            45,200       54           71,200        59
deaths          [25,000 --   [32 -- 49]    [38,800 --   [35 -- 51]    [37100 --    [48 -- 60]   [55,600 --    [49 -- 66]
                45,400]                    70,200]                    56,000]                   90,600]

Supplementary Table 1. Critical care stays and hospital deaths prevented by
the individual and the collective components of anti-SARS-CoV-2 vaccination
in France according to counterfactual models.
n: median absolute number, CI: compatibility interval, RP: median relative
prevention.
Supplementary bibliography [16] Santé Publique France, ‘Données hospitalières relatives à l’épidémie de COVID-19 - data.gouv.fr’, 2020. https://www.data.gouv.fr/fr/datasets/donnees- hospitalieres-relatives-a-lepidemie-de-covid-19/ (accessed Aug. 13, 2021). [17] Santé Publique France, ‘Données relatives aux personnes vaccinées contre la Covid-19 (VAC-SI) - data.gouv.fr’, 2021. https://www.data.gouv.fr/fr/datasets/donnees- relatives-aux-personnes-vaccinees-contre-la-covid-19-1/ (accessed Aug. 13, 2021). [18] O. Thomine, S. Alizon, M. Barthelemy, C. Boennec, and M. T. Sofonea, ‘Emerging dynamics from high-resolution spatial numerical epidemics’, Apr. 2021, doi: 10.5281/zenodo.4680003.
You can also read